Dynamic Response of the Supercritical
CO
2Brayton
Recompression Cycle to Various System Transients
by:
MASSACHUSETTS INST UTE OF TECHNOLOGY
Tri Q. Trinh
AUG 19 2009
Honors Bachelor of Science, Nuclear EngineeringUniversity of New Mexico, December 2006
LIBRARIES
Submitted to the Department of Nuclear Science and Engineering in partial fulfillment of the requirements for the degree of
Master of Science in Nuclear Science and Engineering at the
ARCHIVES
Massachusetts Institute of Technology January
2009-© Massachusetts Institute of Technology 2009. All Rights Reserved
Author
t(
V Department of Nuclear Science and Engineering January 30, 2009 Certified byDr. Pavel Hejzlar Principal Research Scientist Thesis Supervisor Certified by
Dr. Michael Driscoll Professor E'meritus of Nuclear Scie ce and Engineering
/V
pThesis Sup9visorAccepted by
t b. Jacquelyn Yanch
Dynamic Response of the Supercritical CO2 Brayton Recompression
Cycle to Various System Transients
by
Tri Q. Trinh
Submitted to the Department of Nuclear Science and Engineering on January 30, 2009 in Partial Fulfillment of the
requirements for the Degree of Master of Science in Nuclear Science and Engineering
Abstract
The supercritical carbon dioxide (SCO2) power conversion system has been suggested for use with many of the Generation IV nuclear reactors. The SC0 2 cycle is highly attractive
because of its low operating temperatures and high efficiency associated with working near the critical point of CO2. Unfortunately, the appealing features of using CO2 near its
critical point create complications in control. The Transient SCO2 Cycles Code
(TSCYCO) has been developed as a transient simulation control design and cycle scoping code for the recompression SC02 Brayton cycle. It is based off of the SC02 Power
Systems (SCPS) code, and incorporates many improvements and modifications. Written in FORTRAN 90, TSCYCO uses a lumped parameter model and a momentum integral model approach. The code uses a semi-implicit solution process and implements
Gaussian elimination to solve the system of equations. Transient behavior of the printed circuit heat exchangers is determined via the previously developed code HXMOD.
Turbomachinery performance is modeled using the Real Gas Radial Compressor (RGRC) code with a scaling scheme for off-design conditions.
Currently, TSCYCO has the capability of modeling several transients, including: loss of external load (LOEL), power load change, and cycle low-temperature change.
Simulations show that TSCYCO can be run at quasi-steady state for an indefinite period of time. In the case of a 10% LOEL, the axial turbine experiences choke as a result of shaft overspeed. Turbine choke can be avoided if one bypasses more flow during LOEL. Moreover, one can incorporate more accurate axial turbine performance models to account for shaft speed variation. TSCYCO experiences instabilities when operated too closely to the critical point of CO2. This could be remedied with a more robust Runge-Kutta solution method.
Thesis Supervisor: Pavel Hejzlar
Title: Research Scientist, Nuclear Science and Engineering Thesis Supervisor: Michael Driscoll
Acknowledgements
First and foremost, I would like to express my deepest appreciation for my thesis advisors, Dr. Pavel Hejzlar and Professor Emeritus Michael Driscoll. Their wisdom, experience, and patience have made this work possible. They were great advisors who were always helpful and available, providing insight at every weekly meeting. Without their presence and guidance, this work would have been a daunting and difficult
undertaking.
I would also like to thank Dr. Shih Ping Kao and Dr. Nate Carstens. The work and papers that they put out have contributed to this thesis significantly. Kao put forth the initial effort that this work was based upon. His documentation provided light where needed to understand the initially unfamiliar models. Carstens' work further clarified the purpose and theory and was supplemental to understanding key concepts. Thanks to Sandy Ludington, who has also put forth significant effort in other research areas that was helpful to this work.
The opportunity to perform this research would not be possible without the
supportiveness and funding of the people at Sandia National Laboratories. I am grateful to have taken part in the One Year On Campus (OYOC) Master's Degree Program at Sandia. Particularly, I would like to thank my former manager David Wheeler, research scientist Steven Wright, and university programs administrator Bernadette Montano. Finally, I would like to thank my family and all my friends in Albuquerque, NM and Boston, MA. Throughout this work, they were always there to make for more pleasant memories in graduate school and effective venting of the frustrations involved with research. Unexpected life changes occurred near the end of this work. The completion
of this work was due, in part, to the supportiveness of all of my loved ones. With heartfelt sentiment, I would like to thank my father and dedicate this work to him. Even though he is no longer alive, his life experiences led him to value education, which he
Table of Contents
DYNAMIC RESPONSE OF THE SUPERCRITICAL CO2 BRAYTON RECOMPRESSION CYCLE
TO VARIOUS SYSTEM TRANSIENTS ... 1
ABSTRACT ... 3 ACKNOWLEDGEMENTS ... 5 TABLE OF CONTENTS ... 6 LIST O F FIG UR ES ... 9 LIST O F TA BLES ... 12 1 INTR O DU C TION ... 13 1.1 BACKGROUND ... ... 13
1.2 SCO2 BRAYTON RECOMPRESSION CYCLE... 15
1.2.1 Recompression Cycle Layout... ... 15
1.2.2 Printed Circuit H eat Exchangers ... ... 18
1.2.3 Turbom achinery... .... ... ... ... 18
1.3 PREVIOUS W ORK... ... ... 19
1.3.1 Steady State Analysis... 19
1.3.2 Transient A nalysis ... 19
1.3.3 Printed Circuit Heat Exchanger M odels ... 21
1.3.4 Turbomachinery Models... ... 21
1.3.5 Experimental Loops... 23
1.4 PROJECT OBJECTIVES AND CONTRIBUTIONS ... 24
1.5 REPORT ORGANIZATION... ... 26
1.6 CHAPTER SUMMARY ... .... ... 27
2 SIMULATION CODE AND METHODS ... 28
2.1 CHAPTER INTRODUCTION ... 28
2.2 SUPERCRITICAL CO2 POWER SYSTEM SIMULATION CODE ... ... 29
2.3 M ODELING APPROACH ... 30
2.3.1 Assumptions ... 31
2.3.2 Control Volume Energy, Mass, and Momentum Model... ... 32
2.3.2.1 Momentum Integral (MI) Model... ... ... 32
2.3.2.2 Control Volume Definition ... ... 34
2.3.2.3 Energy and Mass Conservation Model Derivation... 35
2.3.2.4 Energy and Mass Conservation Matrix Elements ... 41
2.3.2.5 Momentum Conservation Model Derivation... 41
2.3.2.6 Angular Momentum Conservation Model... 43
2.3.2.7 Conservation Equation Coupling ... ... 45
2.4 NUMERICAL MODEL EXAMPLES ... ... 46
2.4.1 Simple SC02 Brayton Cycle... ... ... 46
2.4.1.1 Energy and Mass Conservation Model ... ... 46
2.4.1.2 Hydraulic and Angular Momentum Conservation Model ... 50
2.4.2 SC02 Recompression Cycle... ... ... 52
2.4.2.1 Energy and Mass Conservation Model ... ... 52
2.4.2.2 Hydraulic and Angular Momentum Conservation Models... ... 56
2.4.3 Primary Loop... 61
2.4.3.1 Differences Between Primary and Secondary Loops ... 61
2.4.3.2 Energy Conservation Model ... ... 61
2.4.3.3 Prim ary Loop System of Equations ... .. ... ... 62
2.5 FLUID PROPERTIES ... ... 63
2.5.1 NIST RefProp... ... .... ... 64
2.6 TURBOMACHINERY PERFORMANCE MODEL ... 65 2.6.1 Compressor M odel ... 65 2.6.1.1 Pressure H ead... ... 65 2.6.1.2 Efficiency... ... . . ... 69 2 .6 .1.3 P ow er ... ... 7 1 2.6.2 Turbine M odel ... 72 2.6.2.1 Pressure Head... ... ... 72 2.6.2.2 Effi ciency... ... 74 2.6.2.3 Pow er ... ... . ... 74
2.6.3 Turbomachinery Effect on Hydraulic and Angular Momentum Conservation ... 75
2.7 PRINTED CIRCUIT HEAT EXCHANGERS ... ... 78
2.7.1 P C H E SS M odel... ... 78
2.7.1.1 M odel Developm ent ... ... ... 78
2.7.1.2 Coding M ethodology ... 81
2.7.2 PCHE Transient M odel ... ... ... 81
2.7.2.1 M odel Developm ent ... ... ... 81
2.7.2.2 Coding M ethodology ... 83
2.8 TSCYCO SIMULATION CODE LAYOUT... ... 85
2.8.1 Initialization of Recompression Cycle Steady State Operating Conditions... 85
2.8.2 SC02 Recompression Cycle Transient Simulation Subroutines... 90
2.9 CHAPTER SUMMARY ... 93
2.10 NOMENCLATURE FOR CHAPTER 2 ... ... 94
3 CYCLE CO NTRO L ... 97
3.1 PLANT CONTROL ... ... ... 97
3.1.1 Valves ... 97
3.1.1.1 Theory... 97
3.1.1.2 Recompression Cycle Controls ... ... 99
3.1.1.3 Loss of External Load ... 100
3.1.1.4 B ypass V alve ... . .... 101
3.1.2 Inventory Control ... ... 101
3.1.2.1 B ackground... ... 102
3.1.2.2 Dynamic Modeling ... ... ... 104
3.1.3 Cycle Low-temperature Control... 105
3.1.4 Low-Temperature and Inventory Control... ... 106
3.1.5 Section Summary ... ... 107
3.2 CONTROLLERS ... ... 108
3.2.1 PID Control Theory ... ... 108
3.2.1.1 Proportional Component ... 108
3.2.1.2 Integral Com ponent... ... ... 109
3.2.1.3 Derivative Component ... ... 110
3.2.1.4 Ideal versus Standard PID Controller... ... .. 110
3.2.1.5 Implementation of PID Controller into TSCYCO... ... I11 3.2.2 PID Tuning ... ... 111
3.2.3 PI Controllers Present in the TSCYCO Recompression Cycle ... ... 113
3.2.3.1 Reactor Power Control Model... I 14 3.2.3.2 Flow Split Valve Control M odel ... 114
3.2.3.3 Recompression Compressor Throttle Control Model... 115
3.2.3.4 Turbine Throttle Control Model...1... 115
3.2.3.5 Bypass Valve Control Model ... 116
3.2.3.6 Low-Temperature Control Model ... 116
3.2.3.7 Inventory Control M odel... 117
3.3 TSCYCO CONTROLLER SUBROUTINES ... 118
3.3. 1 Controller Initialization ... ... ... 118
3.3.2 Controller Transient Response... 120
3.4 C HA PTER SUM M A RY ... ... 122
4 SIM ULATIO N RESULTS ... 123
4.2 10% LOSS OF LOAD ... 133
4.3 CHAPTER SUMMARY ... ... 147
5 SUMMARY, CONCLUSIONS, AND FUTURE WORK ... 148
5.1 SUMMARY ... ... 148
5.1.1 Background. ... ... 148
5.1.2 Previous Work ... ... 150
5.1.3 Project Objectives and Contributions... 151
5.1.4 Simulation Code and Methods... 151
5.1.5 Cycle Controls ... ... 152
5.1.6 Controllers... ... ... 154
5.1.7 Sim ulation Results ... ... 155
5.2 CONCLUSIONS ... ... 157
5.3 SUGGESTED FUTURE IMPROVEMENTS ... 157
6 R EFER EN C ES ... 159
7 APPENDIX A: TSCYCO QUICKSTART GUIDE ... 161
7.1 APPENDIX INTRODUCTION ... 161
7.2 A PPENDIX G OALS... 161
7.3 TSCYCO INPUT FILE FORMAT ... 161
7.3.1 Printed Circuit Heat Exchangers ... ... ... 162
7.3.2 Turbom achinery ... ... ... 164
7. 3.3 Valves ... ... ... ... 165
7. 3.4 H eaders... ... 166
7.3.5 Shaft ... .. ... 167
7. 3.6 Byp ass L ocation... ... 168
7.3.7 Inventory Control Tank ... 168
7.3.8 Plant Controllers ... ... 169
7.3.9 Primary Loop... 170
7.3.10 Simulation and Transient Parameters ... 172
7.3.11 Output Plot Title ... 173
7.3.12 Section Sum m ary... 173
7.4 EXAMPLE PROBLEM ... ... 174
7.4.1 Printed Circuit Heat Exchangers ... 180
7.4.2 Turbomachinery. ... ... ... 181
7.4.3 H eaders... . ... 181
7.4.4 O ther Inp ut F iles ... 18 1 7.5 RUNNING TSCYCO AND PLOTTING DATA ... 182
7.6 APPENDIX CONCLUSION... 184
8 APPENDIX B - NOTABLE DIFFERENCES BETWEEN TSCYCO AND SCPS ... 185
8.1 A PPENDIX INTRODUCTION ... ... 185
8.2 SIMPLIFICATION OF THE REACTOR MODEL ... 185
8.2.1 Inp ut F ile C hanges ... 185
8.2.2 Code Structure Changes... 187
8.2.3 Heat Transfer Time Delay... ... 187
8.2.4 Reactor D ecay H eat... 191
8.2.4.1 Theory... ... ... 191
8.2.4.2 Decay Heat Model . ... ... 192
8.2.4.3 Decay Heat Implementation... ... 192
8.2.5 Different Scenarios ... 193
8.2.5.1 40% Loss of Load ... 193
8.2.5.2 20% Power Swing... ... ... 196
8.2.5.3 100% LOL ... ... 196
8.3 SODIUM-COOLED FAST REACTOR ... 201
8.3.1 Code Changes for an SFR ... 202
8.3.2 Heat Transfer Correlations for Liquid Metal Flowing Through a Noncircular Conduit... 202
8.3.2.1 Lyon and Martinelli Heat Transfer Correlation ... 203
8.3.2.2 Other Heat Transfer Correlations ... ... ... ... 203
8.4 APPENDIX CONCLUSION... 206
List of Figures
Figure 1.1. CO2 Density (from Carstens2) ... ... 14Figure 1.2. CO2 Isobaric Heat Capacity (from Carstens2) ... 14
Figure 1.3 SCO2 Brayton Recompression Cycle ... ... 16
Figure 1.4. SCO2 Recompression Cycle Entropy versus Temperature Diagram (from C arsten s2) ... ... ... 16
Figure 1.5. PCS Cycle Efficiency Versus Turbine Inlet Temperature (from Dostal4)... 17
Figure 1.6. PCHE Flow Path and Chemically Etched Channels (LHS from Langewisch) ... 1 8 Figure 1.7 SCO2 Brayton Loop Simple Cycle ... .. 20
Figure 1.8. COSMOS Loop (from Sohn25)... 23
Figure 1.9. Sandia Brayton Loop (from Wright3 1) ... ... 24
Figure 2.1. Control Volume Definition for the SC0 2 PCS... 34
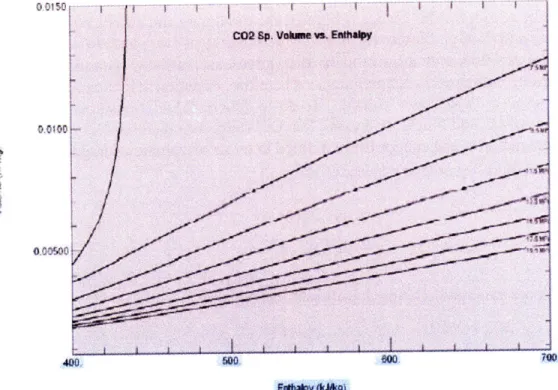
Figure 2.2. CO2 Enthalpy versus Specific Volume (taken from Hejzlar9) ... 37
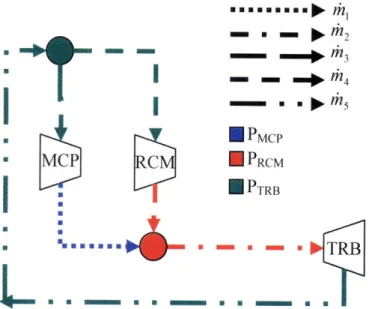
Figure 2.3. Recompression Cycle Mass Flow Rate Definitions ... 56
Figure 2.4. Main Compressor Pressure Ratio Map (from Ludington 5) ... 66
Figure 2.5. Main Compressor Efficiency (from Ludington 5) ... 66
Figure 2.6. Recompression Compressor Pressure Ratio Map (from Ludington 5) ... 67
Figure 2.7. Recompression Compressor Efficiency (from Ludington 5)... 67
Figure 2.8. Radial Main Compressor Normalized Performance Map ... 68
Figure 2.9. Radial Recompression Compressor Normalized Performance Map... 68
Figure 2.10. Normalized Main Compressor Efficiency Map ... . 70
Figure 2.11. Normalized Recompression Compressor Efficiency Map ... 70
Figure 2.12. Axial Turbine Curve (From Carstens2) ... ... 72
Figure 2.13. Axial Turbine Normalized Performance Map ... . 73
Figure 2.14. Normalized Turbine Efficiency ... 74
Figure 2.15. PCHE Model Nodalization Scheme (from Langewisch'3)... 79
Figure 2.16. HXMOD SS and Transient Coding Structure (from Hejzlar9)... 84
Figure 2.17. TSCYCO Schematic of SS Operating Condition Method ... 86
Figure 2.18. TSCYCO Recompression Cycle Schematic for Dynamic System Sim ulations ... ... 91
Figure 3.1. Form Loss Coefficient as a Function of Relative Stem Position... 98
Figure 3.2. Recompression Cycle Valve Controls... 100
Figure 3.3. Inventory Control for the SC02 Simple Cycle ... ... 103
Figure 3.4. System Behavior for Inventory Tank #1 (left) and Inventory Tank #2 (right) (from Y an32)... 104 Figure 3.5. Inventory Tank Dynamic Modeling ... 104
Figure 3.6. Inventory Control Region of Concern (from Carstens2) ... 107
Figure 3.7. Proportional Controller Response ... 109
Figure 3.8. Proportional-Integral Controller... 109
Figure 3.10. Tuning Integral Response [TSCYCO Results]... 113
Figure 3.11. Reactor Power Control Block Diagram... 114
Figure 3.12. Valve Split Control Block Diagram ... 115
Figure 3.13. Turbine Power Control Block Diagram ... 115
Figure 3.14. Bypass Valve Control Block Diagram ... 116
Figure 3.15. Low-temperature Control Block Diagram... 116
Figure 3.16. Inventory Control Block Diagram... 117
Figure 3.17. Schematic of Controller Subroutine Initialization... ... 119
Figure 3.18. Schematic of Transient Controller Subroutines ... 121
Figure 4.1. TSCYCO Steady State Run - Core Power... 124
Figure 4.2. TSCYCO Steady State Run - Turbomachinery Power... 124
Figure 4.3. TSCYCO Steady State Run - PCHE Heat Transfer ... 125
Figure 4.4. TSCYCO Steady State Run - Cycle Flow Split to Main Compressor... 125
Figure 4.5. TSCYCO Steady State Run - Turbomachinery Pressure Ratio ... 126
Figure 4.6. TSCYCO Steady State Run - Compressor Exit Pressures... 126
Figure 4.7. TSCYCO Steady State Run - Turbine Exit Pressures ... 127
Figure 4.8. TSCYCO Steady State Run - Main Compressor Performance Parameters. 127 Figure 4.9. TSCYCO Steady State Run - Recompression Compressor Performance P aram eters ... 129
Figure 4.10. TSCYCO Steady State Run - Turbine Performance Parameters ... 129
Figure 4.11. TSCYCO Steady State Run - Main Compressor Inlet Temperature ... 130
Figure 4.12. TSCYCO Steady State Run - Precooler Water Flow Rate ... 130
Figure 4.13. TSCYCO Steady State Run - Flow Split Valve Stem Position ... 131
Figure 4.14. TSCYCO Steady State Run - Flow Split Valve Pressure Drop... 131
Figure 4.15. TSCYCO Steady State Run - Recompression Compressor Throttle Valve Pressure D rop ... 132
Figure 4.16. TSCYCO Steady State Run w/ No Flow Split Valve - Core Power... 132
Figure 4.17. TSCYCO Steady State Run w/ No Flow Split Valve - Turbine Exit Pressure ... 13 3 Figure 4.18. TSCYCO 10% LOL - Core Power ... 134
Figure 4.19. TSCYCO Figure 4.20. TSCYCO Figure 4.21. TSCYCO Figure 4.22. TSCYCO Figure 4.23. TSCYCO Figure 4.24. TSCYCO ...Figure 4...25. TSCYCO... Figure 4.25. TSCYCO Figure 4.26. TSCYCO Figure 4.27. TSCYCO Figure 4.28. TSCYCO Figure 4.29. TSCYCO 10% LOL - PCHE Heat Transfer ... ... .. ... 10% LOL - Turbomachinery Pressure Ratio ... 10% LOL - Compressor Exit Pressures ... 10% LOL - Turbine Exit Pressure ... 134 135 135 136 10% LOL - Main Compressor Performance Parameters ... 136
10% LOL - Recompression Compressor Performance Parameters ... 137
10% LOL - Turbine Performance Parameters ... 137
10% LOL - Flow Split Valve Pressure Drop ... 138
10% LOL - Recompression Compressor Throttle Pressure Drop ... .. ... 138
10% LOL - Bypass Valve Mass Flow Rate ... 139
10% LOL - Turbine Upstream Throttle Pressure Drop ... 139
Figure 4.30. TSCYCO 10% LOL - Cycle Flow Split to the Main Compressor ... 142 Figure 4.31. GAS-PASS/C02 10% Power Swing - Flow Split to the Main Compressor
Figure 4.32. TSCYCO 10% LOL - Main Compressor Inlet Temperature... 143
Figure 4.33. GAS-PASS/CO2 10% Power Swing - Main Compressor Inlet Temperature ... 14 3 Figure 4.34. TSCYCO 10% LOL - Main Compressor Inlet Pressure... 144
Figure 4.35. GAS-PASS/CO2 10% Power Swing - Main Compressor Inlet Pressure.. 144
Figure 4.36. TSCYCO 10% LOL - Turbomachinery Power ... 145
Figure 4.37. GAS-PASS/CO2 10% Power Swing - Turbomachinery Power ... 145
Figure 4.38. TSCYCO 10% LOL - Turbomachinery Mass Flow Rate... 146
Figure 4.39. GAS-PASS/CO2 10% Power Swing - Turbomachinery Flow Rates... 146
Figure 5.1. PCS Cycle Efficiency Versus Turbine Inlet Temperature (from Dostal4) ... 149
Figure 5.2 SCO2 Brayton Recompression Cycle ... 149
Figure 5.3. Recompression Cycle Valve Controls... 153
Figure 5.4. TSCYCO Steady State Run - Core Power... 155
Figure 5.5. TSCYCO Steady State Run - Turbine Exit Pressures ... 155
Figure 5.6. TSCYCO 10% LOL - Compressor Exit Pressures ... 156
Figure 5.7. TSCYCO 10% LOL - Turbine Exit Pressure ... 156
Figure 7.1. PCHE Input File ... 162
Figure 7.2. Main Compressor Input File ... 164
Figure 7.3. Flow Split Valve Input File ... 165
Figure 7.4. Recompression Cycle Header Layout (from CYCLES4,15)... 166
Figure 7.5. H eader Input File ... ... 167
Figure 7.6. Shaft Input File ... 167
Figure 7.7. Bypass Location Input File ... 168
Figure 7.8. Inventory Control Tank Input File ... 168
Figure 7.9. Controller Input Data... 169
Figure 7.10. Primary Loop Input File ... 170
Figure 7.11. Simulation and Transient Parameters Input File ... 172
Figure 7.12. Plot Title Input File ... 173
Figure 7.13. CYCLES Input File ... 177
Figure 7.14. CYCLES Output Data ... 180
Figure 7.15. 10% LOL Example Problem - Core Power ... 183
Figure 7.16. 10% LOL Example Problem - Turbomachinery Pressure Ratio ... 184
Figure 7.17. 10% LOL Example Problem - Bypass Mass Flow Rate... 184
Figure 8.1. SCPS and TSCYCO Code Structures for Calculating Reactor Power... 187
Figure 8.2. Operating Values of Neutronic and Thermal Powers... 188
Figure 8.3. Original SCPS Neutronic and Thermal Power Results ... 189
Figure 8.4. Neutronic and Thermal Powers for Different Time Delays ... 190
Figure 8.5. Average Core Temperature for Different Time Delays ... 190
Figure 8.6. Cycle Efficiency for Different Time Delays ... 191
Figure 8.7. New Normalized Power Calculation Scheme for TSCYCO Code ... 193
Figure 8.8. 40% LOL -Normalized Power - SCPS Results ... 194
Figure 8.9. 40% LOL -Normalized Power - TSCYCO Results ... 194
Figure 8.10 40% LOL - Cycle Efficiency -SCPS Results ... 195
Figure 8.11. 40% LOL - Cycle Efficiency -TSCYCO Results ... 195
Figure 8.12. 20% Power Swing - Normalized Power -SCPS Results... 197
Figure 8.14. 20% Power Swing - Cycle Efficiency -SCPS Results ... 198
Figure 8.15. 20% Power Swing - Cycle Efficiency -TSCYCO Results ... 198
Figure 8.16. 100% LOL - Core Power - SCPS Results... 199
Figure 8.17. 100% LOL - Core Power - TSCYCO Results ... 199
Figure 8.18. 100% LOL - Cycle Efficiency - SCPS Results ... 200
Figure 8.19. 100% LOL - Cycle Efficiency - TSCYCO Results ... 200
Figure 8.20. Slug Nusselt Numbers for a Rectangular Duct (from Hartnett and Irvine8 ) ... 2 0 4 Figure 8.21. Slug Nusselt Numbers for Circular-sector Duct and Isosceles-triangular Duct (from Hartnett and Irvine8) ... 205
Figure 8.22. Limiting Wall-temperature Distribution for Equilateral-triangular Duct with Constant Heat Flux Everywhere (from Hartnett and Irvines) ... 207
List of Tables
Table 2.1. Terms and Partial Derivatives for Equations 2.26 and 2.27 ... 39Table 2.2. d Element Matrix for Secondary Loop ... ... 47
Table 2.3. Jacobian Matrix for the Simple CO2 Brayton Cycle... . 47
Table 2.4. Jacobian Matrix Elements for the Simple Cycle Model ... 49
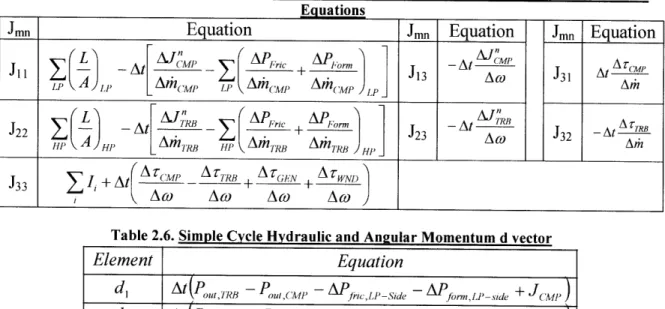
Table 2.5. Jacobian Matrix for the Simple Cycle Hydraulic and Angular Momentum Conservation Equations ... ... 51
Table 2.6. Simple Cycle Hydraulic and Angular Momentum d vector ... 51
Table 2.7. d Element Matrix for Secondary Loop Recompression Cycle ... 53
Table 2.8. Jacobian Matrix for Recompression Cycle... 53
Table 2.9. Elements of the Jacobian Matrix for the Recompression Cycle, Part 1 ... 54
Table 2.10. Elements of the Jacobian Matrix for the Recompression Cycle, Part 2 ... 55
Table 2.11. Recompression Cycle Hydraulic and Angular Momentum Conservation d V ector ... 59
Table 2.12. Elements of Jacobian Matrix for Recompression Cycle Momentum C onservation M odel... 60
Table 2.13. d Element Matrix for Primary Loop ... ... 63
Table 2.14. Jacobian Matrix for the Primary Loop... ... 63
Table 2.15. Change in Head and Torque With Respect to Mass Flow Rate and Shaft S p eed ... 7 7 Table 7.1. High-temperature Recuperator Data Reference... 181
Table 7.2. M ain Compressor Data Reference ... 181
1
Introduction
This chapter provides background information on the research performed, as well as an overview of topics to be discussed. The supercritical CO2 (SCO2) Brayton cycle is
different from other power conversion systems (PCS). Its nonlinear fluid properties near the critical point allow for efficient compression. However, it is these nonlinear
properties that complicate cycle control. Research has been performed by several authors to determine cycle behavior with SCO2 as a working fluid. The current work improves
on previous work performed.
1.1
Background
The Generation IV (Gen IV) effort aims to replace the current Generation III reactors with designs that meet several goals, including proliferation resistance and decreased electricity cost. Most of these Gen IV nuclear reactor concepts tend to have higher operating temperatures than the current reactors today. If one increases the cycle high-temperature, it is possible to increase the cycle efficiency, since the Carnot efficiency is dependent on the ratio between cycle low-temperature and cycle high-temperature. It is difficult to decrease cycle low-temperature, since it is restrained by ambient conditions. Moreover, operating at low cycle temperatures limits the deployment of a cycle to certain regions. At the other extreme, if one increases cycle high-temperature, caution should be taken with thermal limits of materials.
Utilization of high temperatures is a distinguishing feature of the Gen IV reactors. However, cycle efficiencies are not improved if the high-temperatures are not
accommodated appropriately. The efficiency increase of Rankine cycle used with current reactors is limited due to relatively low efficiency gain with temperature at higher core outlet temperatures of Gen IV reactors, and also requires going to high pressures (>30 MPa) to take advantage of higher operating temperatures. It is, therefore, advantageous to pursue a more accommodating PCS, such as the closed Brayton cycle.
The SCO2 Brayton cycle has long been proposed for use in converting thermal energy to electricity. The physical properties of CO2 near its critical point (30.9780C, 7.3778 MPa)
are advantageous in increasing the efficiency of an indirect Brayton cycle. Near the critical point, in the pseudo-critical region, the density of CO2 increases significantly
compared to ideal gas behavior. In the compressor component of an indirect Brayton cycle, this density increase is advantageous, because the compressor performs less work on denser fluids. This results in a net cycle efficiency increase, since:
W
-w
77cycle
Qin
Figure 1.1 provides a plot of temperature versus CO2 density for various pressures of
interest. The numerical labels shown adjacent to each curve will be discussed at a later time.
1000. 750. oo E mw 250. 0.0 .300 20.0 10.0 Temperature (OC)
Figure 1.1. CO2Density (from Carstens2)
200. 40
Temperature (°C)
As can be seen in Figure 1.1, CO2 density changes quickly near the critical point. In the case of isobaric specific heat capacity, property changes are more severe near the critical point, as seen in Figure 1.2. These large property variations can create problems in the design of turbomachinery and heat exchangers. Moreover, compressor performance is highly dependent on fluid inlet density. Large density variations can cause undesired system perturbations. When the specific heat capacity of SCO2 changes significantly in a
heat exchanger, temperature pinch points are likely. In the precooler, where CO2
properties are close to the critical point, the specific heat capacity of the fluid becomes very high. To cool the CO2 sufficiently, and thus obtain the desired compressor inlet
temperature, the cold-side H20 mass flow rate needs to be carefully controlled. A pinch point can occur inside a heat exchanger due to the large disparity of specific heat capacity between the cold and hot streams.
1.2
SCO
2Brayton Recompression Cycle
Significant work has been performed on SCO2 indirect Brayton cycles to accommodate
this undesirable behavior. The SCO2 recompression cycle utilizes two recuperators and
mass flow split between these recuperators to avoid a pinch point and further alleviate specific heat capacity concerns.
1.2.1 Recompression Cycle Layout
To understand how the SCO2 recompression cycle works, observe Figure 1.3. If we start at the turbine (point 6), SCO2 fluid has just been heated in the intermediate heat
exchanger (IHX, point 5). After expanding in the turbine, the fluid goes to the hot-side high temperature recuperator (HTR, point 7), where it transfers heat to fluid coming out of the parallel compressors. Upon exit from the HTR, the fluid enters the hot-side of the low temperature recuperator (LTR, point 8), where it transfers heat to fluid coming out of the main compressor. After leaving the LTR, there is a flow split, where a portion of the fluid goes to the recompression compressor (point 3), and the other portion goes to the pre-cooler (point 1). Fluid that enters the pre-cooler (point 1) is cooled further by an external heat sink, and cooled closer to its critical point. Fluid that is split towards the recompression compressor (point 3) is at a higher temperature because it did not go through the pre-cooler. Fluid pressure is increased in this component before merging with the cooler fluid (between points 3 and 4). Fluid that leaves the pre-cooler (point 1) goes into the main compressor where its pressure is raised, then enters the cold-side LTR (point 3), this fluid is heated, then exits and merges with flow from the recompression compressor (between points 3 and 4). With flow merged, the fluid now goes into the cold-side HTR, where it is heated further before going to the cold-side IHX (point 5). At this point, the fluid enters the turbine again and the cycle repeats.
Figure 1.3 SCO, Brayton Recompression Cycle 700 S400 200 100 0 0.75 1.25 1.75 2 25 2,75 3.25 Entropy (kJ/kg-K)
Figure 1.4 gives the T-S diagram representation of the recompression cycle. Note the highly recuperative feature of this cycle. Heat transport in the recuperators is
approximately twice that added in the IHX. Moreover, IHX heat addition occurs over a relatively narrow range (-I 500C). Also note the proximity of CO2 conditions to the
critical point near the main compressor inlet (point 1) in Figure 1.4. As can be seen, the two phase dome is approached, but not crossed. Near this critical point, CO2 density and
specific heat capacity changes rapidly, as seen in Figure 1.1 and Figure 1.2. Point 1 in these figures corresponds to the main compressor inlet conditions. One can also observe CO2 density and specific heat capacity at different points in the cycle by matching cycle points in Figure 1.4 with Figure 1.1 and Figure 1.2.
60
50 - - .
.... ... .
ca 3 0 ~ -..- - -- -...- ... -... .. .
a)
- - Supercritical CO2 cycle
-,- Helium Brayton cycle 10
-- -- Supercritical steam cycle -Superheated steam cycle 0 i
350 450 550 650 750 850 950
Turbine Inlet Temperature (*C)
Figure 1.5. PCS Cycle Efficiency Versus Turbine Inlet Temperature (from Dostal4)
Dostal4 performed a systematic, detailed major component and system design evaluation and multiple-parameter optimization on a family of supercritical CO2 Brayton power
cycles to determine the most cost and thermal efficient, compact, and simple cycle. He then compares the performance of these systems to other PCS designs, as seen in Figure
1.5. As can be seen, the SCO2 recompression cycle is the most attractive option for
turbine inlet temperature ranges above ~500C. To match the efficiency of the SCO2
recompression cycle at 5500 C, the helium Brayton cycle must operate at 7500C. Materials issues arise from operating at this higher temperature. This performance comparison does not include other advantages of the CO2 cycle, including the simpler
1.2.2 Printed Circuit Heat Exchangers
The compactness of SCO2 recompression cycles is due in large part to the development of the printed circuit heat exchanger. As previously mentioned, heat addition to the cycle occurs over a relatively narrow temperature range (-1500C). This means that the
recompression cycle requires highly efficient recuperators, where twice as much heat is recuperated versus added by the reactor4. If one uses shell-and-tube heat exchangers,
then very large heat exchanger volumes would be required to recuperate the needed heat, resulting in increased capital costs and a larger PCS footprint.
The HEATRICTM printed circuit heat exchangers are very compact, making them
favorable for SCO2 cycle designs versus shell-and-tube heat exchangers. The PCHEs are
comprised of thin 1.5 mm metal plates stacked on top of one another and diffusion bonded. Each plate has parallel straight or zigzag channels about 2 mm in diameter and hemispherical in shape. The RHS of Figure 1.6 provides an axial cross-sectional view of two plates diffusion bonded together. The hot and cold fluids entering the PCHE are counter-current, as seen on the LHS of Figure 1.6.
Figure 1.6. PCHE Flow Path and Chemically Etched Channels (LHS from Langewisch)
When fully assembled, the PCHE is about six times smaller than a shell-and-tube heat exchanger of the same capacity. Moreover, diffusion bonded metal plates have strengths comparable to the parent metall3. This means that the PCHE can accommodate the high pressures seen in the SCO2 recompression cycle. Finally, the small PCHE channels mean
that there are low fluid inventories. This results in higher responsiveness for control applications.
1.2.3 Turbomachinery
The compactness of the SCO2 PCS is credited not only to the PCHEs, but also to the size
of the turbomachinery. In general, radial dimensions of turbomachinery scale with volumetric flow rate. In comparison with ideal gas cycles, the CO2 is very dense near the
critical point. For main compressor inlet conditions in the recompression cycle, this means that the volumetric flow rate is very low. The main compressor size is, thus, very small relative to other power cycle compressors.
The turbine operates in a regime far from the critical region, where CO2 behaves like an ideal
gas. Therefore, its design is similar to that of other power cycles. This ideal gas behavior alleviates computational modeling of the turbine. However, in the case of the main compressor, the real gas properties must be accounted for to accurately model the component.
1.3
Previous Work
Significant work on the SC02 Brayton cycle has been performed recently to determine the most promising layout and control schemes for coupling to advanced nuclear reactor designs. Optimization codes have been developed to determine the most promising layout. The dynamic behavior of the Brayton cycle has been scrutinized. Experimental loops are currently under construction as well.
1.3.1
Steady State Analysis
Dostal wrote the code CYCLES to perform "a systematic, detailed major component and system design evaluation and multiple-parameter optimization under practical constraints on a family of supercritical CO2 Brayton power cycles for application to advanced nuclear reactors4." His analysis of SCO2 cycles placed an emphasis on efficiency and cost, and yielded the recompression cycle as the most promising choice. His results were plotted previously in Figure 1.5. Dostal's thesis also discusses implementation of controls to accommodate part-load operation and loss of external load transients. Legault subsequently made further improvements to produce CYCLES I133. The current work uses the most recent version names CYCLES III by Ludington15
1.3.2 Transient Analysis
Several authors have added to Dostal's efforts by developing codes to model the transient behavior of SCO2 Brayton cycles. Moisseytsev of Argonne National Laboratory (ANL), for
example, created the Plant Dynamics Code for the S-CO2 cycle. This code solves the
time-dependent energy, mass, and momentum conservation equations for SC02 and the
turbomachinery shaft dynamics equation. Further information on the details of the solution method implemented in this code is unknown, as it may be proprietary to ANL. However, results from this code are published and known to the academic community'920
At MIT, Carstens developed a code called Gas Plant Analyzer and System Simulator/CO2
(GAS-PASS/C0 2) that models the SCO2 recompression cycle. The code is based on a
previous code developed by Vilim at ANL. The original code, named GAS-PASS/He, models transient behavior for an ideal gas cycle. GAS-PASS is a simulation control design and system scoping tool for gas cycles coupled to a nuclear reactor1'2. The code is meant to
be used for rapid assessment and appropriate placement of cycle components based on their response in an integrated plant.
The code uses a one-dimensional lumped parameter approach and assumes perfect mixing in any specified control volume. Mass and energy are conserved, and a quasi-static momentum conservation equation is used. Momentum equation simplification creates a numerically stiff system, in that plant phenomena that occur on different time scales are not combined.
GAS-PASS/CO2 is modular and flexible. It allows any number or order of system
components because a defined component can be introduced throughout the plant2. The code is written in FORTRAN 90, and uses a general Newtonian root-finding algorithm (a modified Powell-Hybrid method), designed for non-linear systems of equations, to compute all variable values implicitly. For a transient scenario, the code solves the
system by using conservation equations. However, significant simplifications were introduced, such as the perfect mixing assumption and the quasi-static momentum equation. The method is fully implicit, where iterations are continued until the system of equations is within tolerance of the system root. Guesses for system solutions are
computed via the Jacobian matrix.
Kao developed the code Super-critical CO2 Power System (SCPS), which utilizes the
momentum integral model approach and a semi-implicit scheme. This code will be discussed in more detail in Section 2.2. Of particular note is that SCPS models the simple SC02 Brayton cycle as opposed to the recompression cycle. This cycle is
explained further here, and will be used as a reference for later discussion.
Hejzlar et al.9 researched a simple SC0 2 cycle layout, which was suited for medium
power, compact, load-following applications. The PCS is designed to operate in the range of 5 to 30 MWe, is more compact than recompression cycle, has high long-term reliability and performance, and shows potential for good controllability.
Figure 1.7 SCO, Brayton Loop Simple Cycle
The SCO2 simple cycle is illustrated in Figure 1.7. At point 3, the reactor coolant
transfers heat to the CO2 fluid via the intermediate heat exchanger (IHX). The CO2 fluid
then travels to the turbine (point 4) where it expands to a lower pressure. After
expanding through the turbine, the CO2 fluid goes through the recuperator (point 5) to transfer heat to the cold-side fluid that comes from the compressor outlet (point 1). The CO2 fluid then nears its critical point as its temperature is lowered in the precooler (point
6). After going through the precooler, the fluid pressure is raised by the compressor (point 1). The fluid then passes through the cold-side of the recuperator (point 2) before it goes through the IHX (point 3) and the cycle begins again.
1.3.3
Printed Circuit Heat Exchanger Models
The PCHE computer models implemented by Carstens' and Kao's codes come from work previously performed by Langewisch13. Remember that the SCO2 Brayton cycle is
highly recuperative, which requires highly efficient heat exchangers. If shell-and-tube heat exchangers are used, then the size of the PCS increases substantially. Thus, the PCHE is used for its compactness among other reasons. The use of CO2 as a working
fluid also presents modeling complications because of cycle operating conditions near the critical point.
For the precooler in the recompression and simple cycles in Figure 1.3 and Figure 1.7, cycle behavior is significantly affected by main compressor inlet temperatures. If the CO2 fluid approaches its critical point within the precooler, then its specific heat capacity
increases significantly, as seen in Figure 1.2. The computer model must be able to accurately model PCHE performance. The precooler component, when placed in an integrated system, has a significant effect on cycle behavior since it is upstream of the main compressor.
Traditional methods for shell-and-tube heat exchangers, such as the Log Mean Temperature Difference (LMTD) method, cannot be used to determine outlet
temperatures of a PCHE using CO2 as a working fluid. LMTD treats a heat exchanger as
a black box and gives the user fluid outlet conditions with no consideration for what is happening inside. Therefore, if a pinch point occurs, the axial location where it occurs is unknown. The PCHE using CO2 working fluid must be nodalized and modeled along the
fluid flow path. Langewisch developed the MATLAB code HXMOD to determine PCHE steady state and transient behavior for the real gas CO213. More details on the
solution method will be discussed in Section 2.7.
1.3.4 Turbomachinery Models
The real gas behavior of CO2 presents challenges not only in PCHE models, but in
turbomachinery models as well. For the recompression cycle main compressor in particular, operation near the critical point creates difficulties in design and component simulation.
A mean line compressor design code was developed by NASA in the early 1970s called Centrifugal Compressor Design (CCD). Also developed by NASA was the meanline code called Centrifugal Compressor Off-Design (CCOD), which predicted off-design performance of centrifugal compressors. These codes were designed for use with ideal
gases, which is not the case with CO2 in the simple and recompression Brayton cycles.
Gong9 performed significant modification to these codes to allow for modeling of real
gases like CO2 near and above its critical point. Many modifications to CCD and CCOD
involved developing a set of polynomials for determining fluid properties for SCO2.
The axial compressor turbomachinery maps developed by Gong were used by Carstens in GAS-PASS/CO2. A set of performance maps was used to determine compressor
turbomachinery response to off-design conditions. Performance maps gave curves for specific shaft speeds. Thus, during operation, interpolation between curves was
necessary to accurately model compressor behavior. Carstens suggests a cubic spline and linear interpolation method for this situation. Moreover, he also provides correlations to account for fluid property variations2. It is shown in his thesis that Carstens' method is capable of capturing all the major physics effects for turbomachinery performance. Another simpler scaling method of determining turbomachinery performance is proposed by Carstens in Appendix D of his thesis2. This method allows for back of the envelope
calculations and initial testing of other dynamic modeling codes. Instead of using a set of performance maps, only one performance map is used. Variation in turbomachinery performance is dependent on several variables, including mass flow rate, density, and shaft speed. Kao's code SCPS implements this method for modeling turbomachinery behavior. This scaling method is also used in this work, and it will be discussed further in Section 2.6.
SCPS uses generic centrifugal compressor maps, partly because more accurate performance maps became available late in project development. The current work utilizes polynomials based on compressor curves developed by the Real Gas Radial Compressor (RGRC) code. RGRC is recently developed by Ludington, and is
significantly different from the modified CCD and CCOD codes developed by Gong. It was determined by Ludington that there were disagreements between CCD and CCOD when run for CO2. In particular, performance maps developed by CCOD did not agree in
some cases with results produced by CCD. Ludington wrote a new code in a more user-friendly FORTRAN 90 format, where he eliminated the earlier problems observed in CCD and CCOD and expanded the capability to design radial compressor with more than
1 stage (up to 3 stages).
Turbine behavior for a real gas is not modeled in detail. For the temperature range of interest, CO2 behaves as an ideal gas at the turbine inlet. Thus, turbine design codes for
1.3.5 Experimental Loops
As can be seen, much work has been performed to accurately model the SCO2 Brayton
cycle and its components that make it unique from other power conversion systems. The validation and verification of these models is performed by benchmarking against
experimental results. Sohn of Seoul National University is currently developing the COSMOS loop to study the SCO2 recompression cycle Brayton loop, as seen in Figure
1.8. It uses a lead-cooled reactor as the reference plant25.
C~s Trk HP wTOW
Figure 1.8. COSMOS Loop (from Sohn5)
The heater and depressuriser are the reactor and turbine models, respectively. It should be noted that this loop utilizes shell-and-tube heat exchangers for the recuperators,
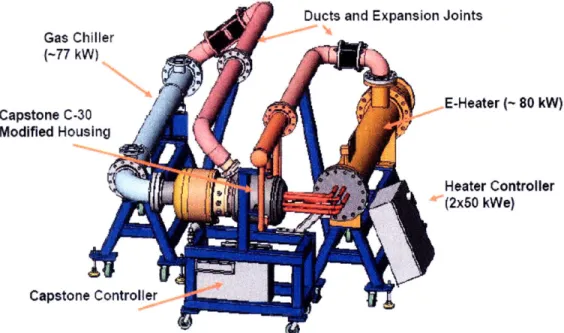
precooler, and IHX. Moreover, a separate loop has been built to test precooler efficiency. At Sandia National Laboratories, the first phase of the Sandia Brayton Loop (SBL) has been installed and is operating. Its design follows that of the SCPS simple cycle in Figure 1.7. The system design is based on the Capstone micro-turbine power plant31 Heat addition is accomplished via an electric heater, which is capable of providing about
80 kWt and 1000 K outlet temperatures. The loop uses a "30 kWe Capstone C-30 gas-micro-turbine generator that normally operates at 1144 K turbine inlet temperature with shaft speed of 96,000 rpm31." Tests have been made using several gases as working fluid
- including CO2 - but not in its supercritical regime. Recent experiments performed in support of SCO2 Brayton cycle work include compressor behavior near the critical point
of CO2. This comparison is the lead component in a program to assemble a new test loop
simulating a supercritical CO2 power cycle. A schematic of the SBL is provided in
Ducts and Expansion Joints Gas Chiller (-77 kW) Capstone C-30 E-Heater (- 80 kW) Modified Housing Heater Controller (2x50 kWe) Capstone Controller
Figure 1.9. Sandia Brayton Loop (from Wright31)
1.4 Project Objectives and Contributions
As found by Dostal4, the SCO2 Brayton recompression cycle offers efficiencies and costs
that are competitive with other power conversion systems like the Rankine steam cycle and He Brayton cycle. Moisseytsev' 9,2 0 and Carstens1
,2 have investigated the dynamic behavior of this integrated layout for various transients. Carstens' code2 utilizes a fully implicit general Newtonian root-finding algorithm and many simplifying assumptions (e.g. quasi-static momentum conservation and perfect mixing). The fully-implicit solution method can be computationally expensive and increase simulation run-time. Moreover, simplifying assumptions may cause non-physical solutions.
Kao's SCPS9 code makes less assumptions and models fluid properties more accurately within component control volumes. The momentum integral (MI) model is used to solve the conservation equations for the integrated system. A semi-implicit scheme is
implemented to determine system behavior. SCPS code models and assumptions make it more appealing for use in determining SCO2 Brayton cycle dynamic behavior.
However, SCPS models the SCO2 simple cycle layout and not the recompression cycle
layout. It is, therefore, the goal of this work to use SCPS models to develop a new code based around the recompression cycle layout. This new code is based on the SCPS code, and modifies SCPS directly into a recompression cycle layout. SCPS was recently completed at the time this work was started. Thus, there are additional changes made to the code, which will be documented in this report. Significant modifications led to the development of the final product named Transient Supercritical Cycle Code (TSCYCO).
The major contributions of this work are listed below:
1. Simplification of the reactor model used for heat addition to the PCS. SCPS uses a detailed light water reactor (LWR) model, which accounts for reactivity of the control rods, fuel rod dimensions, etc. This level of detail is unneeded, since the focus of the work is the indirect Brayton cycle. Moreover, applications will be primarily to non-LWRs. The simplification of the reactor model to a "black box" heat source, as implemented in TSCYCO, is discussed.
2. Modification of the reactor model from an LWR to a sodium-cooled fast reactor (SFR). Motivation for making this change stems from the choice of the sodium-cooled fast reactor for GNEP research efforts. Moreover, the sodium-sodium-cooled fast reactor is one of the proposed Gen IV concepts. Heat transfer correlations and SCPS code changes are discussed.
3. Development and derivations of the models used for the recompression cycle. The conservation equations used to model the simple cycle are different from the recompression cycle. The development of the recompression cycle model is discussed in-depth in this report, and implemented in TSCYCO. The
development of these models represents a significant fraction of the effort in this work. Working with SCPS revealed several problems that were fixed. One of these problems included decoupled angular and hydraulic momentum
conservation equations. Moreover, the momentum conservation equation was decoupled from the energy and mass conservation equations. The models implemented in TSCYCO remedy these problems and are discussed further in Section 2.3.2.7.
4. SCPS turbomachinery models are overly simplified and result in some unphysical behavior. The implementation of turbomachinery performance into the system momentum conservation equations has some issues, which TSCYCO fixes. Moreover, SCPS models the turbine as a valve that expands the fluid. This model may not capture the true dynamic behavior of the integrated system. Normalized axial turbine maps are implemented into TSCYCO to capture the true
turbomachinery behavior.
5. Because of the parallel compressor feature of the recompression cycle, more controls are needed in comparison to the simple cycle. These controls include the cycle flow split valve and recompression compressor throttle. Realistic valve models are implemented into TSCYCO. These valve models are also
implemented in the upstream turbine throttle. A dynamic model of the inventory control tank is added to TSCYCO as well. This feature was not included in SCPS.
6. Plant controllers are modified and use the widely known proportional integral derivative (PID) scheme. SCPS implements a lead/lag compensation controller, which is not widely known. Furthermore, there is no discussion on the
background of this controller or how to tune it in the SCPS report. Therefore, the more common PID controller is used in TSCYCO, and it is documented in this report. The tuning of the TSCYCO controllers to give the desired system response are documented here as well.
1.5
Report Organization
The report is organized into five chapters and two appendices as follows:
Chapter 1 presents a brief introduction on SC0 2 Brayton cycles and previous work
performed. Steady state and transient behavior literature is reviewed regarding the integrated system and system components.
Chapter 2 provides all the models used to simulate the recompression cycle in detail. The chapter is broken into many key parts.
* The SCPS code and its features are reviewed.
* The modeling approach for cycle components is discussed. Implementation of the momentum integral model in the conservation equations is covered. The coupling and semi-implicit schemes implemented are explained, and they are followed by examples utilizing the simple cycle, recompression cycle, and primary loop.
* Calculation of CO2 fluid properties is briefly covered.
* The turbomachinery models used in TSCYCO are presented, and they allow for calculation of turbomachinery pressure rise, efficiency, and power. * The solution method developed by Langewisch 3 for PCHE steady state and
transient analysis is examined.
* A description of TSCYCO code structure integrates all theory previously discussed. This section clearly presents all the subroutines used in TSCYCO to calculate the steady state and transient solutions for the recompression cycle. Relevant equations and theory are also referenced within this subsection.
Chapter 3 briefly looks at the components implemented into the TSCYCO
recompression cycle to control its behavior. Valve models used to control the flow split and turbine pressure head are discussed. The dynamic inventory control tank model is covered. This chapter also gives background regarding the PID controller, its implementation into TSCYCO, and tuning techniques.
Chapter 4 presents some simulation results from TSCYCO. Simulation conditions and controller set points are covered. Explanation is given for unexpected cycle behavior.
Two appendices are provided to supplement the main body of the report and also to aid code users:
* Appendix A: TSCYCO Primer, serves as a guide for new code users. The chapter explains how to use TSCYCO by going through an example and explaining concepts along the way.
* Appendix B: Notable Differences Between TSCYCO and SCPS, discusses the simplification of the reactor model to a black box heat source. The heat transfer correlations to change from an LWR to an SFR are discussed as well.
1.6
Chapter Summary
This chapter provided a brief overview of the SCO2 Brayton cycle, and its applications to
Gen IV reactors. Advantages and disadvantages are discussed. The recompression and simple cycle layouts are briefly covered, and the PCHE and turbomachinery components are discussed. Previous work on the steady state cycle, dynamic cycle, and experimental loops are summarized, and provide the background for further work in this report. The rest of the report discusses the motivation for continued work on dynamic simulation of the recompression cycle. The major contributions and contents of the report are briefly overviewed.
2 Simulation Code and Methods
2.1
Chapter
Introduction
In this chapter, the simulation code, Transient Supercritical Cycle Code (TSCYCO), is examined in detail. This chapter will provide the reader with the ideas and theory needed to model the complex SCO2 recompression cycle. The solution method implemented in
TSCYCO is different from that of other authors. The chapter is divided into seven sections.
1. The first section provides a brief overview of the SCPS code, which TSCYCO is based upon. It will introduce the reader to the basic solution method and the objective of the work.
2. The second section provides an overview of the numerical model. The
assumptions of the TSCYCO code are stated, and models are derived for arbitrary control volumes. Derived models come from the general conservation equations. Angular momentum conservation equations relevant to the energy conversion cycle are reviewed as well.
3. The third section applies the theory discussed in the second section. The purpose of this section is to enhance the readers understanding of the theory. Moreover, the actual equations implemented in the recompression cycle layout are discussed here.
4. The fourth section provides a brief overview of the NIST RefProp code. The reader will learn about key features of the properties code, and implementations taken by code developers to accommodate property convergence.
5. The fifth section discusses the turbomachinery models used in the TSCYCO code. Normalized polynomials (supplied by the user) model the compressor and turbine response during simulations. Turbomachinery efficiency and power are discussed here as well.
6. The sixth subsection discusses the solution method implemented in modeling the printed circuit heat exchangers. Work in this section was completed in the past by Langewisch'3. The iteration scheme for the steady state PCHE model is covered.
The semi-implicit scheme to determine the fluid enthalpy distribution is reviewed as well.
7. The seventh subsection integrates all the theory discussed into the TSCYCO code. The subroutines that implement the theory are reviewed. The code layout is briefly covered as well.
By the end of this chapter, the reader should attain an appreciation for the methods used to solve this real fluid cycle.
2.2 Supercritical
CO
2Power
System Simulation Code
Shih-Ping Kao at the Massachusetts Institute of Technology developed the code called "Supercritical CO2 Power System" (SCPS)9. His code was modified and expanded for
this work. Readers interested in learning more about the original version of this particular code can read references9'12
SCPS is a transient simulation control design and cycle scoping code for the simple CO2
Brayton cycle coupled to a light water nuclear reactor. It was developed specifically to determine the dynamic performance and sensitivities and limitations of the simple layout supercritical CO2 (S-CO2) Brayton cycle power conversion systems for the range of 5 to
30 MWe. The code was written in FORTRAN 90, and utilized the object-oriented programming style (OOPS). The OOPS programming style allowed for many advantages, including:
* Use of derived classes, where programming efforts can be reduced
* Modularization of the classes, which allows for more efficient code development while maintaining code structure
* Data transparency, which allows for team code development should the need arise.
* Component testing, which allows for individual testing of modules before the entire system is run.
* Multi-threading and parallel processing becomes available with the OOPS, allowing the code to take advantage of newer CPU technology.
SCPS uses a lumped parameter approach and utilizes the momentum integral model. This means that the fluid is assumed to be incompressible, but thermally expandable in a single control volume. However, the fluid is assumed compressible over the integral control volume. The model is valid for moderate transients e.g. operational transients not associated with significant accumulation of coolant in the compared volumes or rapid transients where pressure wave propagation is important. A single mass flow rate is assumed along the channel flow path so that the energy and momentum conservation equations are decoupled.
Using the above model, the plant components are modeled through direct derivation of the mass and energy conservation equations. Turbomachinery behavior is determined by
user-defined performance maps. Heat exchanger response is determined by a previously developed code that utilizes the Newton-Raphson method for steady state calculations and a semi-implicit method for transient response. Heat transfer correlations and pressure drops take into consideration the fluid type, the flow regime, and current
conditions. Fluid properties are calculated using NIST RefProp 8.0, which utilizes equations of state.
Once plant components were modeled and transient component response determined, the plant system response was calculated. Energy and mass conservations for each
component were represented in a semi-implicit finite-difference manner. The system of equations was then simultaneously solved using Gaussian elimination.
The system operating conditions are defined by the user. Operating conditions were maintained within prescribed tolerance through use of component controllers. As an example, for an arbitrary simulation the compressor inlet temperature was maintained at 32°C. This was performed at quasi-steady state or transient conditions.
Low-temperature control was accomplished by varying the water mass flow rate in the cold-side precooler. Thus, a controller modulated the valve position that increased or decreased the water flow.
As can be seen, the SCPS code fluid and component modeling made its application for the recompression cycle very appealing. The purpose of this chapter is to review the theory used in modeling of the power conversion system of TSCYCO. Additional changes were made to the TSCYCO code, based on the author's judgment that some features in SCPS were unnecessary or inadequate for modeling of physical phenomena:
1. The primary loop model was that for a light water reactor and was fairly detailed. The reactor core power was calculated by a six-group point-kinetics model and a seven-group decay power model. Heat transfer through the fuel was calculated by a lumped fuel/cladding model. Reactor power was controlled by insertion and removal of control rods.
The focus of this thesis is on the secondary loop, thus detailed modeling of the primary loop is unnecessary. In fact, having a detailed primary loop complicates manners, since the current research involves coupling the gas Brayton cycle to any nuclear reactor, not just a light water reactor as in SCPS. Changes made to the primary thermal-hydraulics, as well as controllers is discussed.
2. SCPS uses a simplified model of the turbine for plant transient analysis. The model is similar to that used in RELAP, and the turbine is modeled as a valve, which drops the fluid pressure. This model provides a good rough estimate for the behavior of the turbine. However, the model may not provide the true turbine response during a transient. Axial turbine performance curves are added to TSCYCO for more accurate modeling.
3. The SCPS code models the simple cycle layout for the Brayton cycle. That is, the recompression cycle is not modeled.
These are just some of the observations concerning the SCPS code that were improved or modified. The work is non-trivial, and the new layout of the TSCYCO code with
modifications is reviewed subsequently.
2.3 Modeling Approach
The momentum integral model, as it applies to the SCO2 recompression cycle, is
discussed in this chapter. Assumptions, the solution process, and fundamental equations will be reviewed as well. In-depth examples for the simple and recompression cycle layouts will be provided for clarity.