Distortion of Depth Perception in a Virtual Environment
Application
by
Jonathan D. Pfautz
Submitted to the Department of Electrical Engineering and Computer Science in partial fulfillment of the requirements for the degrees of
Bachelor of Science in Computer Science and Engineering
and Master of Engineering in Electrical Engineering and Computer Science at the
MASSACHUSETTS INSTITUTE OF TECHNOLOGY May 1996
© Jonathan D. Pfautz, MCMXCVI. All rights reserved.
The author hereby grants to MIT permission to reproduce and distribute publicly paper and electronic copies of this thesis document in whole or in part, and to grant others the right to
do so.
Author ... ... ... .... .-.. . ... ...
Deparent of Electrical Eineing and Computer Science
/ May 28th, 1996
Certified by ... ... ... ... ... . .
Nathaniel I. Durlach Senior Research Scientist, MIT Research Laboratory of Electronics Thesis Supervisor
,\
*
(1(1
Accepted by ...
F. R. Morgenthaler
Chairman, DepartntCommittee on
Graduate Theses
OFASSACHUSNLTS 'INS: .E
OF TECHNOLOGY
JUN
1 11996
Distortion of Depth Perception in a Virtual Environment
Application
by
Jonathan D. Pfautz
Submitted to the Department of Electrical Engineering and Computer Science on May 28th, 1996, in partial fulfillment of the requirements for the degree of
Master of Engineering Electrical Engineering and Computer Science
Abstract
Virtual Environment (VE) technology suffers from a variety of hardware and software problems that interfere with the ability to present the experience of being immersed in a
synthetic world. Most notably, the poor quality of the viewing surfaces in head-mounted displays has lead to many complications in the development of VE systems. These visual displays have a low spatial or pixel resolution that creates several side effects. Because the ability to present depth cues is hampered by the low resolution, the presentation of a sufficiently realistic three-dimensional world is very difficult. Depth perception is distorted
by the lack of resolution in two ways. One, the threshold distance at which an object is just
visible is much closer than in the real world. Two, the error and variance in estimating the depth of an object are significantly greater than in the real world. This thesis presents a series of mathematical analyses of these distortions, including a model of perspective geometry and the relevant human psychophysical biases. Algorithms are presented that improve both distorted threshold depth perception and distorted depth estimation. Experiments have been conducted to evaluate the usefulness of the algorithms in terms of both perceptual performance and training performance. The ability of the geometric models to predict human performance in the experiments serves as a measure of the models' effectiveness in devising solutions. The findings suggest that the visible range can be extended using the proposed algorithms without significantly affecting the ability to estimate depth.
Thesis Supervisor: Nathaniel I. Durlach
Acknowledgments
In an effort to streamline my acknowledgments section, I have used the concept of
Von Neumann Utility to determine the subjective value of each person who influenced this
thesis. Von Neumann Utility is used to determine the relative worth of an event or object to a decision maker or system user. For example, if we were attempting to determine the value of a dollar for a particular person, we would present them with a choice between x$ and a 50-50 chance of receiving $1000 or $0, then ask for what value of x would they be indifferent between x and the lottery. By dividing the value x by 1000, we get a value for the utility of one dollar. Usually people are risk-averse and will choose a value of around $350, yielding a normalized value of .35 utiles. By varying the reward in the lottery, a utility curve can be constructed to show the increase or decrease in utility as a function of the size of the objective (Sheridan, 1992b).
The idea of utility can be extended to determine the value of the people who have, in some manner, helped with my thesis. However, given that completing a thesis is essential to completing graduation requirements, merely valuing the assistance I received in terms of money seems meaningless. Thus, to evaluate the relative worth of the help I received, I devised a new scenario. For each individual, I posed the following question:
"Given a choice between a particular person's help on my thesis and a 50-50 chance of losing body part x, which would I choose?"
Then, to determine the value of their help, I found a body part (or parts) that I would be willing to risk. Body part refers to a limb or some other easily defined physical extension of my self including fluids.
The results of this self-inquiry are summarized in Table A. Given the difficulty in assessing a numerical value for the importance of a body part, the construction of a utility curve has been avoided. Future work may include modeling the importance of a body part in terms of degrees of freedom of movement in that limb or simply in terms of mass.
The list of people in the table is ordered roughly in terms of the value of their help, with the exception of Nat Durlach and Dick Pew, who are listed in alphabetical order for obvious political reasons.
Nat Durlach Dick Pew Nora Luongo Lewis Girod
Thomas von Weigand Sam Madden Dorrie Hall Greg O'Connor Walt Aviles Yvette Tenney Bill Levison Wendelin Sachtler Barbara Shinn-Cunningham White (Blue) Kitty
Fran Taylor Evan Wies Melissa Poh Maroula Bratakos David Getty Kathy Youngbear Alexis Black Carolyn Alsterberg Aditya Matoo Michele Bierbaum Jim Bandy Jeanne Krause Johnny Yoon Clara Yang Doug Allen Alex Techet Rakesh Gupta
M.I.T. Women's Water Polo Team
Legs, below mid-shin
Left arm, from above shoulder Kneecap, right
Three fingers (not index), right hand Eyelids
Thumb, left hand
Patch of skin, thigh, 5 cm2 Lesser 4 toes of right foot
Pinkie finger, 1 cm above knuckle Big toe, right foot
One roll of belly flab Canine teeth (4) Lower lip, 0.67 cc All body hair
Bony protrusion on back of my skull Bellybutton
Nipple, left Blood, 1 half-pint Small toe of left foot Skin of chin, 1 cm2 Rear end, 1.5 cc Molars Tip of nose, 1 mm Earlobe, right Eyebrows Eyelashes, upper Fingernails (6) Wisdom teeth Saliva, 15 ml
Knuckle skin, left hand Foot calluses
Toenails
Table A: The utility value of the assistance I received in writing this thesis, broken down by individual. Relative value is given in terms of subject importance of body parts.
Finally, I'd like to acknowledge the United States of America as being a financially swell place to conduct research by extending my humble thanks to those folks at the Department of Defense, the U.S. Navy, the Office of Naval Research, the Naval Air Warfare Center Training Services Division, M.I.T. Research Lab for Electronics, and B.B.N. Corporation all of whom helped to keep me from starving.
Contents
1. Introduction ... 7
2. Background ... 7
2.1 Definition of Terms... ... . 8
2.2 Virtual Environment Equipment ... 13
2.3 Advantages of Virtual Environments ... 16
2.4 Virtual Environments Applications ... 17
2.5 Problems with Virtual Environments ... 18
2.6 Solving Problems with Virtual Environments ... 24
2.6.1 Example Solutions ... 24
2.6.2 Return to the Discussion of Realism ... 27
2.6.3 Task Dependence ... ... 27
2.6.4 Task Analysis ... 29
2.6.5 A Significant Example: The Visibility Problem ... 30
2.6.5.1 Background Geometry ... 31
2.6.5.2 Returning to the Big Picture .. ... ... 51
2.6.5.3 Implications ... 52
3. Experiment ... ... 53
3.1 Experiment Background ... 53
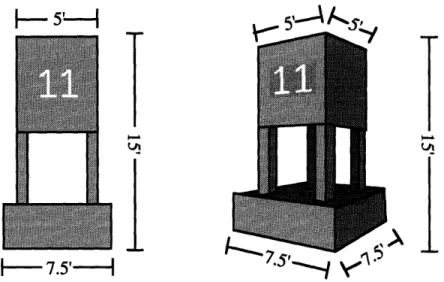
3.1.1 Geometry of the OOD model ... 56
3.1.1.1 Determining Real World Visibility ... 63
3.1.1.2 Assumptions ... 65
3.1.1.3 Previous Work on Visibility in the OOD Simulator ... 66
3.1.2 The Geometry of Optimal Solutions ... ... 70 3.2 M ethod ... ... 79 3.2.1 Subjects ... .. 80 3.2.2 Apparatus ... ... 80 3.2.3 D esign ... 82 3.2.4 Procedure ... 89 3.3 R esults ... 95 3.4 D iscussion... 112 4. Future Work ... 116 5. Conclusion ... ... 117 References ... 119
Appendix A: Hark Grammar...131
1. Introduction
"Virtual Reality" has been a media buzzword for a number of years. A rather distorted perception of what "VR" means has been integrated into popular culture, leading to some fantastical expectations for the application of the actual technology. One group of VR researchers plotted the frequency with which the term "virtual reality" appeared in the press from 1989 through 1993 and found that the usage of those words was growing exponentially (Biocca, Kim, & Levy 1995).
In reality, a large body of knowledge about virtual environment (VE) systems remains to be explored before any realistic simulated "world" can be developed. In particular, a program of rigorous experimentation should be based upon the study of human perception and psychophysics. In this manner, new and unusual phenomenon resulting from the development of VE systems can be understood.
One important component of a successful virtual environment is the perception of depth. Depth perception is needed so that a user may develop a sense of "being there" in a virtual world. Unfortunately, the deficiencies of the displays in VE systems present a number of problems for accurate presentation of depth. Combating the limitations of these displays is a formidable job, especially for situations in which completing a particular task requires a presentation with substantial realism.
2. Background
Virtual environments found their origin in teleoperator systems. Teleoperation refers to the remote manipulation of some device, where the operator must be presented with a sufficiently transparent human-machine interface in order to control the remote device. For an in-depth treatment of the history of VE, see the work of Sheridan (1992b), Kalawksy (1993), or Rheingold (1991).
Virtual environments is a very young field of study yet has received a large amount of attention from a variety of disciplines, including computer science, psychology, cognitive science, visual art, and industrial engineering. All of these disciplines seek to improve upon the human-centered paradigm exemplified by VE systems. However, the implementation of VE systems is a nontrivial task because of the technological limitations of the hardware. Before discussing these limitations and how best to approach them, a number of definitions should be provided.
2.1 Definition of Terms
Virtual Environment: We avoid the use of the term "virtual reality" both throughout this
paper and throughout the research conducted at the Massachusetts Institute of Technology. Not only is the term "virtual reality" a product of the fertile imaginations of the popular media, it is linguistically self-contradictory and raises expectations of the capabilities of modem-day equipment. Perhaps the best definition of virtual environment is given by Stephen Ellis, one of the pioneers of the discipline:
"A virtual environment is that synthetic, interactive, illusory environment perceived when a user wears or inhabits appropriate apparatus providing a coordinated presentation of sensory information mimicking that of a physical environment" (1995a).
We can be more precise by giving meaning to a "virtual environment system." A VE system is multi-modal, interactive and adaptive, reconfigurable in software, and can generate supernormal situations. This system consists of the human, the human-machine interface and the computer-generated synthetic environment.
A virtual environment system consists of a visual display system, head tracker, and auditory displays (VETREC, 1992). Oftentimes, a glove-input device is included in the system, but such devices are no longer very popular due to a number of technical difficulties. Additional components of a VE system may include head-mounted displays (HMDs), automatic speech recognition, haptic input interfaces, force-feedback devices,
whole body movement sensing, and/or sensing of physiological responses, such as eye movement, blood pressure or heart rate (VETREC, 1992). The equipment and its properties will be discussed in further detail below.
In the broad sense, a virtual environment system is any system that attempts to fool people into accepting a computer-generated, synthesized world as real. The most important traits of a convincing VE are interactivity and adaptability. The ability to persuade a user that the VE is the real world leads us to define the concepts of immersion and presence.
Immersion and Presence: The definition of a virtual environment given above can be
extended to describe the subjective sensation a user might feel:
"Sensory information generated only by and within a computer and associated display technology compels a feeling of being present in an environment other than the one a person is actually in" (Sheridan, 1992a).
Not only is a virtual environment supposed to fool the observer into perceiving different surroundings, but it is also supposed to imbue the user with the experience of "being there." This sense of "being there" is termed immersion or presence.
Without the feeling of immersion or presence, VE research would not have generated much excitement. The ability to provide a sense of immersion is very desirable in entertainment applications as well as in teleoperation or training where the tasks to be performed are wide-ranging, complex and uncertain (Held & Durlach, 1992). The desire for more immersive virtual environments motivates much of the research in the area. Scientists are trying to qualify and quantify what creates the experience of presence, how to measure it, how to improve it, and what effect it has on various VE tasks (Slater & Usoh,
1993).
Simulator: A knowledgeable reader might have noted that a number of the qualities
associated with virtual environments have been present for many years in what are called
them from simulators. For example, a VE is more flexible than the typical simulator; a VE is reconfigurable for different levels of fidelity and/or various skill levels as well as for the characteristics of a particular task (VETREC, 1992). In addition, a simulator is generally trying to match the real world (the degree of which is measured as "simulator fidelity") while a VE need not present an exact copy of a real world environment. A simulator is closely tied to some physical situation, while a VE is most closely associated with the human user (Carr, 1995). This is encouraging; VE systems have much wider applicability than ordinary simulators since they focus on providing immersion, rather than merely a replica of the real world. Negroponte prognosticated in 1970 that human factors would eventually take a strong part in computer system and computer interface design. VE systems differ from the simulators that existed at that time because they embrace a human-centric view, encouraging designers to look to the human being to justify design decisions.
Kriloff, in 1976, presented another view, suggesting that the human should conform to the machine since machine programming is fixed and man is adaptable, with the caveat that unpleasant side effects might occur. The study of human factors engineering, which originated in the late 1940s, is concerned with how to design man-machine systems to reduce side effects and make them easy to use, safe, and efficient. The view that a VE adheres more to the human end of man-machine interaction accurately represents the relatively recent shift to more human-centric systems. Simulators are being replaced by VEs in situations where the human and their sensations are of the primary concern. Simulators act to produce a situation to which the human must adapt, rather than adapting the situation to human sensory capabilities. Both simulators and VEs share the common theme of presenting a synthetic task to the user; therefore, the concept of a task should be better defined.
Task: Human factors engineers recognized very early in the growth of their discipline that
involved in man-machine interaction. Thus, the formal concept of a task was born. A task is an arbitrary unit of work, one or more specific related actions necessary to change or verify a system's state. A task may be mental, physical or a combination of these (Van Cott & Paramore, 1985). A task has a number of characteristics, including a set of conditions that require and initiate human performance, a specific purpose, a definite start and end defined by an initiating and terminating cue or stimulus, a relatively short life span, the ability to be interrupted by another task, and the ability to be performed by many people at once (Christensen, 1993). For the purpose of VE research, these definitions are more than sufficient.
Realism: When we mention the idea of a task, we are implying the existence of a
real-world context for that task. In a simulator, we are trying to make the synthetic task as much like the real world task as possible. Furthermore, we could say that "realism" is the degree to which the sensory stimulation coming from the artificial environment matches that originating from an equivalent real environment (Christou & Parker, 1995). A serious issue of perception arises immediately: what is veridical and what is perceived? The common assumption is to believe that "what I see is real," a perspective philosophers call naive representationalism or naive realism (Weintraub, 1993). Research shows that the veridical world is not the same as the perceived world, yet in VE work, the main thrust is to utilize and exploit the inherent desire for naive realism to produce the experience of presence. We exploit this desire by studying the aspects of the human visual system that contribute to the perception of a world as real and using the results to synthesize a real situation. However, in VE systems, supernormal situations are possible, making comparison to the real world difficult, if not impossible. Therefore, realism is only really relevant to the discussion of VEs when the VE is attempting to simulate traits of the real world.
Could a virtual environment simulate a world that has no functional or logical connection to the real world? This is a difficult idea to grasp and seems far-fetched, yet the capability may exist. However, a human would be unlikely to understand such a world and would be experience little or no immersion. Thus, a VE must embrace reality in some manner in order to present a sensical and usable environment. Characterizing the ways in which a VE should mimic the real world is an important part of creating an interactive and immersive environment.
Helmholtz, in 1882, proposed the Doctrine of Unconscious Inference, which states that people apply what they know about the world to achieve the percept, and that information from the world is oftentimes insufficient (Weintraub, 1993). His century-old doctrine suggests the basis for studying realism in VEs: the manner in which the world is perceived as real is based upon previously gathered information about the world. Realism, then, could be achieved through the study of the preconceptions that lead to perception of the world as real.
Realism in virtual environments has a connection to the feeling of immersion. Hendrix and Barfield report that, according to a subjective questionnaire, people react more to the realism of the interaction in a VE than to the realism of the objects in that VE (Hendrix & Barfield, 1995). The functional behavior of objects in a VE determines its subjective realism, while the actual appearance of the objects is less relevant. However, what determines functional behavior is not clear. This terminology should include perceptual functionality, such as how objects behave when a subject's head turns, or how objects move within the scene. Clearly, the exactitude of the human-machine interface is not the only determinant of immersiveness and/or realism. The significance of the behavior of the objects within the simulated environment should not be overlooked.
The computer graphics world has, for much of its short life, been pushing technology ever further in the pursuit of photorealistic images. New, higher-resolution displays and more powerful computational engines have been developed to aid the realism
of the images on a computer screen. The computer graphics field is finally acknowledging that the behavior of the objects in the scene is likely to be more important to realism than the quality of the image. A shift in focus is reflected by increased research into physically-based modeling and animation.
The young discipline of virtual environments is only beginning to absorb the large body of knowledge from psychophysics and perception that offers clues to the concept of realism. The perceived appearance and behavior of objects is being carefully quantified relative to some of the peculiar equipment used in VE systems. Therefore, a brief survey of standard VE equipment and its characteristics is warranted.
2.2 Virtual Environment Equipment
The study of Virtual Environments began with Ivan Sutherland's famous discussion of "The Ultimate Display" (Sutherland, 1965). Sutherland describes the ultimate display as one that is indistinguishable, to the user, from the real world. To this end, he constructed a head-mounted display (Sutherland, 1968). After Sutherland's landmark HMD in 1968, a number of other devices were built to display vision, sound, touch, and smell (Kalawsky, 1993). For the purposes of this thesis, only visual displays will be discussed. Readers are encouraged to read Deering (1993), Kalawsky (1993), Durlach and Mavor (1995), or Ellis (1995a) for more information about other displays.
The visual display gives the subject the most salient and detailed information about the synthetic world. A real-time display showing precise, continuous motion imagery, while maximizing normal visual sensory abilities is ideal. A visual display system incorporates the actual display surface, a system for monitoring the location and motion of the head and/or eyes, a system for generating the stimulus, and a positioning system for the displays (VETREC, 1992).
The type of visual display most commonly used in virtual environment work is a head-mounted display. An HMD is a helmet that sits on the user's head and presents an
image very close to the eyes. Usually, the helmet contains a tracking device which permits the graphics hardware to update the image to match the motion of the participant's head, allowing them to "look around" a scene. Often, to allow the presentation of stereoscopic images, an HMD will have a separate display for each eye.
A number of variations on the generic HMD have been developed. See-through displays using half-silvered mirrors have been developed to allow the superposition of virtual images with the real world (Kalawsky, 1993; Barfield, Rosenberg, & Lotens, 1995). Some HMDs use spinning color filters to present a color image from a grayscale display (Allen, 1993). Eye tracking has been introduced into a few HMDs so as to follow the user's gaze with high-resolution inserts (Kalawsky, 1993). New optical systems are always being developed that have wider field of views (FOVs) and better adaptability to the vision of different users. Significant effort is being devoted to designing and prototyping new HMDs by laboratories at the University of North Carolina and the University of Washington, while the commercial world continues to produce a variety of styles of HMDs (Barfield and Furness, 1995).
Despite the focus on the ubiquitous HMD, a number of other types of displays are worth mentioning since they lend insight into a few of the limitations of HMDs. The CrystalEyes field-sequential system uses glasses with liquid crystal shutters that are synched with a monitor to time-multiplex images to the eyes (Lipton, 1991). A high-resolution, narrow FOV, three-dimensional image can be presented with this system. The CAVE at the University of Illinois is a system designed to surround the user in a cube with back-projected images on the walls. These images are also presented in a time-multiplexed manner with shutter glasses so that a user perceives a large FOV, three-dimensional image. The shape of the CAVE presents some limitations; the projected images are lower resolution than those seen on a normal computer monitor, and a great deal of computation is required to present images that update at a sufficiently fast rate (Cruz-Neira, Sandin, & DeFanti, 1993). At the time of this writing, a number of other interesting alternatives to the
HMD are being developed. However, to present them all would be laborious. The reader is invited to consult Kalawsky (1993) and the journal Presence: Teleoperators and Virtual Environment for more information.
Head-mounted displays have a number of characteristics which determine their weight, comfort, durability, size, and price. Generally, HMDs weigh from 1 to 10 pounds and permit for a number of different adjustments to ensure a secure fit. Some HMDs allow inter-pupillary distance (IPD) and eye relief (the distance from the surface of the eye to surface of the display) adjustments to suit the individual. FOV ranges from 20* to 140"
horizontally and 23* to 90" vertically, and most HMDs are capable of displaying around 50"
horizontal by 40" vertical. Displays are usually active liquid-crystal displays (LCD), although electroluminescent, light-emitting diode, plasma, and cathode-ray tube (CRT) based displays have been successfully constructed. The pixel resolution of these displays hovers around 600 pixels by 400 pixels, although examples of both higher and lower resolution systems have been produced. The design of HMDs is a fairly complex and interesting field; the curious reader is referred to the work of Barfield, Hendrix, Bjorneseth, Kaczmarek, and Lotens (1995) for an introduction.
Ultimately, virtual environment designers would like a visual display system that has a high spatial resolution, high luminance and contrast, and high-fidelity color. The system should incorporate a wide FOV with a rapid stimulus generation and update rate. The system should also include a quality stereoscopic configuration, provide minimal interference with the user's motion and overall comfort, and eliminate noise and distortion. Safety is an important issue, as are reliability and durability (VETREC, 1992). Unfortunately, these characteristics are far from being achieved. Ideally, an HMD would weigh as little as a pair of glasses, fill the visual field, match the resolving power of the eye, and properly coordinate all visuo-spatial cues (Biocca & Delaney, 1995). However, the possibilities for VE technology are still substantial even if these constraints are only partially satisfied.
2.3 Advantages of Virtual Environments
Virtual environment technology has generated enthusiasm for several reasons. Obviously, tasks that require immersive visualization and understanding of complex, three-dimensional environments are perfectly suited to implementation in a VE (Travis, Watson, & Atyeo, 1994). VEs can enable multiple, simultaneous, coordinated, real-time foci of control in an environment, allowing simulation of tasks that involve the manipulation of objects in complex situation (Ellis, 1995b). In addition, VE technology provides for applications which require multiple viewpoints of a three-dimensional environment.
Another strength of virtual environment systems is that they are more cost-effective than traditional simulators. Because of a VE's reconfigurability in software, changing a simulator from, for example, an F-14 fighter to a Cessna 150, costs only the price of a programmer, not the price of a whole new cockpit mock-up. In this example, the VE is more cost effective by at least two orders of magnitude (a new simulator might cost millions of dollars, while reprogramming a VE may only cost tens of thousands of dollars). A VE could also be modified for each user based upon a variety of constraints from the user's visual acuity to his or her spatial reasoning abilities. The reconfigurability of VEs allow them to be supremely adaptable, requiring only standard equipment to provide a variety of services (VETREC, 1992).
In addition, virtual environment systems are networkable. Multiple users can be supported in a single environment, permitting cooperation and human-human interaction. Networking together VEs also allows for the geographical distribution of users and permits dispersed resources to be shared among users. Thus, VEs are well-matched to teleoperation tasks. Areas of applications for teleoperation include the exploration of space, undersea oil and science (geology, biology), nuclear power plants, toxic waste cleanup, construction, agriculture, mining, warehousing, mail delivery, firefighting, policing, military operations, telesurgery, and entertainment (Sheridan, 1992b). The ability to network VE systems allows for the possibility of achieving these applications.
Finally, VEs have the ability to present supernormal situations. The user can be given additional information in a synthetic world, gaining perspectives and opportunities for communication not possible in the real world. The potential for augmenting normal perception is staggering; adding information to a person's sense of the real world has hundreds of applications.
2A Virtual Environments Applications
In general, human factors engineering attempts to achieve maximum efficiency, productivity, dependability, reliability, safety, habitability, operator acceptance, while minimizing training and man-power costs, and maintaining a high degree of flexibility in the design and use of the man-machine interface (Pew, 1993). Virtual environments represent a significant step towards achieving these goals.
Before the lovefest with VEs goes too far, it must be noted that VEs are well-suited
to a particular set of tasks. Tasks that require a tracked and transitional viewpoint, 3D
spatial reasoning and visualization, and complex interactions with the environment utilize the advantages of VE technology (Stanney, 1995). Suggested applications include teleoperation (Sheridan, 1992b), entertainment, training (Ellis, 1995a; VETREC, 1992), education (Travis, Watson, & Atyeo, 1994), architecture (Slater & Usoh, 1993; Henry & Furness, 1993), scientific and medical visualization (Ellis, 1995b; Kalawsky, 1993), design, manufacturing and marketing, and telecommunication (Durlach & Mavor, 1995).
However, for each potential application, a careful analysis of both the task and the users is needed; failure to recognize the misapplication of VE technology can have disastrous effects. Some have suggested the formation of a virtual task taxonomy to direct design efforts for maximizing human performance in VEs. Classifying tasks according to types of displays and interactions which best improve efficiency in VEs would be extraordinarily helpful in determining for which tasks VE technology might be effective
(Stanney, 1995). However, the development of such a taxonomy is a formidable job, since the size and complexity of the application-space are imposing.
2.5 Problems with Virtual Environments
Why is task analysis so important? Because the high expectations for virtual
environment systems have not been met by the advances facilitating new and novel hardware and software. The fundamental ideas underlying VE systems have been validated; however, the technologies needed to produce a sufficiently immersive virtual world for a large range of applications are not available. Again, we focus on the elements of the visual display system and their limitations rather than delving into the idiosyncrasies of other perceptual channels. Because HMDs are the current standard in VE systems, the problems with these devices are of the most interest.
Difficulties with Head-Mounted Displays
Many different display types have been introduced for use in virtual environment systems. Head-mounted displays are the most commonly used, and have become the de facto standard in the field despite their many drawbacks. One of the most redeeming characteristics of an HMD is that they provide a wider field of view (FOV) than typical computer displays. However, human vision has a FOV of about 200" horizontally and about 60* vertically, while most HMDs have a FOV less than 50" in either dimension (Ma, Hollerbach, & Hunter 1993; Barfield et al., 1995).
The vertical and horizontal field of views in an HMD are rarely equal since few displays are made with equal resolution along each axis. FOV is believed to have a strong effect on the feeling of presence (Robinett & Rolland, 1992). The wider an image appears, the more like the real world it seems. Studies have shown that a wider FOV improves performance on some tasks (Ellis, 1995a).
In order to achieve a wide FOV, the pixel resolution of the display is compromised. For example, normal computer monitors have a resolution of 1028 pixels by 1240 pixels and a diagonal measure of about 17 inches. When viewed from a normal sitting distance of 15 inches, the individual pixels are not detectable, and the FOV is about 20* horizontal. Viewed from a distance of 2 inches, the individual pixels are clearly discernible, and the FOV is about 100" horizontal. HMDs are analogous to the latter case, where displays with resolutions roughly 600 pixels by 400 pixels are placed about an inch from the surface of the eye.
Because of the placement of the display, an HMD has low pixel resolution. Text is difficult to present, and depth perception is seriously distorted. Users of typical HMDs qualify as legally blind (i.e. have 20/200 vision or worse) (Ellis, 1995a). In the domain of aviation, displays that had low resolution were shown to increase the root-mean-square deviation from an optimal descent path (Fadden, Browne, & Widemann, 1991). The pixel resolution of the display is important for a variety of applications.
The ability of a human eye to discriminate objects is called visual acuity. Acuity is determined by the physiology of the retina, which has varied density and accuracy of receptors. The eye has a main focus region, called the fovea, which has a resolution of about 30 seconds of arc (Buser & Imbert, 1991; Boff & Lincoln, 1988; Goldstein, 1989). HMDs are far from presenting images that are equivalent to this level of acuity.
As the eye moves, the high-acuity foveal region points to different regions of an image. Therefore, to present an image of sufficiently high resolution, the display must match foveal acuity. Most displays available today have inadequate resolution. In addition, eye movement may cause vignetting, which is the partial to total loss of light from the image. Vignetting occurs when the eye pupil is not at the intended exit pupil of the optic system of the HMD (Ma, Hollerbach, & Hunter, 1993). This problem can be partially repaired with an increased exit pupil.
A number of display systems have troublesome interfaces with the computational engines which produce the images. Often, the frame buffer of the graphics computer does not map precisely to the surface of the display; usually some image clipping occurs. Thus, the FOV of the display may differ from the published characteristics of an HMD. Erroneous computation of the perspective geometry can result unless the behavior of the computer-to-display interface is properly represented. In one system, neglecting the clipping of the frame buffer resulted in an error of 5* in the presented FOV, causing objects to look bigger and closer than intended (Rolland, Gibson, & Ariely, 1995). Clearly, the behavior of the interface between the graphics engine and the actual display should be well understood by the designer of a visual display system.
Furthermore, a designer should try to build a head-mounted display that has a large eye relief. A large eye relief would accommodate the 30-50% of the population aged 20-45 that use spectacles, more than half of which wear them when using optical devices (Ma, Hollerbach, and Hunter, 1993). However, increasing the distance between the eye and the display reduces the FOV. Many HMDs do not even allow any sort of eye relief adjustment to accommodate wearers of eyeglasses.
User variance, as illustrated by the issue of users with corrected vision, is one of the critical elements of display system design. A VE display system should be flexible enough to handle the variation between users yet robust enough to present the same image to each person. One of the major factors that differs from user to user is the interpupillary distance. IPD varies from about 53 mm to 73 mm between users, averaging out around 63 mm (The author's IPD measures 61 mm, 29 mm to the left, 32 mm to the right!). This discrepancy places the following constraint on the design: either the optics have to provide a wide enough exit pupil to accommodate both wide and narrow-eyed viewers, or a mechanical adjustment, like on binoculars, should be incorporated into the optical system (Robinett & Rolland, 1992).
User variance includes more than just physiological differences; psychological issues are also important. For example, familiarity with a particular display system has been shown to significantly affect some tasks performed in a VE (Stanney, 1995). For example, novice users of HMD systems often fail to take advantage of the multiple viewpoints presented or, even more critically, of the adjustments possible on the HMD itself.
Another problem with head-mounted displays stems from limitations of the display technology. Generally, the displays in HMDs lack luminance and contrast. In the real world, intensity in a particular scene might range from 1 to 1000 (i.e., a sunbeam in a dark room), while a typical CRT has an intensity range from only 1 to 100, and an LCD has even less. Contrast also aids visual acuity; as a display gets dimmer, acuity performance decreases (Christou & Parker, 1995). The relationship between contrast and visual acuity is given by the Contrast Sensitivity Function (CSF). The CSF relates the decrease in contrast to a decrease in visual acuity (Weintraub, 1993; Goldstein, 1989). Because HMDs are unable to produce realistic contrast and luminance values, visual acuity suffers.
The color capability of the display technology used in most head-mounted displays is also inadequate. The color range that can be presented simply does not match the colors that are perceivable and discriminable by the human eye. And, for each color, the brightness control produces less brightness levels than can be normally differentiated (Christou & Parker, 1995; Barfield et al., 1995). So, the use of color displays adds an additional layer of complexity to the limits of HMDs.
The optics that rest between the user and the display surface also contribute to the difficulty of designing an HMDs. Since most HMD optics are magnifiers to widen the FOV, a convex spherical distortion is introduced. Most code for presenting images on these displays fails to take into account this distortion. The optics, besides increasing the FOV, provide the user with an image that they can focus on, despite the fact that the display surface may be very close to the eye (Robinett & Rolland, 1992; Hodges & Davis, 1993).
The optics end up curving normally linear surfaces, and introduce a number of other aberrations. The main aberrations in HMD optics can be described as (in layman's terms) blurring, curvature, distortion, and color (Ma, Hollerbach, & Hunter, 1995). Humans have some ability to adapt to aberrations, and much work in optometry has been devoted to quantifying human tolerances to these distortions.
The optical system in an HMD presents another problem since its idiosynchracies are usually not modeled in the code used to display the image. Generally, graphics systems model the eye as a single point which is the center of the perspective projection. The pupil is not well-represented as a single point, nor do most displays account for the movement of the eye (Rolland, Gibson, & Ariely, 1995). Furthermore, the displacement of the "virtual eye" in some models results in significant spatial errors as well as a decrease in the speed of task completion (Rolland, Biocca, Barlow, & Kancheria, 1995). Furthermore, most HMD optical systems have large exit pupils which are also not accurately represented as a point. Clearly, the model of the geometry in the computation of the image should match the characteristics of both the optics in the display and the optics of the human eye.
Furthermore, human perceptual distortions can further complicate the precise modeling of the visual display. A distortion-free display and a precise formulation of the geometry will still result in some inaccurate perceptions. This is due, in part, to the psychology of self-location which states that accurate visual perception of an object requires a combination of perceived distance, perceived direction, and perceived location of the viewpoint (Pstoka, Lewis, & King, 1996). Because the visual system is an information-loss system, a number of filters from the physiological to psychological level act to extract relevant information from the stream of data being received from the real world (Weintraub, 1993). The physiological characteristics of these filters have been discussed, but human psychological biases are not well-modeled in most VE visual display systems.
Stereoscopic Image Presentation
Further complications arise if a stereo image pair is displayed. The role of stereoscopic vision in depth perception is often not important enough to warrant the use of stereovision in HMDs. In addition, a significant percentage of the population is stereoblind; a survey of 150 students at M.I.T. showed that 4% could not use stereopsis and that 10% had great difficulty in perceiving depth in a random dot stereogram. Somewhere between 1 in 10 and 1 in 100 people are stereoblind (Yeh, 1993). Other details and difficulties in presenting stereoscopic images are treated by Edgar and Bex (1995), Hodges and Davis (1993), Lipton (1991), Robinett and Rolland (1992), and Wann, Rushton, and Mon-Williams.
Simulator Sickness
The inadequate presentation of images to the user of a virtual environment has several implications. The phenomenon known as "simulator sickness" is one of the most distressing results of using insufficient realism in the visual display system. Simulator sickness refers to the malady experienced by some users during prolonged immersion in a sub-optimal virtual environment. Lag in head-tracking, misaccommodation, and HMD weight contribute to the feeling of nausea that may be experienced in a VE system. Simulator sickness has become such an area of concern that a system for rating the magnitude of simulator sickness has been proposed (Kennedy, Lane, Lilienthal, Berbaum, & Hettinger, 1992). In the domain of aviation, illness and nausea has been well-documented for years. Aircraft simulators have been built that are capable of reproducing some of the same symptoms as real airplanes (Leibowitz, 1988). Simulator sickness and traditional motion sickness differ in that simulator sickness has more oculomotor-related symptoms and less actual vomiting (Kennedy et al., 1992). The interested reader is referred to the special issue of Presence: Teleoperators and Virtual Environments, volume 1, issue 3, for more details.
2.6 Solving Problems with Virtual Environments
Because of the potential payoffs of highly immersive applications, many researchers are working hard to overcome the limitations of virtual environments. A number of solutions will be examined to provide insight into solving problems with VEs, and a rough philosophy will be presented. Finally, a previously unsolved problem is presented as a significant example of the complexity and intricacy of VE system design.
2.6.1 Example Solutions
Because related work in other fields has already been done, a number of problems with VEs have been successfully addressed by researchers. For example, motion sickness issues have been dealt with by groups working in aviation and teleoperation (Sheridan, 1992b). Of course, simulator sickness is a much larger issue in simulations where head motion is tracked. Since most VEs consider head-tracking to be integral to both interactivity and the experience of immersion, resolving the problem of simulator sickness is important.
Field of view of the display is another important design parameter for developing immersive simulations. Spatial resolution is generally compromised to provide a wider FOV; a narrow FOV with high resolution gives an unrealistic sense of tunnel-vision. Conversely, a low-resolution, wide-FOV gives a more primitive, yet more realistic image. Due to this trade-off, HMDs are simply inappropriate for certain tasks. One hardware solution follows the eye with a high-resolution patch of about 30* (VETREC, 1992; Travis, Watson, & Atyeo, 1994; Ellis, 1995a; Yoshidea, Rolland, & Reif, 1995).
The exponential growth of technology should not be ruled out as a solution to the problems with VE systems. Active matrix LCD displays have already surpassed good quality CRTs and are far ahead in size, weight, power consumption and operation voltage (Ma, Hollerbach, & Hunter, 1993). A recent development in LCD technology allows the placement of a 640 pixel by 480 pixel display on a single chip with pixel size measuring
only 30 microns by 30 microns. Not only is this chip small, but it also has low power consumption and a low production cost (MicroDisplay, 1996).
Another example of potential of technology is the CAE Fiber Optic HMD (FOHMD), considered to be one of the best visual displays currently available. The CAE FOHMD uses two 83.50 monocular FOVs with an adjustable binocular overlap up to 380. It provides a horizontal FOV of 1620. The visual resolution is 5 minutes of visual arc, with a high-resolution insert (240 x 180) with 1.5 arcminute resolution. In addition, the displays are bright, at 30 foot-Lamberts. The head tracker's performance is boosted by additional accelerometers to do predictive tracking, yielding an update rate of about 100 Hz (Ellis, 1995b; Kalawsky, 1993). Of course, the FOHMD is a fairly heavy piece of equipment and is prohibitively expensive.
Another interesting display is the Sparcchair, developed at Sun Microsystems. The Sparcchair trades off high resolution for a low FOV; it has a resolution of 1120 pixels by 900 pixels with a 200 by 250 FOV. The Sparcchair was developed for a specific task requiring high resolution, and thus its configuration seems reasonable (Reichlen, 1993). Yet, even with the arrival of new technologies and designs, some tradeoffs simply cannot be avoided.
The design of the optic system in an HMD also suffers from several unavoidable tradeoffs. The problem with the optics in HMDs has been given a fairly comprehensive treatment by Robinett and Rolland (1992). They attempt to quantify the problems associated with optical distortion and IPD variation by computing an extensive model of the image based upon the layout of the optics in an HMD. A comprehensive simulation should provide a consistent image by accounting for the properties of the HMD's geometry, including the relative positions of the display screens, optics, and eyes (Robinett & Rolland, 1992).
Once a computational model of the HMD geometry has been included in the code, IPD variation can be accounted for by using it as a parameter in the calculation and
presentation of the graphics. Measuring a user's IPD is a fairly trivial task and having adjustments on the HMD for IPD has become commonplace (Robinett & Holloway, 1995; Ma, Hollerbach, & Hunter, 1993). Further calculations have revealed ways to account for all the various transforms in the optics system (including some tracker transforms), as well as off-center perspective projection (Robinett & Holloway, 1995). Hodges and Davis have also contributed a description of the perspective geometry of a display system (1993). Their work, which describes the effects of pixels on stereo depth perception, has resulted in other solutions to display difficulties. Through extensive modeling and calculation, solutions to the optical distortions in HMDs can be resolved.
Watson and Hodges (1995), using Robinett and Rolland's model of the optics' geometry (1992), implemented pre-distortions in software to correct for optical distortion. Their work is particularly interesting because it represents a software solution to a hardware limitation - a methodology discussed in more detail below.
Inter-pupillary distance should not be the only parameter used to characterize user variance. A number of additional tests should be performed to assess other individual differences. Lampton, Knerr, Goldberg, Bliss, Moshell, and Blatt (1994) suggest a battery of tests to determine a subject's visual acuity, color and object recognition, size estimation, distance estimation, search and a number of other visual skills used in locomotion, object manipulation and target tracking. Such a battery seems more appropriate for rigorous experimentation in VE systems than for off-the-shelf VE systems. A good system should be able to accommodate population variance without seriously compromising performance. Thus, the job of VE designers is a difficult one; they must devise solutions that work around the limitations of the equipment and yet are capable of presenting a realistic environment.
2.6.2 Return to the Discussion of Realism
Given a sense of the limitations of the equipment, returning to the concept of realism is necessary. The goal of achieving realism is obstructed by the hardware and software limitations of the VE system. Sheridan (1991) discusses several factors that contribute to the sense of presence and realism in a VE. He claims that the extent of the sensory information, the spatial control of environmental sensors, and the ability to modify the environment all contribute to the experience of presence. Most sources agree that the sensations of presence and immersion are functions of wide FOV, high resolution, effective head-tracking, spatialized sound, and sufficiently rapid frame rate (Hendrix & Barfield, 1995). However, despite this intuition, no clear and logical method has emerged to link the physical characteristics of the VE system with the subjective sense of presence.
Thus, the level of realism is reduced by the low quality of the virtual world. Photorealism suffers from the low resolution of the display and the computational limitations of the graphics engine. Functional and logical realism suffer for the same reasons, as well as the others mentioned above. Clearly, the application of VE systems to simulating a real world task is warranted only if a suitable level of realism can be obtained.
2.6.3 Task Dependence
Obviously, certain issues will be more important in one application than in another. For instance, an assembly task performed in a VE might require a high fidelity haptic interface and a mediocre level of visual spatial resolution, whereas a car driving simulator may demand a higher level of visual resolution and only a relatively simple haptic interface. This kind of reasoning seems pedantic, yet a careful analysis of task requirements is necessary to determine which problems are most significant for a given VE application. As put forth in (VETREC, 1992):
"In designing a visual display system for virtual environments, it is important to remember the specific task to be undertaken and, in particular, the visual requirements inherent in these tasks. None of the available technologies is capable
of providing the operator with imagery that is in all important respects indistinguishable from a direct view of a complex, real-world scene. In other words, significant compromises must be made."
Miller (1976) takes the idea of task dependence much further. He states that simply cataloging the characteristics of the human and the computer is not the best approach to interface system design. Rather, the proper method is to examine what benefits the user. However, he argues that human psychophysics provides too artificial of a base for interface engineering since the tasks presented in psychophysical experimentation are often too divergent from actual human tasks. Thus, Miller argues for studying tasks in context, rather than in reductionist human perceptual experiments, and for matching attributes of the computer system to the human task.
Virtual environment systems should provide the sensory cues that are necessary for a particular task. A fully real physical world is too complex to simulate, so providing task-specific information in the best way possible is the only feasible solution (Zeltzer, 1991). Thus, some applications might benefit from a VE-type display, but the demands of many other tasks may be best met by more traditional (and cheaper) display types (Ellis, 1995b; Stanney, 1995).
For example, Smets and Overbeeke (1995) argue that spatial resolution is not important for some tasks, implying that low resolution HMDs may be tolerable in some situations. How much resolution is necessary is a obviously a function of the type of task (Travis, Watson, & Atyeo, 1994). In summary, one might ask:
"For a defined task domain, how should one compromise between spatial resolution and field of view? Is color worth the added expense and loss of spatial resolution? Is a stereoscopic display worth the trouble? If so what are the appropriate parameters... for various types of tasks?" (VETREC, 1992).
Sheridan (1991) proposes two major properties that affect task performance: the difficulty of the task and the number of degrees of freedom in the task. These factors are fairly general, but help to clarify the kinds of tasks that might be performed effectively in a
2.6.4 Task Analysis
A task analysis permits the designer to better understand both the task and its potential for implementation in a virtual environment. Formal task analysis is a large field. Theories have been proposed for analyzing tasks and the implications for training (Gopher, Weil, & Siegel, 1986; Frederiksen & White, 1989; Christensen, 1993).
Basically, a task analysis is the breakup of a task into behavioral components that can be further analyzed (VETREC, 1992). However, visual tasks are fairly complex. Researchers know the type of visual stimulation a user finds informative for particular tasks, but they have trouble linking the type of stimulus with the task type. For example, stereovision and motion parallax provide useful information about the relative distances of objects from the observer (Christou & Parker, 1995), but this result is hard to translate to a particular type of task.
Since we can derive the information to which the visual system is sensitive, the in-context (ecological) significance of this information, and the limitations on the use of the information in the visual system, we can design a VE to stimulate the visual system in a realistic manner. However, the limits of the human visual system be accommodated first, before other contributions to realism can be analyzed (Christou & Parker, 1995).
Realism in a VE can be improved by recognition of the redundancy in the human visual system. Tasks that provide a great deal of redundancy (i.e. multiple cues to the same piece of information) are well-suited to VE systems. Repeated information in the visual system reduces ambiguities, and improves the signal-to-noise ratio (England, 1995).
Further analysis reveals that spatial visualization, orientation, spatial memory, and spatial scanning skills are helpful in predicting the performance of a human-machine interface (Stanney, 1995). A task can be analyzed in terms of these component skills to determine its suitability for a given interface.
2.6.5
A Significant Example: The Visibility Problem
To further understand the constraints on realism imposed by the equipment used in virtual environment systems we look at a concrete example. A significant problem
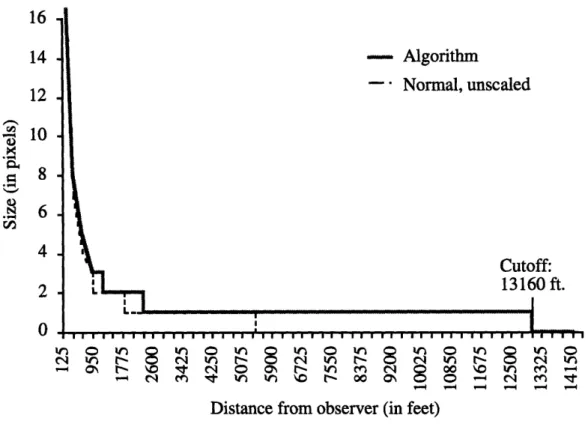
associated with the lack of spatial resolution in typical HMDs is the difficulty with detecting objects that are far away. The low resolution of the display causes the size of an object to change discretely rather than continuously as it moves from one range of depth to another. That is, an object displayed over some depth range will not appear to change in size until a pixel boundary is reached. Then, it will change its size by one pixel and remain that size until another depth range boundary is reached.
1II IL
-10
- 8-
6-from observer (in feet)
-Hq NtH t eN ci
Figure 2.1: Assuming a square, 15 foot by 15 foot object and a display that is 600 pixels by 400 pixels, this plot shows the concept of pixellation of depth. The sample object remains the same size despite being at significantly different depths. For example, the object remains 2 pixels by 2 pixels from about 4000 feet to 7000 feet, a range which is much different from discriminability in the real world.
Pixellation of depth causes two major problems. One, the ability to judge depth is severely impaired; two, the range in which objects are visible is greatly reduced. Depth estimation is impaired and can be further exacerbated by improperly applied anti-aliasing techniques (Christou & Parker, 1995). Actual human depth judgment has an acuity of about 5 minutes of visual arc near the fovea, although lower values have been reported for special cases (Yeh, 1993).
Figure 2.1 shows the threshold problem caused by low resolution displays. As distance is increased, the jump from one pixel to no pixels occurs well before the human visual system would reach the its threshold of detectability. The display assumed here is unable to match human abilities. This inadequacy lies at the heart of the problem with visibility in HMDs, and has received some acknowledgment in the literature (Christou & Parker, 1995; Pioch, 1995), but no reasonable solutions have been presented.
2.6.5.1 Background Geometry
The problems with depth perception at the threshold and over the visible range can be quantified by examining perspective geometry. Visual acuity can be defined as the smallest size at which two objects can be distinguished. Acuity is assessed in many ways, from discriminating frequency gratings to target detection tasks (Boff & Lincoln, 1988; Buser & Imbert, 1992; Graham, 1951).
A
d
Dsep
B
i=2. tan( d (1)
Figure 2.2: Basic model of visual acuity. The visual angle, B, increases as the tangent of the ratio of the separation of the two point-objects, A and B, to the distance from the cornea of the eye to the perpendicular bisector that intersects points A and B.
Formula (1) gives a fairly accurate representation of the angle subtended by the separation of two objects as a function of depth. Now, we can define visual acuity as the maximum value of B for which A and B can no longer be discriminated.
Depth acuity refers to the ability of a subject to discriminate between two objects
positioned at different depths (Goldstein, 1989; Graham, 1951). Depth acuity is a particularly complex issue, since a depth percept is constructed from a number of cues. Depth cues can be classified into stereopsis cues and pictorial depth cues. Stereopsis refers to the production of a three-dimensional scene from the images acquired by each eye. Stereopsis cues also include accommodation and convergence, which help determine depth
by noting the state of rotation of the eyes (convergence) and the focus of the lens
The main pictorial depth cues generally include: * occlusion
* linear perspective * size and familiar size
* distance to horizon * color * shading * atmospheric effects * texture gradient * focus * shadow
* motion parallax (Goldstein, 1991; Buser & Imbert, 1992; Graham, 1951; Boff & Lincoln, 1988)
Interaction among pictorial depth cues is very difficult to quantify. However, the influence of occlusion, linear perspective, and size constancy cues is known to be stronger, under most conditions, than most of the other cues. Linear perspective and size constancy the cues used most frequently in VEs. This is due to the inability of most HMDs to produce a decent quality stereo image.
The other pictorial depth cues are generally more situation-dependent than the linear perspective and size constancy cues. For example, occlusion is useless unless two objects are placed so that one is at least partially in front of another. The color range available on most HMDs is not sufficient to produce a significant color depth effect. Plus, the "looking through binoculars" feeling of an HMD is not likely to produce an accurate familiar size cue. Most importantly, the deficiencies in color and resolution make blurring and
defocusing cues nearly worthless, preventing the use of anti-aliasing techniques.
Because of the limitations of the visual displays some depth cues are simply unavailable, and the remaining cues generally lack the precision of the real world. Since size constancy and linear perspective are the main depth cues used in VE displays, the examination of these cues will provide insight into the depth perception problems that result from poor pixel resolution.
First, the size constancy cue is based on the observation that familiar objects become smaller as they move farther away. Prior knowledge of the size of the object is an important component of the size constancy cue. Size constancy was first noted in the literature in 1889 when evidence was given to match the virtual retina theory (as presented in Equation [1]) (Maurtius).
(a)
B C
(b) (c) (d)
Figure 2.3: Size constancy. An object appears to shrink as the distance between it and the observer increases. (a) The size of the object is given as h at distances A, B, and C. (b) The object as seen at distance A. (c) The object as seen at distance B. (d) The object as seen at distance C.
Linear perspective cues generally require that the observer be some distance above the plane being viewed. Humans have their eyes conveniently located some distance above the ground which helps to provide this type of cue.
(a~
t/1) (c) (d)
Figure 2.4: The effect of viewpoint height. For a constant viewing distance, d, and a consistent fixation point, increasing the observation height decreases the visual angle subtended by the object and moves the horizon line. (a) The size of the object is given as h and the object is viewed from locations A, B, and C. (b) The object as seen from location A; viewpoint height is zero. (c) The object as seen from location B; viewpoint height is d&. (d) The object as seen from location
C; the viewpoint height is d.
A
(a)
(a)
A B C
(b) (C)
Figure 2.5: With the viewpoint located at a height H,,pt and fixed at a single point, the size of the object shrinks and it appears to move towards the horizon as the separation between the object and observer increases. (a) The size of the object is given as h and is viewed at distances A, B, C. (b) The object as seen at distance A. (c) The object as seen at distance B. (d) The object as seen from distance C
Given a particular viewpoint height, the linear perspective cue can be described as the motion of an object towards a center "infinity point" as it moves away from the observer. The following figure illustrates this idea:
-Wo
-Figure 2.6: Result of tracing the corner points of a square with width Wo and height Ho as the
separation between the observer and the object increases from zero to infinity.
Conveniently, both of these depth cues can be described by simple mathematics. A prediction of subject performance in a depth perception task can be based both on the perspective geometry and on the results of previous work in human visual performance. The development of a predictive model of visual depth perception in VEs will facilitate the quantification of threshold and depth estimation problems described above.
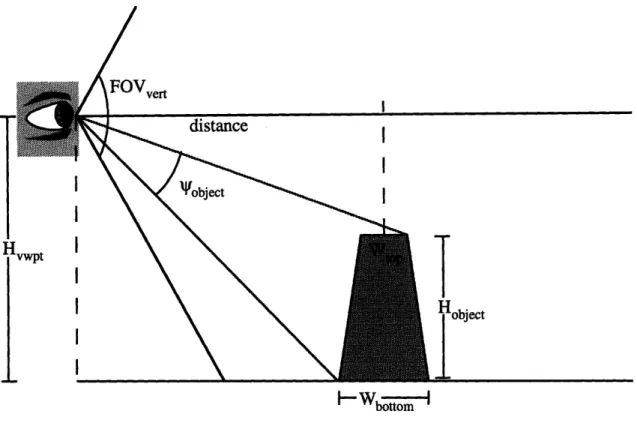
The first component of this model is a formula describing the visual angle subtended by an object as a function of viewing distance. For the following calculations, a simple model with no viewpoint height is assumed:
distance
lZeobject I h.
Figure 2.7: A simple model for the size constancy calculation. The angle subtended by the object, object, decreases as distance increases according to the tangent function given in Equation
(2).
Substituting the parameters of this model into Equation (1):
(2)
object = tan-I sizeobjectot
distance
8
NE"'r
Distance from observer (in feet)
Figure 2.8: A plot of Equation (2). The size of the object is assumed to be 15 feet by 15 feet. Given a value of 1 minute of visual angle for human spatial acuity, the greatest distance at which a 15 foot by 15 foot object can be detected is:
.-[]