HAL Id: hal-00123916
https://hal.archives-ouvertes.fr/hal-00123916
Submitted on 24 Apr 2017HAL is a multi-disciplinary open access archive for the deposit and dissemination of sci-entific research documents, whether they are pub-lished or not. The documents may come from teaching and research institutions in France or abroad, or from public or private research centers.
L’archive ouverte pluridisciplinaire HAL, est destinée au dépôt et à la diffusion de documents scientifiques de niveau recherche, publiés ou non, émanant des établissements d’enseignement et de recherche français ou étrangers, des laboratoires publics ou privés.
MIPAS ozone validation by stratospheric balloon and
aircraft measurements
U. Cortesi, C.E. Blom, C. Camy-Peyret, K. Chance, J. Davies, Florence
Goutail, J. Kuttippurath, C.T. Mcelroy, F. Mencaraglia, H. Oelhaf, et al.
To cite this version:
U. Cortesi, C.E. Blom, C. Camy-Peyret, K. Chance, J. Davies, et al.. MIPAS ozone validation by stratospheric balloon and aircraft measurements. 2nd Workshop on the Atmospheric Chemistry Validation of ENVISAT (ACVE-2), ESA-ESRIN, May 2004, Frascati, Italy. �hal-00123916�
MIPAS OZONE VALIDATION
BY STRATOSPHERIC BALLOON AND AIRCRAFT MEASUREMENTS
U. Cortesi * (1), C.E. Blom (2), C. Camy-Peyret (3), K. Chance (4), J. Davies (5), F. Goutail (6), J. Kuttippurath (7), C.T. McElroy (8), F. Mencaraglia (1), H. Oelhaf (2), A. Petritoli (9),
M. Pirre (10), J.P. Pommereau (6), F. Ravegnani (9), J.B. Renard (10), K. Strong (11)
(1)
Istituto di Fisica Applicata "Nello Carrara" (IFAC - CNR), Firenze, Italy, u. [email protected]
* currently visiting at Harvard – Smithsonian Center for Astrophysics, Cambridge, MA, USA
(2)
Forschungzentrum Karlsruhe (IMK - FZK), Karlsruhe, Germany , [email protected]
(3)
Laboratoire de Physique Moléculaire et Applications (LPMA - CNRS), Paris, France, [email protected]
(4)
Harvard - Smithsonian Center for Astrophysics, Cambridge, MA, USA, [email protected]
(5)
Meteorological Service of Canada, Downsview, Canada, [email protected]
(6)
Service d’Aeronomie - CNRS, Verrieres-Le Buisson, France, [email protected]
(7)
Institute of Environmental Physics, University of Bremen, [email protected]
(8)
Meteorological Service of Canada, Ontario, Canada, [email protected]
(9)
Istituto per le Scienze della Atmosfera e del Clima (ISAC - CNR), Bologna, Italy, [email protected]
(10)
Laboratoire de Physique et Chimie de l’Environment (LPCE - CNRS), Orléans, France, [email protected]
(11)
Department of Physics – University of Toronto, Toronto, Canada, [email protected]
ABSTRACT/RESUME
A number of in situ and remote sensing techniques for
the measurement of upper tropospheric and
stratospheric O3 content was employed during dedicated
experiments of the ESABC programme, aiming at the validation of the ENVISAT chemistry payload. In this paper, we will be focusing on the validation of MIPAS off-line products, by presenting the results of the intercomparison between MIPAS O3 vertical profiles
and aircraft and balloon correlative measurements. First priority is given to the validation of processor v4.61 data, but individual results of 2002 and 2003 balloon observations are also compared with MIPAS O3
non operational data. Some general remarks are finally expressed, along with specific recommendation to fully exploit the available ESABC validation dataset. 1. INTRODUCTION
The majority of balloon and airborne payloads deployed in the frame of the ESABC (ENVISAT Stratospheric Aircraft and Balloon Campaigns, [1]) activities embarked remote sounders and/or in situ sensors with different capabilities for the retrieval of O3 volume mixing ratio (VMR) vertical distribution. As a
consequence, a relatively high number of
intercomparisons can be established, for validation purposes, between MIPAS O3 profiles and correlative data acquired by aircraft and balloon instruments in reasonable time and space coincidence with the satellite measurements. Up to now, no specific attempt has been made to rigorously define uniform criteria for spatial and temporal overlapping of the above mentioned observations and the matching requirements that were adopted to select coincident data points have been evaluated on a case by case basis.
An overview of the ESABC O3 datasets presently available for intercomparison with MIPAS off-line products is given in Table 1, listing all the experiments
that, either from aircraft or balloon flights, provided useful inputs for MIPAS O3 validation.
Whenever possible, we have reported here only the results of comparisons with MIPAS operational products, i.e. with IPF v4.61 (Instrument Processing Facility version 4.61) O3 profiles. Relevant outcomes of the validation effort, based on previous versions of the MIPAS processor or on scientific retrieval codes, are included just for a small number of balloon experiments.
As evident from Table 1, due to the limited availability of v4.61 data, mostly aircraft and balloon flights carried out in the second half of 2002 have been considered. This approach restricted the geographical coverage of the present validation dataset essentially to Northern hemisphere mid-latitudes; only in a few cases the correlative measurements extended to the Tropical and Arctic regions and, with the sole exception of the ASUR radiometer operating onboard the FALCON aircraft, high and low latitude O3 observations from aircraft and balloon platforms can only be compared with MIPAS non operational data.
In summary, according to the recommendation to assign first priority, in all the ACVE-2 (Atmospheric Chemistry Validation of ENVISAT) validation reports, to results based on the reprocessed Cal/Val dataset released in early 2004, in the first two sections of this paper we will be focusing on the intercomparison between O3 measurements obtained, respectively, by balloon (section 2) and aircraft (section 3) instruments and MIPAS v4.61 data. Relevant information derived from the comparison of 2002 and 2003 balloon data with MIPAS non operational products are discussed in section 4. In section 5, although the limited amount of data available does not support any statistically meaningful conclusion, qualitative assessments on the status of MIPAS O3 off-line products are made, along
with recommendations for a full exploitation of the ESABC dataset.
_______________________________________________________
Proceedings of the Second Workshop on the Atmospheric Chemistry Validation of ENVISAT (ACVE-2) ESA-ESRIN, Frascati, Italy, 3-7 May 2004 (ESA SP-562, August 2004) EMI01UC
Table 1 – ESABC contributions to MIPAS O3 validation
Instrument campaign period Flight date/ coverage Latitude available for validation MIPAS dataset
IBEX 28-29 July 2002 Mid latitude IPF v4.61
MANTRA-SAOZ 3 September 2002 Mid latitude IPF v4.52
MANTRA-SPS 3 September 2002 Mid latitude IPF v4.52
SALOMON 19 September 2002 Mid latitude IPF v4.61
MIPAS-B 24 September 2002 Mid latitude IPF v4.61
FIRS-2 2 October 2002 Mid latitude IPF v4.61
LPMA 23 March 2003 High Latitude IPF v4.61
2 October 2002 Mid latitude IPF v4.61
SPIRALE
31 January 2003 High Latitude IMK-FZK home products
B
al
loon
MIR-SAOZ February 2003 Tropics IPF v4.55
ASUR September 2002 Tropics, Mid and High Lat. IPF v4.61
MIPAS-STR 22 July 2002 Mid latitude IPF v4.61
22 July 2002 Mid latitude IPF v4.61
FOZAN
24 October 2002 Mid latitude IPF v4.61
GASCOD-A 24 October 2002 Mid latitude IPF v4.61
A
ir
cr
af
t
SAFIRE-A 24 October 2002 Mid latitude IPF v4.61
2. BALLOON-BORNE MEASUREMENTS
Balloon flights, which provided good quality
measurements of O3 profiles matching one or more
ENVISAT overpasses and comparable with presently available MIPAS operational data, are those performed in the early validation phase, between July and October 2002. An important contribution was made, in this time frame, by the balloon-borne FTIR (Fourier Tranform InfraRed) observations carried out with four different high resolution spectrometers, which performed limb sounding measurements of upper tropospheric and stratospheric emission/absorption in the middle and far infrared regions.
Moreover, two French instruments, the SPIRALE and SALOMON spectrometers, operated by CNRS (Centre National de la Recherce Scientifique) teams, were launched from Aire sur l'Adour, France and from Kiruna, Sweden. SPIRALE samples in situ VMR values of a number of species during the ascent and descent
phases of each flight. SALOMON performs
measurements of the UV visible absorption spectrum of the Moon to derive the vertical concentration profiles of some important stratospheric species.
2.1 IBEX Results
During the first campaign of the ESABC programme, the IBEX (Infrared Balloon EXperiment, Istituto di Fisica Applicata "Nello Carrara", IFAC-CNR, Firenze,
Italy, [2]) FT-FIR spectrometer was flown from Sicily (Trapani-Milo, Lat 38ºN, Lon. 12ºE) to Spain in the night between 28th and 29th July, 2002, to acquire
correlative measurements of O3 and other minor
constituents in coincidence with a MIPAS-ENVISAT overpass over the Mediterranean region. Because of a delay in the balloon flight, it has been impossible to attain the planned exact matching between satellite and balloon-borne measurements. The intercomparison has been done therefore by using MIPAS-ENVISAT scans from 8 orbits overpassing the Mediterranean region in a
±2 days time window around the launch date.
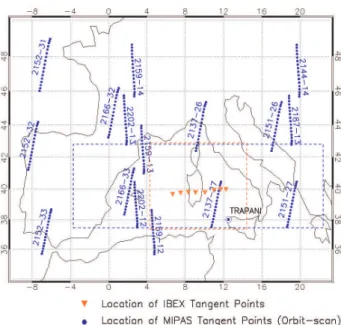
In Fig. 1, the geolocation of MIPAS tangent points for the selected scans (starting from orbit 2137 on 28th July and stopping at orbit 2202 on 1st August) is shown (blue circles). The selected IBEX dataset included 8 limb scanning sequences (red triangles in Fig.1 mark the average location of corresponding tangent points) recorded while flying at approximately constant latitude. The average of the O3 profiles retrieved from
the IBEX measurements has been compared with mean profiles obtained by averaging different sub-groups of MIPAS scans: all the selected scans over the Mediterranean region, only the nearest (in time) scans in the latitude belt defined by IBEX observations (blue dashed line box), only the scans satisfying the previous constraint and falling within ±2° in longitude from the region covered by IBEX (red dashed line box).
Results in the three cases did not show any major difference, indicating a substantial homogeneity of the observed air masses.
In Fig. 2, we display therefore the intercomparison between the mean O3 VMR distributions measured by
IBEX and the MIPAS vertical profile averaged on all the selected scans in Fig.1.
A substantial agreement is found, with just a small number of pressure levels for which the absolute difference between MIPAS and IBEX value exceeds the sum of respective random errors. In order to better exploit the IBEX data and to achieve more quantitative conclusions with regard to MIPAS O3 validation,
further analysis could be carried out with the support of modeling tools, such as those developed by University of L’Aquila for MIPAS validation measurements of a similar FT-FIR airborne instrument [3] ,[4].
Fig. 1. Location of balloon and satellite scans for the IBEX trans-Mediterranean flight on 28th July, 2002
Fig. 2. Comparison between IBEX and MIPAS-ENVISAT O3 mean vertical profiles .
2.2 MIPAS-B Results
A balloon-borne version of the MIPAS instrument (MIPAS-B, Forschungzentrum Karlsruhe, IMK-FZK, Karlsruhe, Germany, [5]), was launched from Aire sur l'Adour, France (Lat. 43ºN, Lon. 0ºE) on 24th September
2002, following a trajectory that allowed a perfect matching with the night-time MIPAS-E overpass of orbit 2975, record 16.
This made possible to obtain an O3 profile from the
balloon float altitude by looking at exactly the same air locations observed by the satellite instrument with a temporal delay less than 15 minutes.
In Fig. 3, the vertical distribution of O3 mixing ratio
measured by MIPAS-B is compared with the MIPAS-E profiles retrieved by using both processor v4.55 and v4.61. Error bars associated to the satellite profiles account only for random errors, whilst they refer to total error (1σ accuracy) in the case of MIPAS-B measurements. On the same plot, absolute differences between MIPAS-B and MIPAS-E (v4.61) O3 mixing
ratio values are reported as a function of pressure, along with the combined errors of corresponding data points. As clearly highlighted by the latter representation, balloon and satellite data agree well within the combined error bars, with the only exceptions of the levels around 100 hPa, above the lowest tangent pressure in MIPAS-E profile, and above 10 hPa, approximately in coincidence with the peak of the O3
vertical distribution. 0,1 1 10 100 -1 0 1 2 3 4 5 6 7 8 9 10 -1 0 1 2 3 4 5 6 7 8 9 10
Aire: 24 September 2002 Seq. N3 MIPAS-E (E): 24-Sep-2002 22:07:50 V4.61 MIPAS-E : 24-Sep-2002 22:07:50 V4.55 MIPAS-B (B): 24-Sep-2002 22:21:42 Absolute Diff. (B-E)
Combined errors MIPAS-B error bars: 1σ accuracy MIPAS-E error bars: only noise error
Absolute difference (ppmv) O3VMR (ppmv) Rec.16 - North P re s s u re (h P a )
Fig. 3. Validation of MIPAS O3 v4.55 and v4.61 profiles by
MIPAS-B data on 24th September, 2002
2.3 FIRS-2 Results
The Far Infrared Spectrometer (FIRS-2 [6]) of the
Harvard-Smithsonian Center for Astrophysics,
Cambridge, MA, USA was flown on 20th October, 2002 from the National Scientific Balloon Facility balloon launch site at Fort Sumner, NM, USA (Lat. 34ºN, Lon. 104ºW) and performed limb sounding observations of several stratospheric constituents, aiming at the
validation of MIPAS L2 products from the co-located scans of orbit 3343. The red triangle in Fig. 4 indicates the average location of the FIRS-2 20 km tangent points during the flight, closely matching both in time and in space the one of MIPAS measurements for the ENVISAT orbit 3343 (≡ 17:17 UT, the circles showing the location of MIPAS points at 30 km tangent altitude for each scan of the selected orbits).
Unfortunately, the coincident satellite measurements correspond to missing records in the reprocessed Cal/Val dataset (v4.61 data) and a comparison of balloon results has been possible only with available profiles from nearby scans of previous (e.g., 3336 ≡ 05:00 UT and 3337 ≡ 06:40 UT, the same day) and later orbits (e.g., 3350 ≡ 04:30 UT, 21st October, 2004).
In Fig. 4, MIPAS tangent points located westward or eastward of the selected FIRS-2 measurement correspond, respectively, to upwind and downwind air masses.
Fig. 4. FIRS-2 ENVISAT validation flight on 20th October, 2002
In Fig. 5, the average profile of O3 mixing ratio retrieved
from the FIRS-2 limb-scanning sequences is plotted as a function of altitude, along with the available O3 values
from the relevant MIPAS upwind and downwind scans.
Fig. 5. Comparison between the FIRS-2 averaged O3 profile
and O3 VMR values retrieved from nearby MIPAS scans
Despite the loose spatial and temporal overlap, good agreement is observed in the altitude range between 20 and 40 km. Below 20 km, higher O3 mixing ratio values
are obtained by FIRS-2 compared to the MIPAS profiles.
It should be noted, however, that below 20 km, differences exceeding the combined errors of O3 mixing
ratios are also frequently observed in comparisons with other aircraft and balloon correlative data due to the much higher variability of lower straospheric and upper tropospheric O3. Comparison of vertical profiles for this
altitude region must be based, therefore, on perfectly matching data points, in order to support any final conclusions.
An additional FIRS-2 flight occurred on September 20-21, 2003, also from Ft. Sumner, NM (see Table 3). MIPAS data are not yet available to include FIRS-2 measurements from this flight to be used in the validation.
2.4 LPMA Results
The Limb Profile Monitor of the Atmosphere (LPMA,
Laboratoire de Physique Moleculaire et Applications, CNRS, Paris, France, [7]) FT spectrometer contributed
to the validation of MIPAS trace gas profiles by means of solar absorption observations performed in its long-wave infrared optical configuration. Measurements of O3 vertical distribution have been carried out by LPMA
during a balloon flight executed from Kiruna, Sweden on 23rd March, 2003. The quality of the match with the
night-time MIPAS-E overpass was fairly good, with approximately ∆lat < 2°, ∆lon < 11° and ∆time < 6 hours. The O3 VMR values measured by LPMA during
the ascent phase have been compared with currently available MIPAS-E data (v4.61).
Results of the comparison are shown is Fig. 6, where the error bars associated with the LPMA profile represent total error (2σ accuracy), whereas MIPAS-E errors are accounting only for random errors. Balloon and satellite agree well within the combined error bars, except near the altitude of 17.2 km (around 100 hPa).
10 15 20 25 30 35 40 0 1 2 3 4 5 6 7 8 9
LPMA (67.3N, 23.7E, 15:48 UT) MIPAS (65.7N, 12.7E, 21:16 TU)
O3 vmr (ppmv) al ti tu d e (k m )
2.5 SPIRALE Results
The tunable diode laser absorption spectrometer SPIRALE (SPectroscopie InfraRouge par Absorption de Lasers Embarques, [8]), operated by LPCE-CNRS (Laboratoire de Physique et Chimie de l'Environment, Orleans, France), contributed to the ESABC programme with a mid-latitude and with a high latitude flight, carried out, respectively, from Aire sur l'Adour on 2nd
October, 2002 and from Kiruna on 21st January, 2003 to
measure O3, CH4, N2O, CO, NO, NO2, HNO3 and HCl VMR profiles.
At present, comparison with MIPAS operational products is only possible for the O3 measurements
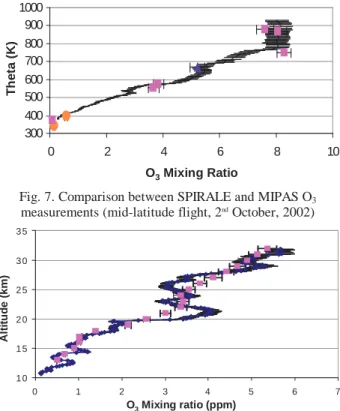
performed during the mid-latitude campaign; in this case, MIPAS data, from 4 to 6 days before the flight, on air parcels trajectories ending at the SPIRALE measurements location had to be considered, due to the lack of simultaneous balloon and satellite measurements (MIPAS being off on the date of the SPIRALE flight). Results of the comparison are shown in Fig. 7, where O3
mixing ratio from SPIRALE and MIPAS are plotted as a function of Potential Temperature, highlighting a substantially good agreement on the entire altitude range covered by the measurements (approximately from 10 to 35 km). The black solid line represents the SPIRALE profile measured on 2nd October, 2002 between 09:20 and 10:40 UT, with 5% error bars (precision); MIPAS O3 values on trajectories ending at the SPIRALE location are shown for 25th (triangles), 27th (squares) and 28th (circles) September overpasses.
300 400 500 600 700 800 900 1000 0 2 4 6 8 10 O3(ppm) T e ta (K ) O3Mixing Ratio T h e ta ( K )
Fig. 7. Comparison between SPIRALE and MIPAS O3
measurements (mid-latitude flight, 2nd October, 2002)
1 0 1 5 2 0 2 5 3 0 3 5 0 1 2 3 4 5 6 7 O3 (pp m ) h ( k m ) O3Mixing ratio (ppm) A lt it u d e ( k m ) 1 0 1 5 2 0 2 5 3 0 3 5 0 1 2 3 4 5 6 7 O3 (pp m ) h ( k m ) O3Mixing ratio (ppm) A lt it u d e ( k m )
Fig. 8. Comparison between SPIRALE and MIPAS O3
measurements (high-latitude flight, 21st January, 2003)
A good match was obtained between SPIRALE and MIPAS observations for the 21st January, 2003 flight (∆lat. ≤ 2º; ∆lon. ≤ 10º; ∆time ≤ 1.5h) for which only
non operational MIPAS products can be validated at the moment (home products of the IMK-FZK, comparison with these non operational products is reported here rather than in paragraph 4 for the sake of continuity with previous SPIRALE measurements description). Overall, the O3 in situ values determined by SPIRALE exhibit a
fairly good degree of consistency with the O3 vertical
distribution retrieved by MIPAS. Interestingly, however, larger differences are observed compared to the mid-latitude case. These differences seem to be associated with the stronger vertical gradient in the O3
field, that cannot be captured by the MIPAS measurements due to the lower altitude resolution of the satellite instrument.
2.6 SALOMON Results
LPCE-CNRS also operates the SALOMON
(Spectroscopie d'Absorption Lunaire pour l'Observation des Minoritaores Ozone et NOx, [9]) instrument, an
UV-Visible spectrometer using moon occultation to measure the vertical distribution of O3, NO2, NO3, OClO and
OBrO concentration. For the SALOMON flight, executed on 19th September, 2002 from Aire sur l'Adour, the quality of the matching with simultaneous MIPAS-E measurements did not allow a direct comparison of O3 profiles. Coincidences with the
balloon observations were found therefore, by looking at satellite data from 12 hours later on air parcel trajectories beginning at the SALOMON measurements location.
The results are shown in Fig. 9, where the O3 volume
mixing ratio of MIPAS and SALOMON matching data points are plotted versus Potential Temperature. A good agreement is generally observed, apart that for the few points around the maximum of the O3 vertical
distribution. 0 200 400 600 800 1000 1200 1400 0 2 4 6 8 10 O3 (ppm) T e ta ( K ) O3Mixing Ratio T h e ta ( K ) 0 200 400 600 800 1000 1200 1400 0 2 4 6 8 10 O3 (ppm) T e ta ( K ) O3Mixing Ratio T h e ta ( K )
Fig. 9. Comparison between SALOMON and MIPAS O3
3. AIRBORNE MEASUREMENTS
Correlative measurements of the O3 content for the
validation of MIPAS L2 products were planned by sensors operating aboard the German aircraft FALCON, as well as on the Russian stratospheric platform M-55 Geophysica. Aboard the DLR FALCON, the ASUR submillimeter radiometer retrieved O3 profiles in the
altitude range between 15 and 50 km. Useful inputs for the validation of the MIPAS O3 v4.61 data were
obtained by the M-55 payload, both from in situ profiles measured by the FOZAN chemiluminescent O3 sonde
and by the UV-Visible Spectroradiometer GASCOD-A during the ascent and descent phases of the flights and from limb sounding observations at constant altitude by MIPAS-STR and SAFIRE-A spectrometers.
3.1 ASUR Results
The dataset of ASUR (Airborne Submillimeter Radiometer, Institute of Environmental Physics, University of Bremen, Germany, [10]) O3 measurements available for comparison with MIPAS operational L2 products has been derived from the analysis of measurements acquired during 8 flights performed in September 2002 with the FALCON across a wide range of latitudes, spanning from the Tropics, via mid-latitudes, to the Arctic region. The campaign was in fact conducted for validating the SCIAMACHY sensor. The present intercomparison with MIPAS products has been
based on matching criteria requiring respectively
∆lat.<1° and ∆lon.<10° for space overlapping and
∆time< 5h for time coincidence. This resulted in the choice of more than 60 coincident measurements.
Examples of comparison between ASUR and MIPAS O3
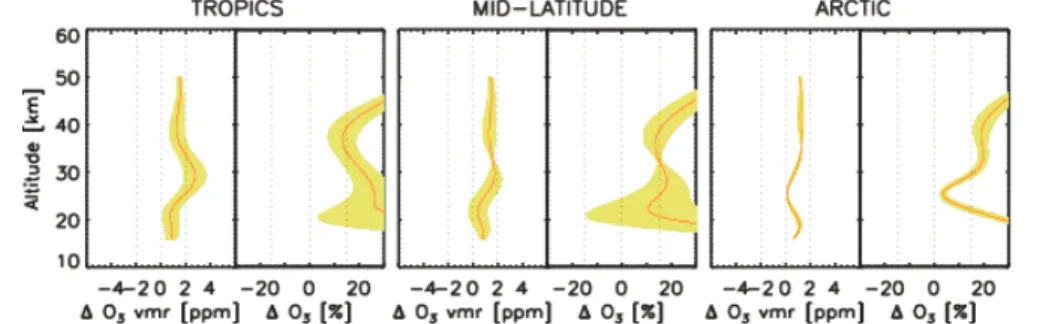
profiles are shown in Fig. 10. The statistics derived from the comparison is illustrated in Fig. 11. The comparison shows that the difference ASUR - MIPAS is about 10-15% at all latitude regions. This is within the estimated accuracy of ASUR O3 retrievals. The absolute
differences indicate systematically lower VMR values in the order of 1 or 2 ppm compared with ASUR measurements. The rolling shape might possibly be due to an altitude mismatch. Below 20 and above 40 km larger deviations are observed. In the lower stratosphere, though the absolute difference is reasonable, the difference in percentage scale is large. This could be due to relatively higher VMR values in ASUR O3 profiles against the near-zero VMR in MIPAS
profiles. This is also the region where ASUR O3 profiles
have large error bars. It must be pointed out that, whilst the statistics for the tropical data (5S-30N) is based on relatively large datasets (49 coincident measurements), for the mid (30N-60N) and high latitude (60N-90N) only a few matchings have been found. For the Arctic, data have been taken from only one flight (5 measurements) and the similar profiles (stable atmospheric conditions) explain the hardly visible standard deviation in the corresponding plot.
Figure 10. Comparison between typical O3 profile measured by ASUR and the corresponding profile by MIPAS at three
different latitudes. Green plus signs represent the original O3 values retrieved by MIPAS v4.61; solid blue and red lines
are, respectively, the profile observed by ASUR and the one derived from MIPAS values smoothed by using ASUR averaging kernels to account for its lower vertical resolution. The pale blue error bars on ASUR profiles show the estimated accuracy of ASUR O3 measurement, which is 15%, and 0.3 ppm in the lower stratosphere respectively.
Fig. 11. The difference between ASUR-MIPAS O3 profiles at tropical, mid-latitude, and the Arctic regions.
In each region, the left plot shows the difference in absolute values and the right plot shows the difference in percentage values. The yellow bars indicate the standard deviation from the mean
3.2 MIPAS-STR Results
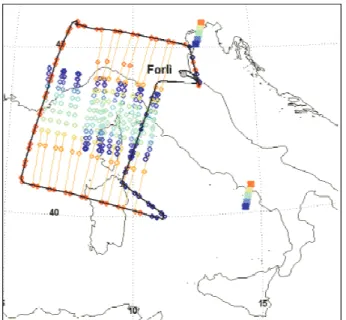
On 22nd July, 2002, the M-55 Geophysica carried out a daytime flight from the operative base of Forlì, Italy (Lat. 44°N, Lon. 12°E), in coincidence with the ENVISAT overpass of orbit 2051, aiming at the validation of the geophysical products from the satellIte chemistry instruments.
Fig. 12 shows the M-55 flight track, along with the geolocation of MIPAS-STR (MIPAS-STRatospheric aircraft, Forschungzentrum Karlsruhe, IMK-FZK, Karlsruhe, Germany, [11]) and MIPAS-E tangent points (scan 12 and 13). Even tough the aircraft measurements were acquired with minimum delay respect to the selected overpass, no optimal co-location was attained with the MIPAS-E measurements.
Fig. 12. Map of the Geophysica flight on 22nd July, 2002.
The MIPAS-STR and MIPAS-E tangent points are colour coded depending on the tangent height
(dark blue for 6 km, red for 20 km)
In order to compare the O3 VMR profiles retrieved by
MIPAS-STR with the corresponding MIPAS-E
operational products, an average of 12 profiles recorded on the south-bound leg (at an altitude of approximately 17 km, between 07:28 and 07:59 UTC) was calculated, along with the average of 7 profiles recorded on the north-bound leg (at an altitude of 19 km, between 09:06 and 09:27 UTC).
The resulting mean profiles are reported in Fig. 13, where also the MIPAS-E O3 VMR values are plotted as
a function of the tangent pressures. The errors bars for MIPAS-STR profiles show the contributions from the spectral noise, from the radiometric calibration, from the uncertainty in the HITRAN line data and finally the propagation of a 2K error in the retrieved temperatures.
The airborne data are in fairly good agreement with the O3 profile retrieved from MIPAS-E scan 13, whilst a
significant bias is observed in the case of scan 12.
Fig. 13. Comparison of MIPAS-STR and MIPAS-E O3 VMR profiles
3.2 GASCOD-A and FOZAN Results
O3 correlative measurements from the M-55 Geophysica
flight on 22nd July, 2002 have been recorded also from the GASCOD-A (Gas Absorption Spectrometer
Correlating Optical Differences, Institute of
Atmospheric Science and Climate, ISAC-CNR, Bologna, Italy, [12]) and FOZAN (Fast OZone ANalyzer, [13], operated by ISAC-CNR and by the Central Aerological Observatory, CAO, Moscow, Russia) instruments. Both sensors were capable of measuring the O3 vertical distribution during the descent
phase, with the GASCOD-A spectrometer exploiting the off-axis observations technique described in [14], to derive quasi in situ information about the O3
concentration. The aircraft and satellite measurements overlap quite nicely, being measured almost at the same time and with a spatial mismatch of a few hundred km (rough estimate ≅ 250-300 km).
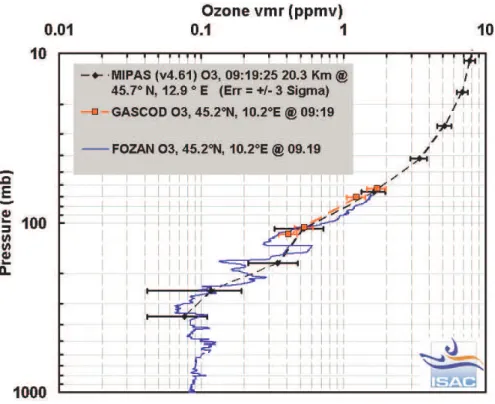
In Fig. 14, the O3 values determined by GASCOD-A
and FOZAN are superimposed to the MIPAS v4.61 retrieved profile from scan 12. Taking into account the much higher vertical resolution of the in situ measurements, we can conclude that consistent values are observed for the entire range of altitude covered by both airborne and satellite observations.
A further opportunity for intercomparison with MIPAS operational products was offered by the O3 in situ
measurements acquired by the FOZAN
chemiluminescent sonde on 24th October, 2002. In this case, a couple of vertical profiles can be reconstructed from data recorded by FOZAN during the first half of the flight, between 20:09 and 21:57 UT, and during the second half, between 21:58 and 22:36 UT.
These profiles are compared, in Fig. 15, with the O3
vertical distribution retrieved from MIPAS data of scan 15 (squares) and scan 16 (circles) of orbit 3403. The aircraft data were acquired with a maximum temporal delay of 1h 15min respect to the ENVISAT overpass and
the quality of the spatial overlapping between FOZAN and MIPAS-E measurements can be estimeted to be better than 300 km.
The O3 values retrieved from the satellite measurement
exhibit a reasonable agreement with the vertical profiles derived from in situ sampling. Despite the rapid variation in the vertical structure of O3 distribution, that
can locally result in differences between the MIPAS-E and FOZAN values exceeding the combined errors, no large discrepancy are observed and MIPAS-E seem to be able to capture, at least partially, the thin features displayed by the O3 profile between 80 and 100 hPa.
Fig. 14. Comparison of O3 profiles
measured by FOZAN, GASCOD-A and MIPAS-E (orbit 2051, record 34) on 22nd July, 2002.
Fig. 15. Comparison of O3 profiles
measured by FOZAN, and MIPAS-E (orbit 3403, record 15) on 24th October 2002
3.4 SAFIRE-A Results
Limb sounding emission measurements in the
far-infrared were performed by the SAFIRE-A
(Spectroscopy of the Atmosphere by using Far-Infrared Emission - Airborne, Institute of Applied Physics, “Nello Carrara”, IFAC-CNR, Firenze, Italy, [15]) instrument on-board the M-55 Geophysica aircraft during the flight of 24th October, 2002, allowing the retrieval of VMR vertical profile of O3 and other
compounds from flight level down to the tropopause height. In Fig. 16, the geolocation of MIPAS-E tangent points is indicated; the location of SAFIRE-A measurements is also plotted, with stars marking the avarage latitude and longitude of each limb scanning sequence. As evident from the figure, some of the SAFIRE-A profiles were acquired in very good spatial and temporal coincidence with the MIPAS data from orbit 3403 (record 14 and 15).
Fig. 16. Geolocation of SAFIRE-A and MIPAS-E tangent points for the M-55 Geophysica flight
on 24th October, 2002.
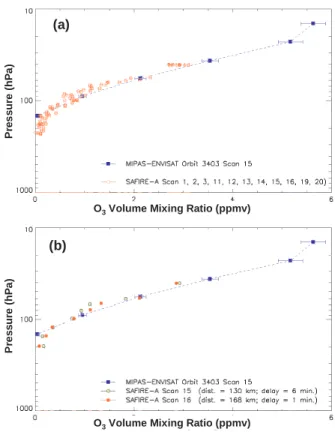
Matching criteria corresponding to a maximum time difference of 2.5 hours and to a spatial mismatch smaller than 200 km can be fixed, leading to the intercomparison of 11 individual profiles retrieved from SAFIRE-A data with the MIPAS O3 data from scan 15
shown in Fig. 17 (a). In Fig. 17 (b), the same intercomparison is restricted to SAFIRE-A sequences 15 and 16 that satisfy a more tight criterion for the time difference (∆time ≤ 10 minutes).
O3Volume Mixing Ratio (ppmv)
P re s s u re ( h P a )
O3Volume Mixing Ratio (ppmv)
P re s s u re ( h P a )
Fig. 17. MIPAS O3 validation measurements
by SAFIRE-A on 24th October, 2002
In this case, a good agreement is observed between the O3 values retrieved by MIPAS and by SAFIRE-A within
the combined errors (error bars in Fig. 17 only account for random errors both in MIPAS-E and SAFIRE-A case).
4. Validation of MIPAS O3 non operational data 4.1 Results from the MANTRA balloon campaign One of the objectives of the 2002 MANTRA (Middle Atmosphere Nitrogen TRend Assessment, [16]) balloon campaign has been to validate the GOMOS, SCIAMACHY and MIPAS measurements. A balloon flight was performed on September 3rd from Vanscoy, Saskatchewan, Canada (Lat. 52°N, Lon. 107°W) in close time and space coincidence with ENVISAT overpasses. Six MIPAS profiles from two ENVISAT orbits were compared with the MANTRA data. The coordinates for the nighttime profiles from orbit 2664 (3rd September UTC) were:
• 4:41:35 UTC, 45.90°N, 97.75°W, SZA=120.81°, LST=22.17hr • 4:42:54 UTC, 50.99°N, 97.11°W, SZA=116.76°, LST=22.24hr • 4:44:15 UTC, 55.69°N, 98.01°W, SZA=112.50°, LST=22.20hr. (a) (b)
Those for the morning profiles from orbit 2671 (3rd
September UTC) were:
• 16:47:53 UTC, 56.24°N, 96.86°W SZA=52.25°, LST=10.34hr • 16:49:14 UTC, 51.46°N, 98.32°W, SZA=48.63°, LST=10.27hr • 16:50:45 UTC, 46.05°N, 99.78°W, SZA=44.78°, LST=10.19hr.
The MANTRA payload for the 3rd September, 2002
flight included 5 UV-Visible spectrometers, 2 FTIR spectrometers, 1 radiometer and 3 sondes. Ozone measurements presented here were performed by the SAOZ spectrometer (Service d'Aeronomie, CNRS, Verrieres-le-Buisson, France, [17]), by one of the two SPS (SunPhotoSpectrometer, Meteorological Service of Canada, [18]), UV-visible spectrometers on the gondola and by ozonesondes launched on the same day as the balloon flight, as well as on some earlier and later dates.
The SAOZ sunrise measurements were made at 11:52 UTC on 3 September, with tangent point latitude 53.56°N and longitude 98.69°W. The SAOZ sunset measurements were made at 01:48 UTC on 4 September at tangent point latitude 53.44°N and longitude 106.90°W. O3 VMR vertical profiles, as measured by
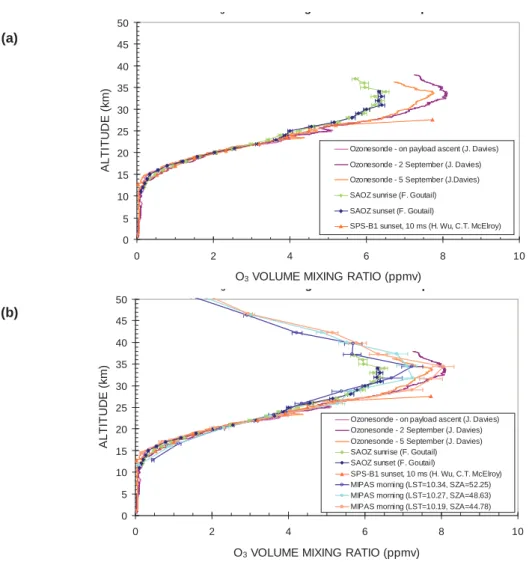
the SAOZ instrument at sunrise and sunset, by the SPS-B1 at sunrise, and by ozone soundings, are compared in Fig. 18 (a) with the O3 distribution retrieved from
MIPAS observations on the morning overpass.
MIPAS data were provided by A. Dudhia and C. Piccolo, University of Oxford (MIPAS ESA software version 4.52). Similarly, a comparison with MIPAS O3
profiles acquired during the nighttime overpass is shown in Fig. 18 (b).
Strong variability in the O3 peak values is observed for
both sunrise and sunset, between the different instruments, that otherwise exhibit substantially good agreement over the entire altitude range from 10 to 50 km.
MANTRA O3 Volume Mixing Ratio Profiles: 3 September 2002
0 5 10 15 20 25 30 35 40 45 50 0 2 4 6 8 10
O3 VOLUME MIXING RATIO (ppmv)
A L T IT U D E ( k m )
Ozonesonde - on payload ascent (J. Davies) Ozonesonde - 2 September (J. Davies) Ozonesonde - 5 September (J.Davies) SAOZ sunrise (F. Goutail) SAOZ sunset (F. Goutail)
SPS-B1 sunset, 10 ms (H. Wu, C.T. McElroy)
MANTRA O3 Volume Mixing Ratio Profiles: 3 September 2002
0 5 10 15 20 25 30 35 40 45 50 0 2 4 6 8 10
O3 VOLUME MIXING RATIO (ppmv)
A L T IT U D E ( k m )
Ozonesonde - on payload ascent (J. Davies) Ozonesonde - 2 September (J. Davies) Ozonesonde - 5 September (J. Davies) SAOZ sunrise (F. Goutail) SAOZ sunset (F. Goutail)
SPS-B1 sunset, 10 ms (H. Wu, C.T. McElroy) MIPAS morning (LST=10.34, SZA=52.25) MIPAS morning (LST=10.27, SZA=48.63) MIPAS morning (LST=10.19, SZA=44.78)
Fig. 18. MANTRA O3 measurements
on 3rd September, 2002: comparison with MIPAS
daytime (a) and nighttime (b) profiles.
(a)
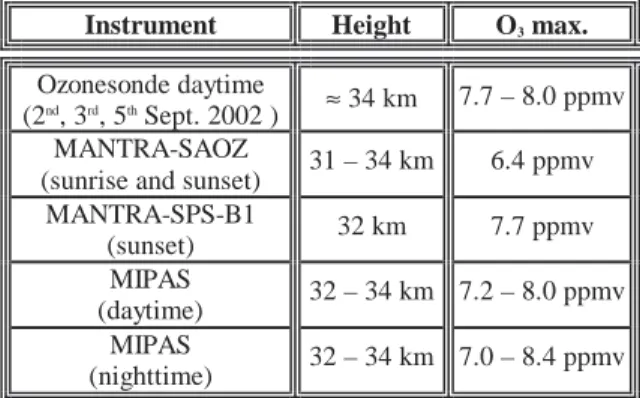
Table 2 gives the location and value of the O3 maximum
for each of the measured profiles.
Table 2. Location and value of the O3 peak in the
vertical profiles measured by the MANTRA payload
Instrument Height O3 max.
Ozonesonde daytime
(2nd, 3rd, 5th Sept. 2002 ) ≈ 34 km 7.7 – 8.0 ppmv
MANTRA-SAOZ
(sunrise and sunset) 31 – 34 km 6.4 ppmv
MANTRA-SPS-B1 (sunset) 32 km 7.7 ppmv MIPAS (daytime) 32 – 34 km 7.2 – 8.0 ppmv MIPAS (nighttime) 32 – 34 km 7.0 – 8.4 ppmv 4.2 MIR-SAOZ Results
Series of ozone profiles at the tropics from 6 to 28 km altitude have been obtained using a SAOZ instrument carried by Infra-Red Montgolfier (MIR) long duration balloons flown from Bauru (22°S, Brazil) in February 2001 and in February 2003 as part of ENVISAT validation activities. Fig. 19 shows the trajectories of the two balloons resulting in the collection of 54 and 11 profiles (half at sunrise, half at sunset) respectively.
Feb 2001, 34d Feb 2003, 11d
Bauru
Fig. 19. Trajectories of the 2001 and 2003 MIR-SAOZ long duration balloon flights
The error analysis, confirmed by comparisons with
tropospheric and stratospheric ozone lidar
measurements during the overpass of the balloon over Reunion Island as well as with SHADOZ ozonesondes and HALOE and SAGE 2 measurements at the same latitude, indicates that the precision of the SAOZ ozone measurements is better than 2% (3.5% accuracy) in the stratosphere and 5-6% (12 and 25% accuracy at 15 km and 10 km respectively) with an altitude registration better than ± 100m [19].
Fig. 20 shows the zonal mean MIPAS ESA v4.55 operational products and SAOZ profiles at 20 ± 5° S in
February 2003 (left), the percent difference between them (middle) and the percent variability or standard deviation of the profiles along a constant latitude (right), most of it being demonstrated to be due to the impact of horizontal and vertical transport in the SAOZ data. Compared to SAOZ, the MIPAS v4.55 products display no significant bias (within ± 5%) and no difference in altitude registration (within ± 100 m) in the stratosphere above 20 km, but a lower precision: ± 8% (one standard deviation) if one assumes that all the SAOZ variability is due to measurement error and not natural variability. However, the comparison degrades rapidly in the Tropical Tropopause Layer and the upper troposphere below the cold point level around 17.5 km. Large biases and random errors could be observed in MIPAS as well as in all satellite retrievals. The frequent presence of high altitude clouds makes remote measurements from space extremely difficult in the tropical upper troposphere. 100 80 60 40 20 0 Variability (%) Std Dev above 20 km 11 % 2.8 % -100 -50 0 50 100 Difference (%) Diff above 20 km 0.9 ± 5.4 % 35 30 25 20 15 10 Altitude (km) 6x10¹² 5 4 3 2 1 0 Number Density MIPAS SAOZ-MIR
Mean profiles Mean difference (bias and alt. registration)
Variability (precision)
Fig. 20. MIR-SAOZ/ MIPAS comparison at the tropics 5. CONCLUSIONS
In this paper we have reviewed the status of the ESABC MIPAS O3 validation, by presenting the available results
from individual balloon and airborne instruments or campaigns.
Despite the remarkable number of productive flights, that offered a wealth of measurements to be compared with co-located MIPAS O3 VMR profiles, only very
limited statistical conclusions can presently be made, based on consolidated output of the intercomparisons between ESABC and MIPAS v4.61 data.
This is partly because aircraft or balloon observations not always show an optimal space and time overlapping with the target MIPAS-E overpasses, thus requiring some further analysis and the support of suitable modeling tools to be more properly compared with the satellite data.
Moreover, the limited amount of MIPAS measurements accessible through the Cal/Val dataset is another important factor that up to now has prevented the full exploitation of the ESABC validation measurements (i.e. the data from all 2002-2004 flights).
Table 3. Additional ESABC O3 measurements
to be used for MIPAS-ENVISAT validation
Instrument Flight date/
campaign period
Latitude coverage
MANTRA-SAOZ August 2004 Mid latitude
MANTRA-SPS August 2004 Mid latitude
SALOMON March 2004 High latitude
MIPAS-B 20-21 March 2003 High latitude
FIRS-2 20-21 September 2002 Mid latitude
B
al
loon
MIR-SAOZ 26 February – 4 April 2004 Tropics
ASUR January - March 2003 Tropics, Mid and High Lat.
MIPAS-STR March 2003 High latitude
FOZAN March 2003 High latitude
GASCOD-A March 2003 High latitude
A
ir
cr
af
t
SAFIRE-A March 2003 High latitude
Nevertheless, by combining the relatively high number of individual validation results described in the previous sections, it is possible to reach some general qualitative conclusion and to identify common features and trends in the available intercomparisons dataset.
• in general, good agreement is found, particularly in the altitude range between 20 and 40 km;
• significant differences are observed, in several cases, at lower altitudes (below 20 km; e.g. MIPAS-B, FIRS-2, ASUR, SAFIRE-A, FOZAN, MIR-SAOZ).
• further major discrepancies also appear to be localized around the peak values of the O3 vertical
distributions; (e.g. MIPAS-B, MANTRA-SAOZ, MANTRA-SPS, SALOMON).
In order to refine these qualitative results and to extract quantitative information from a statistically meaningful validation dataset a first priority is certainly represented by the need to fill the existing gaps in MIPAS 2002 operational data and to have access to 2003 off-line products. This would make it possible to use for the intercomparisons an extended ensemble of balloon and aircraft data, by adding to the exisiting results displayed in Table 1, the data from all flights and campaigns listed in Table 3.
Finally, it is reccommended in the future to adopt unique criteria for the definition of measurements overlapping, so to have more homogeneus outputs from the comparison of individual airborne and balloon profiles withthe O3 vertical distribution retrieved by
MIPAS-E.
ACKNOWLEDGMENTS
The MIPAS O3 validation results described in this paper
have been attained thanks to the dedicated work of each contributing team, involving a number of people that extends far beyond the single representatives cited in the authors list. Special thanks go also to the personnel of the balloon launch facilities and aircraft platforms, that supported the field operation of different payloads during the ENVISAT validation campaigns.
REFERENCES
1. P. Wursteisen, The validation of the ENVISAT chemistry instruments by use of stratospheric balloon and aircraft, Proceedings of ENVISAT Validation
Workshop, Frascati, 9–13 December 2002, ESA
SP-531, August 2003.
2. G. Bianchini et al., Correlative measurements of selected molecules over the Mediterranean region,
Proceedings of ENVISAT Validation Workshop, Frascati, 9–13 December 2002, ESA SP-531, August
2003.
3. U. Cortesi et al., Results of Mid-latitude MIPAS validation measurements obtained by the SAFIRE-A airborne spectromter, this issue.
4. B. Grassi et al., Assimilation of Ozone profiles from MIPAS in the STRATAQ CTM, this issue.
5. F. Friedl-Vallon et al., Design and characterisation of the balloon-borne Michelson Interferometer for Passive Atmospheric Sounding (MIPAS-B2), Applied Optics, Vol. 43, Issue 16, p. 3335, May 2004..
6. D.G. Jonhson, Smithsonian stratospheric far-infrared spectrometer and data reduction system, J. Geophys.
7. C. Camy-Peyret, Jeseck P., Hawat T., Durry G., Payan S., Berubé G., Rochette L. and Huguenin D., The LPMA balloon-borne FTIR spectrometer for remote sensing of atmospheric constituents, ESA Publications
SP-370, 323-328,1995.
8. G. Moreau, et al., A new balloon-borne instrument for in situ measurements of stratospheric trace species using infrared laser diodes, ESA SP-397, pp. 421-426, 1997.
9. J.B. Renard, SALOMON: a new, light balloonborne UV-visible spectrometer for nighttime observations of stratospheric trace gas species, Applied Optics, Vol. 39, Issue 3, pp. 386-392, 2000.
10. J. Mees et al., ASUR – An Airborne SIS Receiver for Atmospheric Measurements of Trace Gases at 625 to 760 GHz, IEEE Trans. Microwave Theory Tech., 43, pp. 2543-2548, 1995.
11. Keim C., et al., Validation of MIPAS-ENVISAT by correlative measurements of MIPAS-STR, this issue. 12. Petritoli A. et al., An Airborne UV-Visible spectrometer for DOAS and radiometric measurements, Proc. SPIE Vol.3756, Optical Spectroscopic Techniques
and Instrumentation for Atmospheric and Space Research III, Allen M. Larar; Ed. , pp. 544-554, , 1999.
13. Yushkov V.A. et al., A Chemiluminescent Analyzer for Stratospheric Measurements of the Ozone Concentration (FOZAN). Journal of Atmospheric and
Oceanic Technology: Vol. 16, N. 10, pp. 1345-1350,
1999.
14. Petritoli A. et al., Off-Axis Measurements of Atmospheric Trace Gases by Use of an Airborne Ultraviolet-Visible Spectrometer, Applied Optics, Vol. 41 Issue 27 p. 5593, September 2002.
15. Bianchini G. et al., SAFIRE-A: optimised instrument configuration and new assessment of spectroscopic performances, Applied Optics, Vol. 43, Issue 14, p. 2962, May 2003.
16. Strong K. et al., The MANTRA 2002 Balloon Flight from Vanscoy, Canada. Proceedings of the ENVISAT
Validation Workshop Frascati, Italy, 9-13 December, 2002. ESA Special Publication SP-531, August 2003.
17. Pommereau J.P. and Piquard J., Ozone, Nitrogen Dioxide and Aerosol Vertical Distributions by UV-Visible Solar Occultation from Balloons, Geophysical
Research Letters, 21, 1227, 1994.
18. McElroy C.T., A Spectroradiometer for the Measurement of Direct and Scattered Solar Spectral Irradiance from On-Board the NASA ER-2 High-Altitude Research Aircraft, Geophysical Research
Letters, 22, 1361, 1995.
19. Borchi F., Pommereau J.-P., Garnier A. and Nunes-Pinharanda M., Evaluation of SHADOZ sondes, HALOE and SAGE II ozone profiles at the Tropics from SAOZ UV-Visible remote measurements onboard long duration balloons, Atm. Chem. and Phys., submitted, 2004-06-24