HAL Id: hal-02325858
https://hal.archives-ouvertes.fr/hal-02325858
Submitted on 22 Oct 2019HAL is a multi-disciplinary open access archive for the deposit and dissemination of sci-entific research documents, whether they are pub-lished or not. The documents may come from teaching and research institutions in France or abroad, or from public or private research centers.
L’archive ouverte pluridisciplinaire HAL, est destinée au dépôt et à la diffusion de documents scientifiques de niveau recherche, publiés ou non, émanant des établissements d’enseignement et de recherche français ou étrangers, des laboratoires publics ou privés.
Nature of the sites involved in the process of cesium
desorption from vermiculite
Liva Dzene, Emmanuel Tertre, Fabien Hubert, Eric Ferrage
To cite this version:
Liva Dzene, Emmanuel Tertre, Fabien Hubert, Eric Ferrage. Nature of the sites involved in the process of cesium desorption from vermiculite. Journal of Colloid and Interface Science, Elsevier, 2015, 455, pp.254-260. �10.1016/j.jcis.2015.05.053�. �hal-02325858�
1
Nature of the sites involved in the process of cesium desorption from
vermiculite
Liva Dzenea,*, Emmanuel Tertrea, Fabien Huberta and Eric Ferragea
a
Université de Poitiers/CNRS, UMR 7285 IC2MP, HydrASA, 5 rue Albert Turpain, Bât. B8, TSA - 51106, 86073 Poitiers cedex 9, France
*Author to whom correspondence should be addressed: Liva DZENE
Université de Poitiers/CNRS, UMR 7285 IC2MP, 5, Rue Albert Turpain, Bât. B8 – TSA 51106 86073 Poitiers cedex 9, France
Contact details: liva.dzene@univ-poitiers.fr, +33 (0)5 49 45 49 97
HIGHLIGHTS
- Distinct particle size fractions to probe the reactivity of different sorption sites on clay minerals
- Reversible sorption for external sites (basal and edge)
2
ABSTRACT
Three particle size fractions of sodium-saturated vermiculite (10-20, 1-2 and 0.1-0.2 µm), differing only in their ratios of external-to-total sorption sites, were used to probe the nature of the sites involved in desorption of cesium ions. The sorption was investigated for initial aqueous concentrations of cesium ranging from 5.6 × 10⁻⁴ to 1.3 × 10⁻² mol/L, and the cesium desorption was probed by exchange with ammonium ions. The results showed that (1) the amounts of desorbed cesium were strongly dependent on the particle size for a given initial aqueous cesium concentration and (2) the amounts of desorbed cations (Na+ and Cs+) strongly decreased with increasing initial cesium aqueous concentration, irrespective of the particle size investigated. Quantitative analysis of these results suggested that cesium ions sorbed on external (edge + basal) sorption sites can be desorbed by ammonium ions. As a contrast, most of cesium ions sorbed on interlayer sites remain fixed due to the collapse of the structure under aqueous conditions. This study provides important information, such as the nature of the sites involved in the exchange process, when the thermodynamic formalism is considered to describe the ion-exchange process involving cesium and high-charge swelling clay minerals in polluted soil environments.
KEYWORDS: Cesium desorption; vermiculite; particle size; high-charge swelling clay
3
1. INTRODUCTION
Accidents in nuclear power plants, such as those in Chernobyl (Ukraine) in 1986 and in Fukushima (Japan) in 2011, have led to dramatic cesium ion (Cs+) pollution in superficial geological compartments. The soil environment is indeed known to be an important sink of Cs+ [1-3] and several authors have demonstrated that swelling clay minerals in soils represent the main Cs+-bearing phases [4-6]. In this context, the refinement of reactive transport models is of prime importance to accurately predict the interaction between Cs+ and clay minerals, which, in turn, controls the potential release of this element into the surrounding environment. In the case of Cs+, the main chemical reactions included in these models are sorption/desorption processes because Cs+ does not generally precipitate as solid phases in natural environments. Thus, numerous studies have been devoted to the investigation of Cs+ sorption at both trace and major concentrations onto clay minerals [7-11]. The authors of these previous studies reported selectivity coefficients between Cs+ and most common major cations of natural waters (Na+, Ca2+, K+) for different types of sorption sites on clay minerals. From a thermodynamic viewpoint, these selectivity coefficients can be used to predict the long-term behavior of Cs+ under conditions where the reversibility of this cation-exchange process is ensured (see discussion in Tertre et al. [12]). Only a few groups have performed desorption experiments to assess the reversibility of Cs+ sorption onto soil clay minerals such as vermiculite and illite [13-15]. These studies confirmed the reversibility of the process when the initial Cs+ concentrations in solution ranged from 10-9 to 10-3 mol/L (scale of trace concentrations). However, the question regarding the reversibility of Cs+ sorption at higher Cs+ concentrations, i.e., when larger amounts of cation-exchange sites are involved in the desorption process, remains not fully understood. At such a major scale of cesium concentration, Kogure et al. [16] and Liu et al. [17] indeed demonstrated that Cs+ adsorbed onto vermiculite and illite was only partially exchangeable, regardless of the nature and
4
concentration of the cation used to desorb Cs+ (Al3+, [Co(NH3)6]3+, K+, Na+, Rb+ and NH4+).
In addition, these authors demonstrated that, at high Cs+ loadings, a fraction of these cations was intercalated between vermiculite layers and not easily exchangeable.
The present study was designed to provide a detailed picture of the different types of sorption sites (edge/basal and interlayer sites) involved in the reversible sorption of Cs+ onto vermiculite, a common swelling clay mineral in soil environments. For this purpose, we focus on three size-selected sodium (Na+)-saturated vermiculite particle fractions (i.e., 0.1-0.2, 1-2 and 10-20 µm) that are representative of the wide range of particle dimensions encountered in soil environments [18]. A previous study [19] reported the structural, chemical and morphological properties of the particles presented in the three size fractions selected in this study, and demonstrated that particles in these three size fractions exhibited the same crystal chemistry and differed only in their relative proportion of external versus total sites (Figure 1). Using these model systems with controlled amounts of different types of sites, we collected Cs+ sorption isotherms at major scales of initial aqueous Cs+ concentrations, and performed the subsequent desorption procedure using an NH4+ probe. On the basis of the
obtained results, we deduced that the nature of the sorption sites involved in the Cs+ sorption strongly influences the reversibility of the whole Cs+ sorption process.
2. MATERIALS AND METHODS
2.1. Size fractions of Santa Olalla vermiculite.
Natural vermiculite from Santa Olalla (Spain) was used as the raw material. Its structural formula is [(Mg2.54Fe0.25Al0.17Ti0.02Mn0.01)(Si2.75Al1.25)O10(OH)2](Na0.80) according to
Mareschal et al. [20]. The three size fractions used in our sorption experiments (i.e., 0.1-0.2, 1-2 and 10-20 µm) were obtained by sonication in water of large vermiculite crystals (1-4 mm) selected from the raw material using the procedure described by Reinholdt et al. [19].
5
These authors demonstrated that the structure and chemical composition did not vary between the three size fractions obtained after the sonication process. Using a suite of different microscopic techniques, the same authors derived a full morphological analysis of the particles in these different size fractions, leading to the calculation of the theoretical cation-exchange capacities related to the interlayer, edge and basal sites (Table 1). To obtain homoionic samples that allowed us to investigate single cation pair exchange (i.e., Cs+ -for-Na+ exchange), the three size fractions were fully saturated with Na+ and rinsed according to the procedure described by Bergaya and Lagaly [21].
2.2. Cation-exchange experiments.
An exchange isotherm between Na+ and Cs+ was performed using each of the three aforementioned Na+-saturated size fractions. First, thirteen or more experimental samples differing in their initial Cs+ and Na+ aqueous concentrations were obtained for each isotherm. The total concentration of aqueous cations for each experimental sample was 12.5 ± 1.0 × 10
-3
mol/L, leading to an initial Cs+ concentration range from 0 to 13 × 10-3 mol/L. For all of the experiments, 25 mg of Na+-saturated vermiculite was mixed with 7 mL of the solution, leading to a solid/solution ratio of 3.6 g/L. An example of the initial set of prepared samples for the 10-20 µm fraction is reported in Figure 2A. The initial aqueous concentrations and the associated Cs+/(Na++Cs+) ratios (from 0 to 1) are reported for all experiments and all size fractions in Table SI 1. After one week, the samples were centrifuged and the concentrations of Cs+ and Na+ in the solution were measured (Figure 2B). One week contact time was indeed shown to be sufficient to reach equilibrium for the similar material and physico-chemical conditions [22]. Additionally, the pH was measured to monitor the possible contribution of protons in the cation-exchange process. Amount of sorbed Cs+ on the solid after one week contact time was calculated from the difference between initial aqueous concentrations and
6
those measured after adsorption step (see Figure SI.1 for all size fractions). Then, in a second step, NH4+ was used to try to exchange sorbed Cs+ and Na+ for a period of one week by
addition of 7 mL of a 1 mol/L ammonium acetate solution to the clay slurry. To calculate the amounts of cations desorbed during this step, the concentrations of the species in the supernatants obtained after a new centrifugation cycle were measured (Figure 2C). The amounts of aqueous cations remaining in the clay slurries from the first step were taken into account in the calculations of the amounts of the desorbed cations according to a previously published method [23]. For these experiments, CsNO3 (99.99 %), NaNO3 (99.0 %), and
CH3COONH4 (extra pure) salts purchased from VWR® were used and the solutions were
prepared using Milli-Q® pure water (18 MΩ∙cm).
All of the aqueous cation concentrations were determined by atomic absorption spectroscopy (AAS, Varian AA240FS). The detection limits of AAS were 0.1 mg/L for Mg and 0.5 mg/L for both Na and Cs. Samples were diluted in 2 % HNO3 in order to measure aqueous
concentrations between 0. 5 and 5 mg/L corresponding to linear ranges of the calibration curves. To account for the possible interferences, 2 g/L KNO3 was added to the samples and
standards. The total uncertainties in the measured concentrations of all of the cations were estimated to be ±2 %. The pH (±0.01) was measured using a combined pH electrode (SCHOTT® Instruments) that was calibrated at 25 °C using two pH buffer solutions.
2.3. Crystal-structure analysis.
XRD analyses were performed using a Philips X’Pert Pro MPD diffractometer equipped with a Cu-Kα1,2 radiation source and an X'Celerator detector operated with an aperture of 0.51 °.
Two types of XRD patterns were recorded in the present study, depending on the method used to prepare the sample.
7
The first type of analysis was performed on oriented preparations to investigate the change in the interlayer composition during the cation-exchange process, as performed by Ferrage et al. [24] and Tertre et al. [25]. For these oriented preparations, an aliquot of the clay dispersion was dropped onto a glass slide and dried at room temperature. The XRD patterns were collected at 10 % relative humidity (RH) using a VTI RH-100 humidity generator device coupled to an Anton Paar THC chamber. Before the measurement, the sample was allowed to equilibrate for 20 min under this low-humidity condition. The scanning parameters were a 0.03 °2θ step size and a count time of 4 s per step over an angular range of 2-50 °2θ. The divergence slit, the anti-scatter slit and the two Soller slits were 0.125 °, 0.25 °, 2.3 ° and 2.3 °, respectively.
The second type of XRD pattern was recorded for the in situ analysis of the crystal structure of the clay particles directly in the dispersion. This analysis was performed for the 10-20 µm sample exchanged with Cs+. No drying was performed between the Cs+ sorption step and the acquisition of the XRD pattern. To record the pattern, a few microliters of the clay dispersion was introduced into a cylindrical glass capillary tube with internal diameter of 0.5 mm. The XRD patterns were recorded by equipping the diffractometer with a graded parabolic X-ray mirror incident beam optic module. For this setup, the divergence slit, the anti-scatter slit and the two Soller slits were 0.5 °, 0.5 °, 2.3 ° and 2.3 °, respectively. The patterns were recorded over the 3-45 °2θ angular range on rotating capillaries with scanning conditions of 0.03 °2θ and 20 s for the step size and counting time per step, respectively.
3. RESULTS AND DISCUSSION
3.1. Nature of the species involved in the cation-exchange processes.
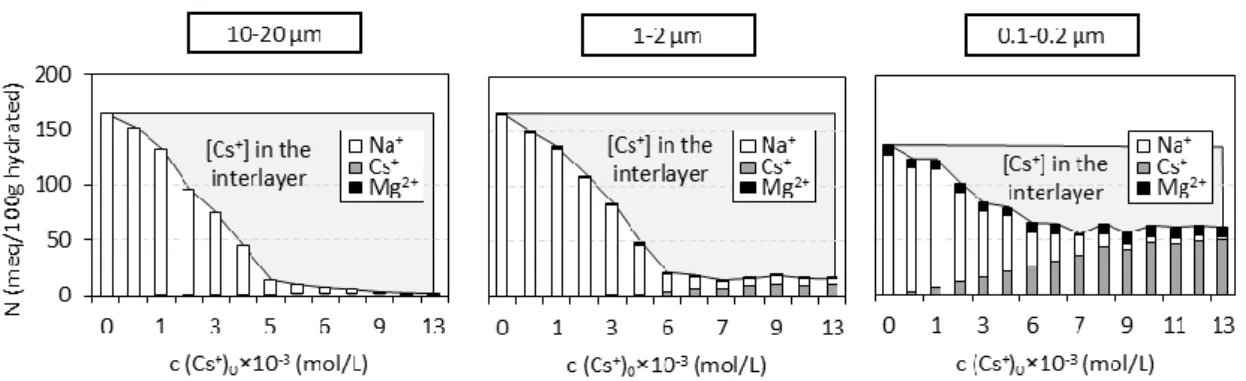
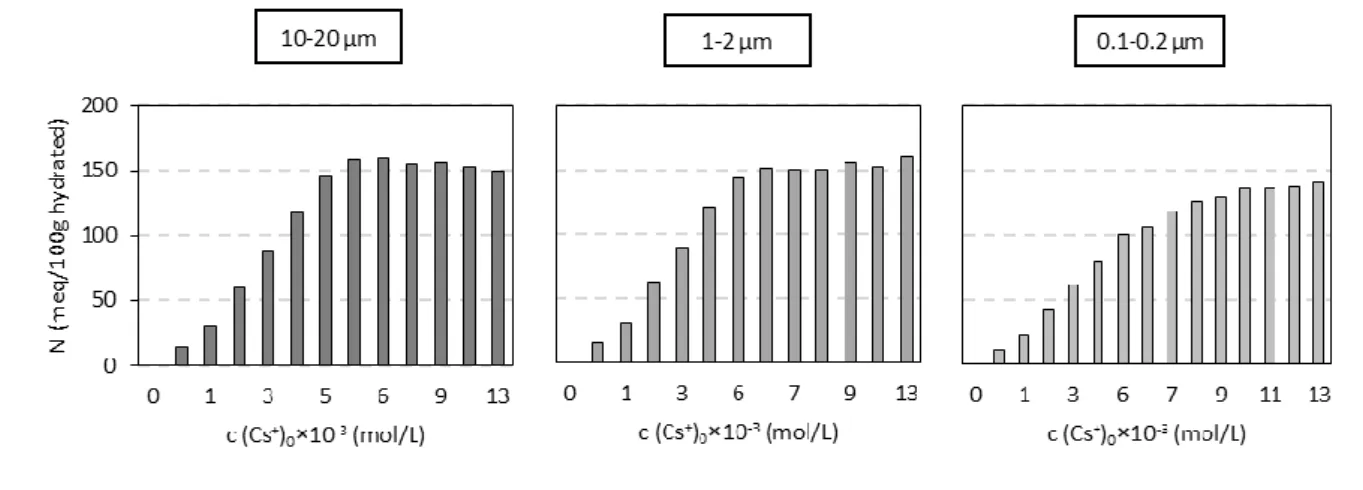
For the three size fractions investigated, Figure 3 shows the nature and amount of cations desorbed by NH4+ as a function of the initial concentration of Cs+ introduced into the solution.
8
Irrespective of the size fraction used, the amounts of cations desorbed by NH4+ decreased with
increasing initial aqueous Cs+ concentration. Moreover, the amounts of Cs+ desorbed (normalized to the mass of the hydrated solid) increased with decreasing size fraction for a given initial Cs+ concentration. For example, for an initial concentration of Cs+ of approximately 13 × 10-3 mol/L, the quantity of Cs+ desorbed was equal to 1, 13, and 53 meq/100 g for the 10-20, 1-2 and 0.1-0.2 µm size fractions, respectively. Additional tests were performed to check for potential insufficient contact time between the solid and the 1 mol/L NH4+ solution to explain the low amounts of desorbed Cs+ measured in our
experiments. Thus, a second cycle of a one-week time span in contact with the NH4+ solution
was performed. The increase of desorbed Cs+ reached 12 % in the case of very low concentrations of initial aqueous Cs+. For instance, in the case of the 0.1-0.2 µm fraction (for which the desorbed Cs+ was the most important), the amount of desorbed Cs+ increased from 2.1 to 2.4 meq/100 g when initial concentration of aqueous Cs+ was equal to 0.56 × 10
-3
mol/L. Notably, however, this increase was small in comparison to the overall number of sites involved in the cation exchange (128 meq/100 g). We could therefore confidently assume that the dramatic decrease of Cs+ desorbed with increasing initial concentration of Cs+ used to prepare the samples could not be interpreted by considering the kinetic contribution, irrespective of the size fraction investigated.
The pH of the solution was measured along the isotherm after the Cs+-for-Na+ exchange step and varied from 6.9 to 4.4, 6.9 to 6.0 and 8.1 to 7.1 for the 10-20, 1-2 and 0.1-0.2 µm size fractions, respectively (see Figure SI.2). These variations in pH values could appear significant; however, the associated amount of protons that could be involved during this Cs+ -for-Na+ exchange still remained negligible at this sample scale. Indeed, the maximum pH variation from 6.9 to 4.4 for the 10-20 µm size fraction could lead to a variation in the amount of desorbed protons equal to approximately 4 meq/100 g along the isotherm; this value can be
9
considered negligible compared to the total theoretical cation-exchange capacity (214 meq/100 g, Table 1). The difference in pH variation observed between the three size fractions likely resulted from the dissolution process, which cannot be avoided using tri-octahedral Mg-rich clays such as vermiculite. For the 0.1-0.2 µm size fraction, the measured pH values were consistent with those obtained at equilibrium for the dissolution of tri-octahedral mica, such as phlogopite at room temperature and neutral pH conditions [26]. Then for this size fraction, we considered that an equilibrium for the dissolution process was reached. By contrast, pH measured at the stationary state of the Cs+-for-Na+ exchange step for experiments performed with the coarsest particles (i.e., 10-20 µm) were close to the pH of pristine salt solutions used (i.e., CsNO3 and NaNO3 solutions, pH~5-6); such behavior leaded
us to assume that dissolution did not occur significantly during our experiments carried out with the 10-20 µm size fraction. For the intermediate size fraction (1-2 µm), pH variation measured along the Cs+-for-Na+ isotherm could result from both dissolution and H+ sorption processes. However, due to conclusions reported above for both the lowest (0.1-0.2 µm) and highest (10-20 µm) size fractions investigated, we assumed that such processes did not impact significantly the sorption/desorption of both Na+ and Cs+ from 1-2 µm particles.
Furthermore, the dissolution process was also monitored on the basis of the amount of Mg2+ desorbed by NH4+, which was especially large in the experiment performed with the lowest
size fraction (Figure 3). This phenomenon could also be responsible for the difference among the three size fractions with respect to the amounts of Na+ desorbed from the solids when no Cs+ was present in the system: 164, 166, and 128 meq/100 g for the 10-20, 1-2 and 0.1-0.2 µm fractions, respectively. Indeed, in the case of the 10-20 µm size fraction, for which dissolution was negligible, the value corresponded well to that reported by Reinholdt et al. [19] after correction for the water mass fraction in our sample (approximately 10 % at room humidity). In contrast, the values measured for the lowest size fractions (0.1-0.2 and 1-2 µm)
10
were lower than those reported by Reinholdt et al. [19]. This difference was attributed to the polymerization and fixation of Mg2+ in the interlayer space resulting from the mineral dissolution during the long saturation times of the different size fractions as observed by Rich [27] in alkaline soils containing Mg-rich clays such as vermiculite. The presence of such initial interlayer Mg2+ fixation. was also confirmed in the present study using XRD analysis, which revealed, for the two finest size fractions, a detectable proportion of layers with two water sheets in the interlayer space at 10 % relative humidity (RH) (data not shown). This hydration state was assigned to Mg2+-saturated interlayers because, at such a low RH value, Na+- and Cs+-saturated interlayers mainly exhibited a structure with one or zero water sheets in the interlayer, respectively [28, 29]. Note that, even though dissolution of vermiculite occurs during the sorption isotherm, especially for the finest fraction 0.1-0.2 µm ,the amount of Mg2+ measured for the finest size fraction after desorption step is nearly constant for all initial aqueous Cs+ concentrations (Figure 3). This likely indicates that the Mg2+ released competes with Na+ and Cs+ in a similar manner through the entire sorption isotherm and thus has a second-order influence on the overall Cs+-for-Na+ exchange.
3.2. Nature of the sites involved in the reversible part of Cs+ sorption.
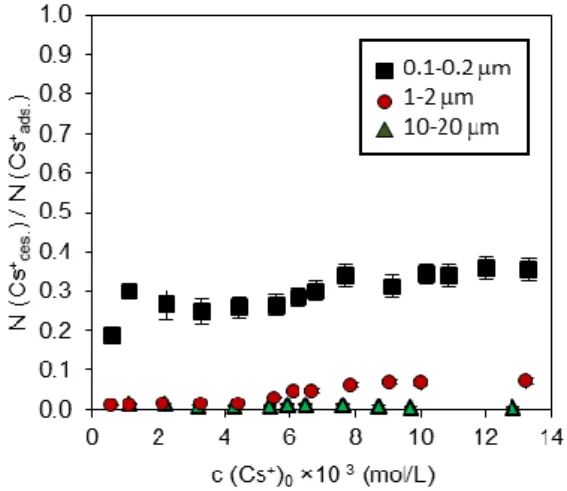
To assess the nature of the sites involved in the Cs+ desorption process, we calculated the ratio between the amount of Cs+ desorbed from and the amount of Cs+ adsorbed onto vermiculite (i.e., N(Cs+des.)/N(Cs+ads.)) as a function of the initial concentration of aqueous Cs+ and for the
different size fractions investigated (Figure 4). This ratio was observed to be nearly constant for high initial Cs+ concentrations (>8.0 × 10⁻³ mol/L) and approximately 0.34 ± 0.07, 0.06 ± 0.01 and 0.01 ± 0.002 for the 0.1-0.2, 1-2 and 10-20 µm size fractions, respectively. As reported in Table 2, these values were comparable to the ratios between the external sites (i.e., calculated as the sum of edge and basal sites) and the total number of sites calculated from the
11
morphological study performed by Reinholdt et al. [19]. This result likely indicates that Cs+ desorbed by NH4+ is solely attributable to Cs+ sorbed on the external (i.e., edge/basal) sites.
Our findings can be compared to the results of Fan et al. [30], who reported that the ratio between inner sphere Cs+ and the sum of inner and outer sphere Cs+ for vermiculite is approximately 0.8. The authors do not report the average size of the particles of their material, but if outer sphere Cs+ could be attributable to Cs+ adsorbed on the external sites, then our results are rather in agreement with their data.
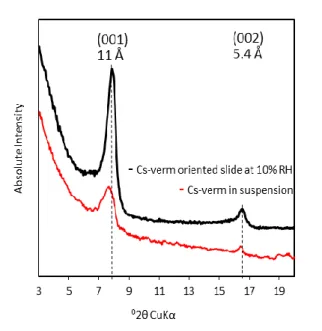
To confirm this interpretation, additional structural XRD analyses were performed. This technique is indeed only sensitive to the cation-exchange process that affects interlayer sites [24, 25]. For this reason, any difference between the XRD pattern obtained for Cs+-saturated vermiculite and that of the same sample after NH4+ exchange (in both positions and/or
intensities of (00ℓ) reflections) would indicate that a part of the original interlayer Cs+ had been deintercalated. This XRD analysis was performed on oriented samples for the three size fractions. In Figure 5, the XRD patterns of the Cs+-saturated samples are compared with the patterns of their NH4+ counterparts (Cs+-verm. and NH4+-verm., respectively, Figure 5); this
latter pattern was obtained after NH4+ exchange of the original Na+-saturated specimens.
Although Cs+- and NH4+-saturated samples exhibited similar d001 values of approximately to
11 Å at 10 % RH, the intensities of the (00ℓ) reflections, and especially that of the first order, differed drastically. Because special attention was given here to prepare and analyze the samples in the same way (i.e., same sample mass, length and same sample preparation method and XRD acquisition parameters), change in relative (00ℓ) intensities for two structures with similar d001 value can be attributed to the modification of the structure factor. The latter factor
relates to the amount and nature of elements present in the structure. As far as Cs+ and NH4+
saturated samples are concerned, such modification in the structure factor thus relates to the change in the interlayer electronic density between the Cs+ and NH4+ cations [31]. NH4+
12
indeed holds 10 e-, against 54 e- for Cs+. In the case of Cs+, the high electronic density in the interlayer mid-plane of the crystal structure was likely responsible of the significant decrease of the intensity of the (001) reflection (Figure 5). This difference was, in turn, particularly efficient for detecting the potential interlayer NH4+-for-Cs+ exchange in vermiculite. Both the
Cs+-verm. and NH4+-verm. reference XRD patterns were then compared to the XRD profile
obtained for the sample characterized by the largest amount of sorbed Cs+ and then exchanged with NH4+ (i.e., the Cs+/NH4+-verm. samples, Figure 5). For the two coarser fractions (i.e., 1-2
and 10-20 µm), the Cs+/NH4+-verm. patterns were superimposed with that of the Cs+-verm.
samples (Figure 5). The superimposition of these patterns indicated that i) the interlayer was not impacted by the desorption of Cs+ cations and ii) the amounts of desorbed Cs+ measured during the exchange step with NH4+ (Figure 3) could be confidently attributed to the
desorption of Cs+ from the external surfaces. With respect to the 0.1-0.2 µm size fraction, the XRD pattern showed an increase of the intensity of the (001) reflection, suggesting that a fraction of the interlayer sites was affected during the desorption step. This result explains the slightly higher N(Cs+des.)/N(Cs+ads.) ratio for this size fraction compared to the theoretical ratio
derived from the morphological analysis (Table 2).
3.3. Structural control of the reversible part of Cs+ sorption in vermiculite.
Our results showed that Cs+ could be desorbed from external sites using NH4+, whereas the
desorption from the interlayer sites was limited or null for the three investigated size fractions of vermiculite. The present results were fully consistent with the results of previous studies dealing with trace Cs+ concentrations on high-charge clay minerals such as vermiculite and illite [14, 15]. In these previous studies, the low Cs+ concentration of 10-9 to 10-3 mol/L in solution implied that no more than 5 % of the total cation-exchange capacity of the material was probed with Cs+. The observations made by the authors regarding the significant
13
proportion of Cs+ that could be desorbed is consistent with Cs+ sorption being limited to the external sites of particles at trace concentrations. Our results were also fully consistent with the results of previous studies on vermiculite and illite at higher Cs+ loadings [7, 16, 17]. In particular, the present study provides strong evidence for the fact that interlayer sorption is responsible of the incomplete reversibility of Cs+ sorption on clay minerals. Kogure et al. [16] and Fuller et al. [32] used transmission electron microscopy to explain that this interlayer “fixation” of Cs+
results from the dehydrated state of sorbed Cs+ in high-charge clay interlayers. Notably, however, these previous results were obtained using dried samples, thereby leaving the question regarding the hydration state of the Cs+ during its sorption under water-saturated conditions unanswered. To provide additional insight into the implied Cs+ sorption mechanism, we performed an XRD study to assess the interlayer structure during the sorption of Cs+ under water-saturated conditions. To do so, an aliquot of the Na+-saturated 10-20 µm size fraction was Cs+-saturated and subsequently analyzed using XRD directly in the dispersion, i.e., without any drying step. The pattern is reported in Figure 6, where it is also compared with the XRD profile obtained for the same sample with oriented preparation and after equilibration at 10 % RH. As evident in Figure 6, both patterns exhibited similar positions for the (00ℓ) reflections, with a d001 spacing of approximately 11 Å, which
corresponds to the presence of dehydrated cesium in the interlayer space. Thus, this analysis highlighted that the Cs+-for-Na+ exchange is associated under aqueous conditions with a reduction of the interlayer space of vermiculite by dehydration of intercalated Cs+. In turn, this dehydrated state was likely the main cause of the immobility of the interlayer Cs+ and the origin of the very small amounts of desorbed Cs+ measured via exchange with NH4+.
14
In the present study, the sorption sites of vermiculite saturated with Cs+ that can be desorbed afterwards with NH4+ were mainly sites located on the external surfaces of the particles. This
result indicates that the use of a thermodynamic formalism to predict Cs+ migration in natural media is particularly complicated by the contrasted behaviors of external and interlayer sorption sites towards this cation. As a consequence, the prediction of the sorption and desorption process of Cs+ is not a trivial exercise in complex mineralogical assemblages, such as soils, that contain high-charge swelling clay minerals. For this type of environment, more information about the distribution of different types of sorption sites, which implies an improved characterization of the particle size and shape distribution, is required in order to use sorption formalisms describing reversible process. In the specific case of soils, this information is likely to be extremely difficult to obtain because of the wide range of particle dimensions encountered in these environments [18]. Moreover, swelling clay minerals from soils likely exhibit a wide range of layer charge [33]. Additional investigations would then be necessary to assess the role played by the crystal chemistry (localization and amount of layer charge) on the interlayer fixation of Cs+ shown in the present study. This additional information would help to constrain the prediction of Cs+ migration in soils.
4. CONCLUSION
In this study, we were interested to research a possible difference of reactivity between the various types of sorption sites (external and interlayer) located on swelling clay particles during Cs+-for-Na+ exchange. Our approach consisted of using three different particle size fractions obtained by sonication of single large vermiculite crystals. Such method allowed us to use clay particles of different size but having the same structure and chemical composition and differing only by their proportions of external over total sorption sites. This approach is different from that generally used [11, 17], which consists to extract different clay mineral
15
size fractions from complex mineralogical assemblages, as soils; such procedure leading to materials differing in most of the cases by their mineralogy and chemical composition.
We have observed that the amount of desorbed cesium can be correlated to the ratio between external and total number of sites present on vermiculite. The proportion of desorbed cesium was the highest for the 0.1-0.2 µm size fraction (34 % of the initially adsorbed Cs+) which is in the same order of magnitude as that of external sites for this material (i.e., 27 %). In turn, Cs+ adsorbed in the interlayer of the vermiculite particles was poorly exchangeable because of the collapse of the interlayer during Cs+-for-Na+ exchange in aqueous medium. A process which has been previously proposed in literature [7, 16] but not demonstrated in aqueous medium. In future, we would like to assess the impact of the clay crystal chemistry (localization and amount of layer charge) on Cs+ desorption from swelling clay minerals to improve the knowledge of the parameters governing the mobility of Cs+ in soils.
SUPPORTING INFORMATION
The initial aqueous concentrations and the associated Cs+/(Na++Cs+) ratios (from 0 to 1) are reported for all experiments and all size fractions in Table SI 1. Figure SI.1 represents the amount of sorbed Cs+ on the solid after sorption step for the three vermiculite size fractions as a function of initial aqueous concentrations of Cs+. The pH values measured after Cs+-for-Na+ exchange on the three vermiculite size fractions and for the different initial aqueous concentrations of Cs+ investigated are given in Figure SI.2. This material is available free of charge via the Internet at http://www.sciencedirect.com/.
16
The authors gratefully acknowledge Jacques Ranger for kindly providing the vermiculite samples used in this study. The results presented are part of the PhD thesis of Liva Dzene at the University of Poitiers granted by the Ministère de l’enseignement supérieur et de la recherche, France. The CNRS interdisciplinary “défi Needs”, through its “MiPor” program is thanked for the financial support provided to the present study (Project MPDYN).
REFERENCE LIST
[1] E.J. Mcgee, H.J. Synnott, K.J. Johanson, B.H. Fawaris, S.P. Nielsen, A.D. Horrill, V.H. Kennedy, N. Barbayiannis, D.S. Veresoglou, D.E. Dawson, P.A. Colgan, A.T. Mcgarry, 48 (2000) 59.
[2] F. Strebl, M.H. Gerzabek, P. Bossew, K. Kienzl, Sci. Total Environ. 226 (1999) 75. [3] S. V Avery, J. Environ. Radioact. 30 (1996) 139.
[4] J. Akai, N. Nomura, S. Matsushita, H. Kudo, H. Fukuhara, S. Matsuoka, J. Matsumoto, Phys. Chem. Earth, Parts A/B/C 58 (2013) 57.
[5] H. Qin, Y. Yokoyama, Q. Fan, H. Iwatani, K. Tanaka, A. Sakaguchi, Y. Kanai, J. Zhu, Y. Onda, Y. Takahashi, Geochem. J. 46 (2012) 297.
[6] P. Misaelides, C. Sikalidis, R. Tsitouridou, C. Alexiades, Environ. Pollut. 47 (1987) 1. [7] B.L. Sawhney, Clays Clay Miner. 20 (1972) 93.
[8] E. Brouwer, B. Baeyens, A. Maes, A. Cremers, J.Phys.Chem. 87 (1983) 1213. [9] R.M. Cornell, J. Radioanal. Nucl. Chem. Artic. 171 (1993) 483.
[10] M.H. Bradbury, B. Baeyens, J. Contam. Hydrol. 42 (2000) 141.
[11] A. de Koning, A.V. Konoplev, R.N.J. Comans, Appl. Geochemistry 22 (2007) 219. [12] E. Tertre, J. Page, C. Beaucaire, Environ. Sci. Technol. 46 (2012) 10055.
[13] R. N.J. Comans, M. Haller, P. De Preter, Geochim. Cosmochim. Acta 55 (1991) 433. [14] A. de Koning, R.N.. Comans, Geochim. Cosmochim. Acta 68 (2004) 2815.
17
[15] K. Morimoto, T. Kogure, K. Tamura, S. Tomofuji, A. Yamagishi, H. Sato, Chem. Lett. 41 (2012) 1715.
[16] T. Kogure, K. Morimoto, K. Tamura, H. Sato, A. Yamagishi, Chem. Lett. 41 (2012) 380.
[17] C. Liu, J.M. Zachara, S. Smith, J. Mckinley, C. Ainsworth, Geochim. Cosmochim. Acta 67 (2003) 2893.
[18] F. Hubert, L. Caner, A. Meunier, E. Ferrage, Am. Mineral. 97 (2012) 384.
[19] M.X. Reinholdt, F. Hubert, M. Faurel, E. Tertre, A. Razafitianamaharavo, G. Francius, D. Prêt, S. Petit, E. Béré, M. Pelletier, E. Ferrage, Appl. Clay Sci. 77-78 (2013) 18.
[20] L. Mareschal, J. Ranger, M.P. Turpault, Geochim. Cosmochim. Acta 73 (2009) 307. [21] F. Bergaya, G. Lagaly, in:, F.B. and G.L.B.T.-D. in C. Science (Ed.), Handb. Clay Sci. Fundam., Elsevier, 2013, pp. 213–221.
[22] E. Tertre, F. Hubert, S. Bruzac, M. Pacreau, E. Ferrage, D. Prêt, Geochim. Cosmochim. Acta 112 (2013) 1.
[23] E. Tertre, D. Prêt, E. Ferrage, J. Colloid Interface Sci. 353 (2011) 248.
[24] E. Ferrage, C. Tournassat, E. Rinnert, B. Lanson, Geochim. Cosmochim. Acta 69 (2005) 2797. DOI: 10.1016/j.gca.2004.12.008.
[25] E. Tertre, E. Ferrage, I. Bihannic, L.J. Michot, D. Prêt, J. Colloid Interface Sci. 363 (2011) 334. DOI: 10.1016/j.jcis.2011.07.003.
[26] S.D. Samson, K.L. Nagy, W.B. Cotton III, Geochim. Cosmochim. Acta 69 (2005) 399. DOI: 10.1016/j.gca.2004.07.005.
[27] C.I. Rich, Clays Clay Miner. 16 (1968) 15.
[28] C. de la Calle, H. Suquet, in: S.W. Bailey (Ed.), Hydrous Phyllosilicates (Exclusive of Micas), 19th ed., Mineralogical Society of America, Madison, Wisconsin, USA, 1988, pp. 455 – 496.
18
[29] T. Melkior, E.C. Gaucher, C. Brouard, S. Yahiaoui, D. Thoby, C. Clinard, E. Ferrage, D. Guyonnet, C. Tournassat, D. Coelho, J. Hydrol. 370 (2009) 9. DOI: 10.1016/j.jhydrol.2009.02.035
[30] Q. Fan, N. Yamaguchi, M. Tanaka, H. Tsukada, Y. Takahashi, J. Environ. Radioact. 138 (2014) 92.
[31] E. Ferrage, C. Tournassat, E. Rinnert, L. Charlet, B. Lanson, Clays Clay Miner. 53 (2005) 348. DOI: 10.1346/CCMN.2005.0530403
[32] A.J. Fuller, S. Shaw, M.B. Ward, S.J. Haigh, J.F.W. Mosselmans, C.L. Peacock, S. Stackhouse, A.J. Dent, D. Trivedi, I.T. Burke, Appl. Clay Sci. 108 (2015) 128. DOI: 10.1016/j.clay.2015.02.008
[33] M.B. McBride, in: J.B. Dixon, S.B. Weed (Eds.), Miner. Soil Environ., Soil Science Society of America, Madison, 1989, pp. 35–88.
19
Tables
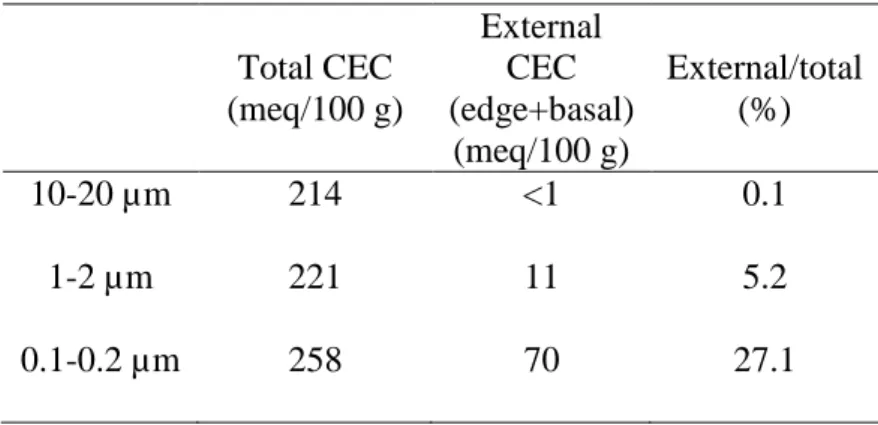
Table 1. Theoretical cation-exchange capacity (CEC) values relative to the different types of sorption sites for the different vermiculite size fractions (from Reinholdt et al. [19]).
Total CEC (meq/100 g) External CEC (edge+basal) (meq/100 g) External/total (%) 10-20 µm 214 <1 0.1 1-2 µm 221 11 5.2 0.1-0.2 µm 258 70 27.1
Table 2. Comparison between the relative proportions of external (edge+basal) sorption sites and total sorption sites (from the theoretical study of Reinholdt et al. [19]) and the ratios between the amounts of Cs+ desorbed with NH4+ and the total amount of sorbed Cs+ obtained
in this study for the three size fractions of vermiculite.
10-20 µm 1-2 µm 0.1-0.2 µm Nexternal/Ntotal <1 % 5 % 27 %
20
Figure captions
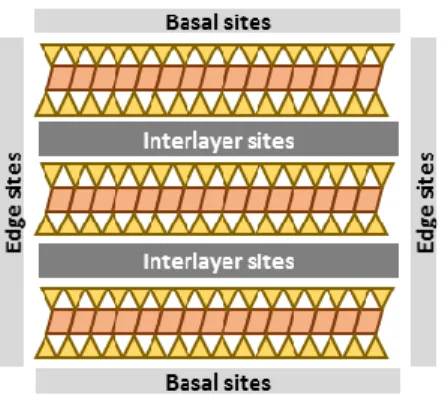
Figure 1: Schematic representation of the different types of sorption sites on vermiculite particles.
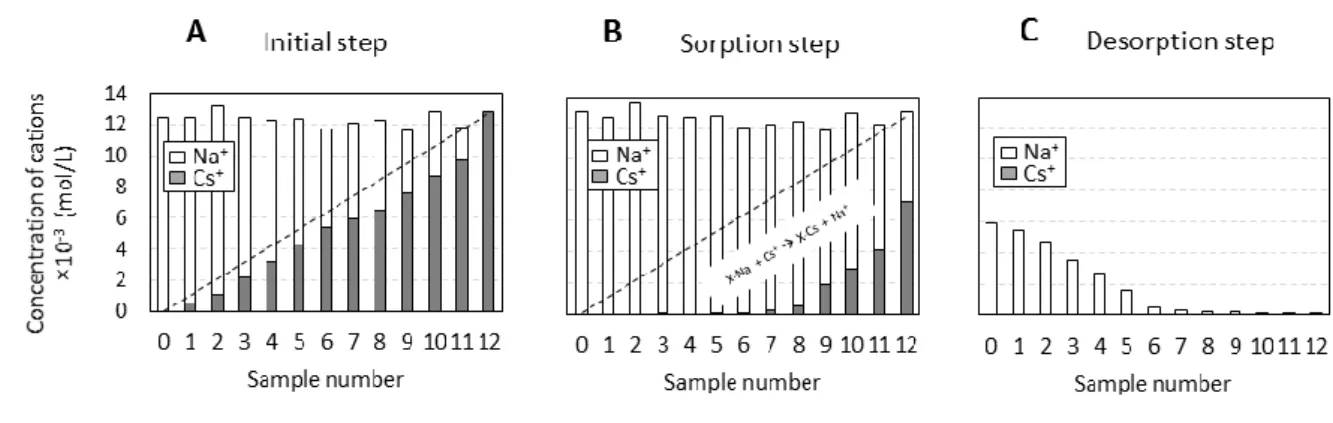
Figure 2: Example of the aqueous cation concentrations used in the different steps of the exchange experiment: (A) initial step, (B) sorption step and (C) desorption step. The data are reported for the thirteen samples prepared for the experiments carried out with the 10-20 µm size fraction.
Figure 3: Concentrations of cations N (Na+, Cs+, Mg2+) desorbed by 1 mol/L NH4+ from the
solid samples as a function of the initial concentration of aqueous Cs+. The data are reported for the three size fractions investigated. The gray zones represent the amount of fixed Cs+ (not desorbed by NH4+).
Figure 4: Ratios between the amount of Cs+ desorbed with NH4+ and the amount of sorbed
Cs+ plotted as a function of the initial concentration of aqueous Cs+.
Figure 5: Comparison of the X-ray diffraction patterns recorded for Cs+- and NH4+-saturated
samples (Cs+-verm. and NH4+-verm.) for the three size fractions and the sample characterized
by the highest amount of sorbed Cs+ and exchanged with NH4+ (NH4+/Cs+-verm.). The
vertical gray bars indicate a modified intensity scale in the high-angle region as compared to the 2-14°2 angular range.
Figure 6: Comparison of the XRD patterns of the Cs+-saturated 10-20 µm size fraction recorded on an oriented slide equilibrated at 10 % relative humidity (solid black line) and on a
21
glass capillary containing particles in dispersion that were never dried after Cs+ saturation (solid red line).
22
Figures
All figures are intended for colour reproduction online only.
Figure 1 Schematic representation of the different types of sorption sites on vermiculite
23
Figure 2 Example of the aqueous cation concentrations used in the different steps of the
exchange experiment: (A) initial step, (B) sorption step and (C) desorption step. The data are reported for the thirteen samples prepared for the experiments carried out with the 10-20 µm size fraction.
24
Figure 3 Concentrations of cations N (Na+, Cs+, Mg2+) desorbed by 1 mol/L NH4+ from the
solid samples as a function of the initial concentration of aqueous Cs+. The data are reported for the three size fractions investigated. The grey zones represent the amount of fixed Cs+ (not desorbed by NH4+).
25
Figure 4 Ratios between the amount of Cs+ desorbed with NH4+ and the amount of sorbed
26
Figure 5 Comparison of the X-ray diffraction patterns recorded for Cs+- and NH4+-saturated
samples (Cs+-verm. and NH4+-verm.) for the three size fractions and the sample characterized
by the highest amount of sorbed Cs+ and exchanged with NH4+ (NH4+/Cs+-verm.). The
vertical gray bars indicate a modified intensity scale in the high-angle region as compared to the 2-14°2 angular range.
27
Figure 6 Comparison of the XRD patterns of the Cs+-saturated 10-20 µm size fraction recorded on an oriented slide equilibrated at 10 % relative humidity (solid black line) and on a glass capillary containing particles in dispersion that were never dried after Cs+ saturation (solid red line).
28
29
Table SI.1 The initial aqueous concentrations and the associated Cs+/(Na++Cs+) ratios (from 0 to 1) for all size fractions.
0.1-0.2 µm Sample number 0 1 2 3 4 5 6 7 8 9 10 11 12 13 14 c (Na+)0 × 10-3 (mol/L) 12.68 12.06 11.62 10.42 9.39 8.15 7.54 6.55 6.04 4.96 3.67 2.94 1.79 0.79 0.00 c (Cs+)0 × 10-3 (mol/L) 0.00 0.56 1.12 2.25 3.33 4.47 5.60 6.26 6.81 7.72 9.13 10.16 10.87 12.00 13.30 Cs+/(Na++Cs+) 0.00 0.04 0.09 0.18 0.26 0.35 0.43 0.49 0.53 0.61 0.71 0.78 0.86 0.94 1.00 1-2 µm Sample number 0 1 2 3 4 5 6 7 8 9 10 11 12 c (Na+)0 × 10-3 (mol/L) 12.44 11.95 12.32 9.74 9.25 8.20 6.40 6.23 5.84 4.05 3.54 2.36 0.00 c (Cs+)0 × 10-3 (mol/L) 0.00 0.57 1.13 2.13 3.29 4.44 5.56 6.11 6.69 7.88 9.05 10.00 13.23 Cs+/(Na++Cs+) 0.00 0.05 0.08 0.18 0.26 0.35 0.46 0.49 0.53 0.66 0.72 0.81 1.00 10-20 µm Sample number 0 1 2 3 4 5 6 7 8 9 10 11 12 c (Na+)0 × 10-3 (mol/L) 12.42 11.88 12.13 10.27 9.09 8.07 6.32 6.12 5.78 3.96 4.13 2.13 0.00 c (Cs+)0 × 10-3 (mol/L) 0.00 0.55 1.09 2.19 3.20 4.31 5.38 5.92 6.48 7.62 8.72 9.69 12.79 Cs+/(Na++Cs+) 0.00 0.04 0.08 0.18 0.26 0.35 0.46 0.49 0.53 0.66 0.68 0.82 1.00
30
Figure SI.1 Amount of sorbed Cs+ on the solid after sorption step for the three vermiculite size fractions as a function of initial aqueous concentrations of Cs+.
Figure SI.2 The pH values measured after Cs+-for-Na+ exchange on the three vermiculite size fractions and for the different initial aqueous concentrations of Cs+ investigated.

![Risiko- & [und] Schutzfaktoren der psychischen Gesundheit humanitärer Einsatzhelfer : eine systematische Literaturübersicht](data:image/gif;base64,R0lGODlhAQABAIAAAP///wAAACH5BAEAAAAALAAAAAABAAEAAAICRAEAOw==)