HAL Id: hal-00318237
https://hal.archives-ouvertes.fr/hal-00318237
Submitted on 21 Dec 2006
HAL is a multi-disciplinary open access
archive for the deposit and dissemination of
sci-entific research documents, whether they are
pub-lished or not. The documents may come from
teaching and research institutions in France or
abroad, or from public or private research centers.
L’archive ouverte pluridisciplinaire HAL, est
destinée au dépôt et à la diffusion de documents
scientifiques de niveau recherche, publiés ou non,
émanant des établissements d’enseignement et de
recherche français ou étrangers, des laboratoires
publics ou privés.
radar and auroral observations
A. Grocott, M. Lester, M. L. Parkinson, T. K. Yeoman, P. L. Dyson, J. C.
Devlin, H. U. Frey
To cite this version:
A. Grocott, M. Lester, M. L. Parkinson, T. K. Yeoman, P. L. Dyson, et al.. Towards a synthesis
of substorm electrodynamics: HF radar and auroral observations. Annales Geophysicae, European
Geosciences Union, 2006, 24 (12), pp.3365-3381. �hal-00318237�
www.ann-geophys.net/24/3365/2006/ © European Geosciences Union 2006
Annales
Geophysicae
Towards a synthesis of substorm electrodynamics: HF radar and
auroral observations
A. Grocott1, M. Lester1, M. L. Parkinson2, T. K. Yeoman1, P. L. Dyson2, J. C. Devlin3, and H. U. Frey4 1Department of Physics & Astronomy, University of Leicester, Leicester LE1 7RH, UK
2Department of Physics, La Trobe University, Victoria 3086, Australia
3Department of Electronic Engineering, La Trobe University, Victoria 3086, Australia 4Space Sciences Laboratory, University of California Berkeley, Berkeley, CA 94720, USA
Received: 13 July 2006 – Revised: 27 November 2006 – Accepted: 30 November 2006 – Published: 21 December 2006
Abstract. At 08:35 UT on 21 November 2004, the onset of
an interval of substorm activity was captured in the south-ern hemisphere by the Far UltraViolet (FUV) instrument on board the IMAGE spacecraft. This was accompanied by the onset of Pi2 activity and subsequent magnetic bays, ev-ident in ground magnetic data from both hemispheres. Fur-ther intensifications were then observed in both the auroral and ground magnetic data over the following ∼3 h. Dur-ing this interval the fields-of-view of the two southern hemi-sphere Tasman International Geospace Enviroment Radars (TIGER) moved through the evening sector towards mid-night. Whilst initially low, the amount of backscatter from TIGER increased considerably during the early stages of the expansion phase such that by ∼09:20 UT an enhanced dusk flow cell was clearly evident. During the expansion phase the equatorward portion of this flow cell developed into a narrow high-speed flow channel, indicative of the auroral and sub-auroral flows identified in previous studies (e.g. Freeman et al., 1992; Parkinson et al., 2003). At the same time, higher latitude transient flow features were observed and as the in-terval progressed the flow reversal region and Harang dis-continuity became very well defined. Overall, this study has enabled the spatial and temporal development of many dif-ferent elements of the substorm process to be resolved and placed within a simple conceptual framework of magneto-spheric convection. Specifically, the detailed observations of ionospheric flows have illustrated the complex interplay be-tween substorm electric fields and associated auroral dynam-ics. They have helped define the distinct nature of different substorm current systems such as the traditional substorm current wedge and the more equatorward currents associ-ated with polarisation electric fields. Additionally, they have
Correspondence to: A. Grocott
(a.grocott@ion.le.ac.uk)
revealed a radar signature of nightside reconnection which provides the promise of quantifying nightside reconnection in a way which has already proved extremely successful in studies of the dayside magnetosphere.
Keywords. Ionosphere (Plasma convection) –
Magneto-spheric physics (Auroral phenomena; Magnetosphere-ionosphere interactions)
1 Introduction
Magnetospheric substorms are a major contributing factor to large-scale magnetosphere-ionosphere dynamics and give rise to some of the most significant auroral and magneto-spheric disturbances that occur in the terrestrial system. As a consequence they have been extensively studied over the past 40 years and many aspects of their large-scale behaviour have been very well described. The earliest observations of sub-storms were, of course, of the auroral breakup although the idea of the auroral substorm was not conceived until Akasofu (1963, 1964) developed his picture of the auroral morphol-ogy. At about the same time, substorm magnetic signatures and their implied current systems were identified (Bostrom, 1964; Akasofu et al., 1965; Atkinson, 1967; Akasofu, 1968; Akasofu and Meng, 1969), although it was not until the ad-vent of satellite data that the 3-D nature of the substorm cur-rent wedge was visualised (McPherron et al., 1973). In the years since, the increasing availability of space-borne agery and in-situ magnetospheric observations has vastly im-proved our ability to study the spatial and temporal dynam-ics of the aurora (e.g. Elphinstone et al., 1996 and references therein) as well as to understand their associated magneto-spheric phenomena (e.g. McPherron et al., 1973; Akasofu,
1977; McPherron, 1979, 1991; Hones, 1979; Baker et al., 1984).
Early studies of substorm current systems, such as those mentioned above, identified two distinct patterns of iono-spheric currents (e.g. Clauer and Kamide, 1985). The first of these, referred to as DP-2 (disturbance polar of the second type), corresponds to the twin-vortex current pattern driven by magnetospheric convection, and the resulting eastward and westward convection electrojets in the dawn and dusk au-roral zones. McPherron (1970) interpreted this current sys-tem as being created by a substorm growth phase in which energy extracted from the solar wind is stored in the netosphere. During this interval an enhancement in mag-netospheric and ionospheric convection, being driven by re-connection at the dayside magnetopause, causes an increase in the size of the polar cap and a growth in the convection electrojets. The second pattern, DP-1, corresponds to the ionospheric portion of the substorm current wedge and takes the form of an enhanced westward current in the midnight sector auroral zone called the substorm electrojet (Akasofu et al., 1965). This current system is governed by enhance-ments in conductivity rather than in the electric field (Lester, 2000), a fact which has spawned considerable debate over the magnitude and physical implications of electric fields during the substorm expansion phase. Increasingly, however, direct studies of convection during the expansion phase (such as those made using HF radars, for example) are revealing more about the significance of magnetospheric electric fields in the overall nature of substorm electrodynamics, as we discuss below.
One area of recent advancement in our understanding of convection processes during the substorm expansion phase concerns the large-scale reconfiguration of the magneto-sphere. In a study of Sondrestrom radar data, Blanchard et al. (1997) (following earlier work by de la Beaujardi`ere et al. (1991) and Blanchard et al. (1996)) measured the local reconnection rate by examining the ionospheric flow across the open-closed field line boundary, the position of the lat-ter being estimated from ionospheric features observed by the radar and from 630 nm auroral emissions. They found that an increase in the reconnection rate occurs near midnight shortly after expansion phase onset, expanding to encompass a wider local time sector after ∼20 min. However, the ini-tial reconnection rate increase was mainly manifest in a pole-ward motion of the inferred open-closed field line boundary. Flows were found to become elevated only after an inter-val of ∼30 min. Somewhat correspondingly, Weimer (1999) has presented a statistical survey of low-altitude electric field data from the DE–2 spacecraft, separated according to the IMF direction and into substorm and non-substorm inter-vals. The flow patterns for a given IMF orientation show a more pronounced “Harang” asymmetry on the nightside dur-ing substorm intervals than durdur-ing non-substorm intervals, but the total transpolar voltage values showed little over-all difference. On the other hand, Opgenoorth and
Pelli-nen (1998), following earlier work by Grafe et al. (1987), have presented evidence for flow enhancements in the dusk auroral zone immediately following expansion phase onset in the midnight sector, leading to an immediate increase in the global convection-driven current system. They suggest, however, that diversion of the twin-vortex flow around the low-flow, high-conductivity auroral bulge formed during the expansion phase (e.g. Kirkwood et al., 1988; Morelli et al., 1995; Yeoman et al., 2000; Bristow et al., 2001; Khan et al., 2001), may play a role in this enhancement.
Cowley and Lockwood (1992) (following earlier work on boundary motions and flows presented by Russell (1972), Siscoe and Huang (1985) and Freeman and Southwood (1988)) supposed that significant large-scale twin-vortex flows should be excited during substorms, corresponding in essence to the DP-2 current systems associated with dayside-driven convection cited above. Fox et al. (1999) reported observations of a surge of transpolar flow into the midnight sector associated with a substorm intensification, which they suggest was due to a burst of reconnection in the tail. Gro-cott et al. (2000, 2002) presented analyses of Super Dual Auroral Radar Network (SuperDARN) flow data obtained during isolated substorms, and have found evidence for the excitation of twin-vortex flow cells centred in the night-side ionosphere, which enhance the transpolar voltage by ∼40 kV compared with pre-onset values. Following this work, Provan et al. (2004) conducted a statistical study of substorm flows and found them to become enhanced across the polar cap and in the low-latitude return flow region. They also found a systematic increase in the transpolar voltage from ∼40 kV 2 min before onset to ∼75 kV 12 min after, and attributed this to the removal of open flux from the polar cap by nightside reconnection. Recently, Liang et al. (2006) (fol-lowing earlier work by Kamide et al. (1994)) discussed ob-servations of two distinct systems in the substorm convection pattern. The first is a post-midnight anticlockwise convection vortex (PoACV) at higher latitudes and the second is an az-imuthally extended clockwise vortex at lower latitudes. They explain these in terms of a combination of the nightside re-connection driven twin-vortex flows and those resulting from field line slippage processes associated with dipolarisation (Lui and Kamide, 2003).
Whilst it is thus becoming clear that large-scale electric fields play a significant role in the electrodynamics of the substorm expansion phase, it is also apparent that mesoscale phenomena are integral to the substorm process. For ex-ample, azimuthally-localised impulsive events have been ob-served in which auroras are first intensified at the poleward boundary of the nightside auroral zone, and then expand equatorward, reaching to near the equatorward boundary of the oval emissions after ∼5 min (Henderson et al., 1998). These events, termed “poleward boundary intensifications” (PBIs) by Lyons et al. (1999), have been found to occur in all phases of the substorm cycle, including during long in-tervals of magnetic quiet, though they appear to be more
frequent during substorm expansion phases. They are associ-ated with azimuthally-localised “bursty bulk flows” (BBFs) in the near-Earth plasma sheet (Baumjohann et al., 1990; An-gelopoulos et al., 1992; Yeoman et al., 1998; Lyons et al., 1999) or “rapid flux transport” (RFT) events (Sch¨odel et al., 2001a, b) and the excitation of flow in the ionosphere (de la Beaujardi`ere et al., 1994; Yeoman and L¨uhr, 1997; Watan-abe et al., 1998; Grocott et al., 2004; Nakamura et al., 2005). As discussed, for example, by Cowley (1998), and Cowley et al. (1998), these features are strongly suggestive of the occur-rence of localised impulsive reconnection in the tail. Pseu-dobreakups, occurring during substorm growth phase, have also been associated with BBFs (e.g. Grocott et al., 2004) and have been shown to accompany significant enhancements in the nightside flux closure rate (Hubert et al., 2006).
Another series of substorm related phenomena believed to drive magnetospheric circulation are the polarisation jets (PJs) (Galperin et al., 1973), or sub-auroral ion drifts (SAIDs) (Spiro et al., 1979). PJ/SAIDs are fast (1–4 km s−1) narrow (1–2◦3) channels of westward plasma flow which occur just equatorward of the equatorward edge of the au-roral oval in the evening sector. They result from the forma-tion of radial polarisaforma-tion electric fields in the inner magne-tosphere (which map to poleward electric fields in the sub-auroral ionosphere) which themselves develop as a result of the charge separation caused by the penetration of partial ring current ions to a lower L-shell than plasma sheet electrons (Foster, 1995). Related phenomena have also been identi-fied in radar data such as substorm-associated radar auroral surges (SARAS) (Freeman et al., 1992; Shand et al., 1998) and auroral westward flow channels (AWFCs) (Parkinson et al., 2003, 2005a, b). AWFCs, however, have been ob-served to grow at substorm onset and decay during the re-covery phase (Parkinson et al., 2005b) whereas PJ/SAIDs identified in satellite data appear during recovery (Anderson et al., 1993). Foster and Burke (2002) use the term ‘sub-auroral polarisation stream’ (SAPS) to encompass all of these phenomena, which includes broader (3–5◦3), weaker (100– 400 m s−1), background flows which persist beyond mid-night into the predawn sector. These sub-auroral electric fields play critical roles in energising and transporting ring current ions as well as convecting thermal plasma in the in-ner magnetosphere and mid- to low-latitude ionosphere (Fos-ter and Vo, 2002).
There is little doubt that the wealth of observations which exist, such as those described above, have revealed much about substorms and substorm-related phenomena. One re-maining gap in our knowledge stems from the fact that onset occurs at the equatorward edge of the auroral oval which is often outside of, or at the nearest ranges of, the SuperDARN radar fields-of-view. This has a particular impact on our ability to study sub-auroral substorm flows, the importance of which is further demonstrated in the present study. The TIGER radar pair are amongst only a few radars which can observe the flows at these lower-latitudes, although they have
recently been joined by a new radar on Wallops Island (in the northern hemisphere) (Oksavik et al., 2006), the first of the new mid-latitude StormDARN array, which will ultimately extend SuperDARN coverage down to ∼40◦. By combining our ability to observe large-scale substorm electrodynamics using combined radar and auroral studies with in-situ ob-servations from bespoke multi-spacecraft substorm missions such as THEMIS (Time History of Events and Macroscale Interactions during Substorms) we will soon be in an ideal position to complete a synthesis of substorm physics. Be-fore this is possible, however, it is essential that we have a detailed framework of substorm electrodynamics in which to work.
In this paper, electric field and auroral signatures of an interval of substorm activity which occurred between 08:35 and 12:00 UT on 21 November 2004 are discussed. Unusu-ally for an interval of considerable activity (the ground mag-netic disturbance peaked in excess of 1000 nT) good cover-age of HF radar data from the SuperDARN network exists in the region of the substorm bulge. This has enabled the spa-tial and temporal development of many different elements of the substorm process to be reconciled, including the large-scale excitation of equatorward flow out of the polar cap after substorm onset, the occurrence of transient flow features and their relationship to auroral brightenings, the morphology of the substorm current wedge and Harang discontinuity, and the development of sub-auroral flows. These observations are discussed in the context of recent substorm theory pro-viding an up to date synthesis of our current understanding of substorm electrodynamics.
2 Instrumentation
This study combines simultaneous measurements from a number of sources to investigate the flow, magnetic, and au-roral signatures associated with a magnetospheric substorm on 21 November 2004. Ionospheric convection velocities are provided primarily by the Tasman International Geospace Enviroment Radars (TIGER) HF system (Dyson et al., 2000), which forms part of the Super Dual Auroral Radar Network (SuperDARN), an international array of HF coherent radars spanning the auroral regions of both the northern and south-ern hemispheres (Greenwald et al., 1995). Data from the en-tire southern hemisphere SuperDARN network, which con-sisted of seven radars during the interval being studied, is also used to provide a global solution to the ionospheric elec-tric potential, and hence the global convection pattern. This is achieved using the Map Potential technique (Ruohoniemi and Baker, 1998) which fits the line-of-sight SuperDARN data to an 8th order expansion (in this case) of the electro-static potential in spherical harmonics. Information from the statistical model of Ruohoniemi and Greenwald (1996), pa-rameterised by IMF conditions, is used to stabilise the solu-tion in regions where no measurements are available. It is
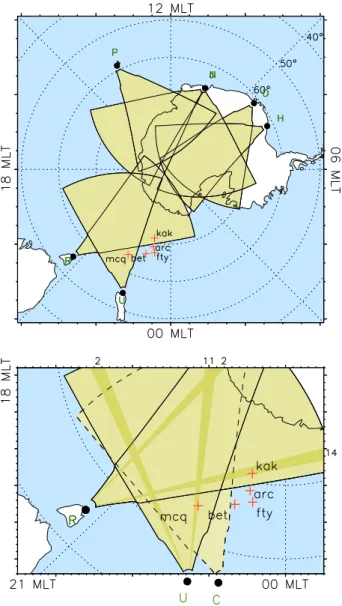
Fig. 1. The fields-of-view of the full southern hemisphere
Super-DARN array, presented in a magnetic local time- (MLT) magnetic latitude coordinate system (in the northern hemisphere) such that dusk is to the left and dawn is to the right. The region containing the TIGER radar pair is enlarged in the bottom panel, which is the same region in which flow and auroral data are displayed. Beams 2 and 11 of the TIGER Unwin radar (U) and beams 2 and 14 of the TIGER Bruny Island radar (R) are indicated by the darker shaded regions of the fields-of-view and labelled on the top and right-hand axes. The field-of-view of the (northern hemisphere) King Salmon radar, is shown dashed. Also shown on both panels are the location of the MacQuarie Island magnetometer, which is located close to the onset region of the substorm, and the locations of four magne-tometers from the northern hemisphere Alaskan array.
important to stress that these statistical average patterns do not represent local convection features under atypical condi-tions such as a substorm surge and detailed interpretation of the local convection pattern in regions of poor data coverage
is therefore not possible. Data from a single northern hemi-sphere radar (King Salmon) are also presented. During the study interval all radars were operating in a standard mode in which each scanned through 16 beams of azimuthal sep-aration 3.24◦, with a total scan time of 1 min. Each beam is divided into 75 range gates of length 45 km, and so in each full scan the radar covered 52◦in azimuth and over 3000 km in range, an area of over 4×10⁶km2.
The fields-of-view at 10:00 UT of the full southern hemi-sphere SuperDARN array are illustrated in the top panel of Fig. 1, which is presented in the magnetic local time-(MLT) magnetic latitude coordinate system “Altitude Ad-justed Corrected Geomagnetic” (AACGM), a development of the PACE coordinate system discussed by Baker and Wing (1989). As is the convention when working with southern hemisphere SuperDARN data, this is a view looking down from the northern hemisphere, such that dusk is to the left and dawn is to the right. The region containing the TIGER radar pair is enlarged in the bottom panel, which is the same re-gion in which the flow and auroral maps are displayed below. Beams 2 and 11 of the TIGER Unwin radar (U) and beams 2 and 14 of the TIGER Bruny Island radar (R), data from which are presented later in the paper, are indicated by the darker shaded regions of the fields-of-view and labelled on the top and right-hand axes. The field-of-view of the (northern hemi-sphere) King Salmon radar, is shown dashed. Also shown on both panels are the location of the MacQuarie Island mag-netometer, which is located close to the onset region of the substorm, and the locations of four magnetometers from the northern hemisphere Alaskan array. The use of these north-ern hemisphere magnetometers was necessitated by the lack of additional southern hemisphere observatories in the vicin-ity of the substorm bulge.
In addition, data from two spacecraft have also been used in this study. First, the Advanced Composition Explorer (ACE) spacecraft (Stone et al., 1998), located upstream of the Earth at GSM coordinates (X,Y,Z) = (243, 4, –10) RE, pro-vided interplanetary magnetic field (IMF) data from the mag-netometer (MAG) instrument (Smith et al., 1999) and solar wind data from the Solar Wind Electron Proton Alpha Mon-itor (SWEPAM) instrument (McComas et al., 1998). Sec-ond, the Wideband Imaging Camera (WIC) on board the Im-ager for Magnetopause-to-Aurora Global Exploration (IM-AGE) spacecraft (Mende et al., 2000a, b) provided images of the aurora during the interval. This instrument viewed the whole of the southern polar ionosphere during the course of the interval, and provided images approximately every 5 min. These consist of 5-s integrations of UV photons in the spec-tral region ∼140–190 nm. The resolution of each WIC pixel is approximately 52 km, comparable to the size of a Super-DARN range gate, discussed above.
3 Observations
3.1 Auroral and magnetic substorm signatures
Auroral and magnetic data, used to identify the time-line of substorm activity over the interval 0800 to 12:00 UT, are summarised in Fig. 2. Panel (a) shows a keogram of the maximum auroral intensity between 18 and 04 MLT, ob-tained from the FUV wideband imaging camera on the IM-AGE satellite. This was generated by selecting the maximum intensity pixel within this local time band for each latitude. In this way, spatial variations in the aurora are not resolved but full coverage of any temporal variations is achieved. The bar to the right of this panel indicates the colour-coded rel-ative intensity of the emissions. Panels (b) and (c) show band pass filtered (20–200 s) H-component magnetometer data from the MacQuarie Island and Arctic stations to il-lustrate Pi2 wave activity. Panels (d-g) show the unfiltered H-component data from the MacQuarie Island, Kaktovik, Ft. Yukon, and Bettles stations. The time of the initial distur-bance is indicated by the first vertical dashed line at 08:35 UT (i), with subsequent intensifications also similarly marked (ii–v). Closer inspection of the auroral images suggests that this first brightening is in fact a pseudo breakup, with the ac-tual substorm expansion phase onset more likely correspond-ing to the intensification at ∼08:51 UT (ii) and the start of the magnetic bay observed at Kaktovik. This second auroral in-tensification was also accompanied by a westward expansion of the auroral bulge (although at ∼08:58 UT a further bright-ening was initiated to the east, at ∼23:00 MLT). The interval would perhaps, therefore, be better described as a prolonged interval of substorm activity, rather than as an isolated event. Nevertheless, 08:35 UT coincided with the onset of Pi2 sig-natures in both hemispheres and also with the first indication of any auroral brightening and will therefore be considered the time of initial activity for the purposes of this paper.
During the ∼2 h following the initial brightening at 08:35 UT a number of intensifications can be identified in the auroral data, all of which were accompanied by poleward ex-cursions of the poleward boundary of the auroral emissions. This indicates that contractions of the polar cap, indicative of the closure of open magnetic flux via reconnection of lobe field lines, were occurring at these times. In between sev-eral of these intensifications there is also some evidence of recovery phase behaviour (e.g. after 09:36 UT, prior to (iv)), both in the magnetic data (i.e. the increase in H-component at Kaktovik) and in the auroral data (the equatorward relaxation of the poleward boundary). This also suggests that dayside reconnection and open flux creation was ongoing through-out the interval. After the final intensification indicated at 10:15 UT (v) the aurora experienced a prolonged equator-ward relaxation of their poleequator-ward boundary, suggesting that the magnetosphere had entered the recovery phase proper. Whilst there were some small perturbations in the magnetic H-component during the last hour of the interval, between
∼11:00 and 12:00 UT, the lack of Pi2 signatures or addi-tional auroral breakup signatures would indicate that these are not related to further substorm intensifications. Finally, it should be noted that the brightening at ∼11:50 UT occurs af-ter the viewing angle of the IMAGE spacecraft had become too oblique to perform a meaningful mapping and is there-fore not discussed.
3.2 Solar wind and ionospheric electric field data
Time-series summarising the upstream interplanetary and ionospheric electric field data are presented in Fig. 3. The keogram of IMAGE data (panel a) and vertical dashed lines from Fig. 2 are also reproduced for reference. The solar wind electric field, ESW, which has been determined from the ACE upstream interplanetary data (–V BZ) is shown in panel (b). This has been lagged by 45 min to account for the propagation delay between the spacecraft and the day-side ionosphere, using the algorithm of Khan and Cowley (1999). Positive regions of ESW, corresponding to intervals of southward IMF and therefore to intervals of dayside driv-ing by low-latitude reconnection, are shaded grey. Panel (c) shows electric potential information from the Map Potential analysis. The black curve is the total transpolar voltage, VP C, determined from the peaks in the potential from the analysis and therefore provides a global measure of the strength of the convection. It is clear, however, that this is dominated by the solar wind input, evidenced by the correlation between the two. This is not unexpected owing to the limited data coverage of the global convection pattern and its resultant domination by the solar wind-governed statistical model (the data coverage increases from ∼1% of the polar cap at the start of the interval to ∼6% by 09:30 UT; by comparison, a ‘best case’ convection map will contain data over ∼30%). Nevertheless, the enhancements in ESW/ VP C, such as those observed prior to (iv) and after (v), do suggest that the equa-torward motions of the poleward edge of the auroral oval at these times are therefore results of reconnection, and open flux production, at the dayside magnetopause.
Isolating the voltage directly related to the flows in the substorm dominated (and radar data rich) region provides a better indication of the substorm-dominated variability. The red curve in panel (c) represents the maximum potential drop across the auroral zone along the 21:00 MLT meridian, VAZ, with corresponding red axis on the right hand side. In these data, enhancements which correlate more closely to the sub-storm intensifications are revealed, such as those immedi-ately after (iii) and (v). A more detailed picture of the sub-storm flows can be derived from looking at radar line-of-sight data from individual radar beams. Data from the four beams illustrated in Fig. 1 are presented in Fig. 3d–g, colour-coded according to the bar on the right. The poor data coverage at the start of the interval alluded to above is immediately evident, with the initial onset having no clear signature in the limited backscatter. However, after the intensification at
Fig. 2. Auroral and magnetic data, used to identify the time-line of substorm activity over the interval 0800 to 12:00 UT. Panel (a) shows a
keogram of the maximum auroral intensity between 18:00 and 04:00 MLT, obtained from the FUV wideband imaging camera on the IMAGE satellite. The bar to the right of this panel indicates the colour-coded relative intensity of the emissions. Panels (b) and (c) show Pi2 filtered (20–200 s) H-component magnetometer data from the MacQuarie Island and Arctic stations. Panels (d–g) show the unfiltered H-component data from the MacQuarie Island, Kaktovik, Ft. Yukon, and Bettles stations. The time of the initial disturbance is indicated by the first vertical dashed line at 08:35 UT, with subsequent intensifications also similarly marked.
08:51 UT (ii) the amount of near-range scatter began to im-prove in all four radar beams, followed by the appearance of some echoes from further ranges after about 09:10 UT. At about 09:30 UT the amount of scatter observed by both radars improved considerably, and remained high through-out the succeeding intensifications and well into the recovery phase.
The nature of the flow throughout the interval can be sum-marised as follows. Beam 2 of the Unwin radar measured
“away” flow (i.e. negative Doppler velocities, colour-coded red in Fig. 3) throughout much of the interval, at speeds which peaked in excess of 500 m s−1. Referring to Fig. 1, and to the IMAGE keogram in panel (a), it can readily be seen that these measurements represent sunward “return” flow in the dusk auroral zone. The remaining three beams, hav-ing more meridional pointhav-ing directions, each observed two flow regimes. At near ranges they all also observed a com-ponent of the sunward flow, away from the radar (Unwin,
Fig. 3. (a) The keogram of IMAGE data from Fig. 2. (b) The solar wind electric field, ESW, which has been determined from the ACE
upstream interplanetary data (and lagged by 45 min to account for the propagation delay between the spacecraft and the dayside ionosphere).
(c) Electric potential information from the Map Potential analysis. The black curve is the total transpolar voltage determined from the peaks
in the potential from the analysis and the red curve is the voltage across the 21:00 MLT auroral zone (×2, for clarity, such that the scale for this curve is actually 10–35 kV). (d–g) Time-series line-of-sight velocity data from the four radar beams illustrated in Fig. 1, colour-coded according to the bar on the right. The vertical dashed lines are as in Fig. 2.
beam 11 and Bruny Island, beam 2) and towards the radar (Bruny Island, beam 14). However, at further ranges (mov-ing to nearer ranges with increas(mov-ing Universal Time) they each observed a component of the more equatorward flow emanating from within the polar cap. The reversal boundary between these two flow regimes was located between ∼–63◦ and –65◦, just poleward of the equatorward edge of the
auro-ral emissions and, like the aurora, its motion shows a geneauro-ral equatorward trend throughout the interval. The two dimen-sional characteristics and development of the flows are dis-cussed further below.
The time-series flow data displayed in Fig. 3 reveals an-other important feature in the radar data, namely, the occur-rence of fast equatorward moving patches of scatter at higher
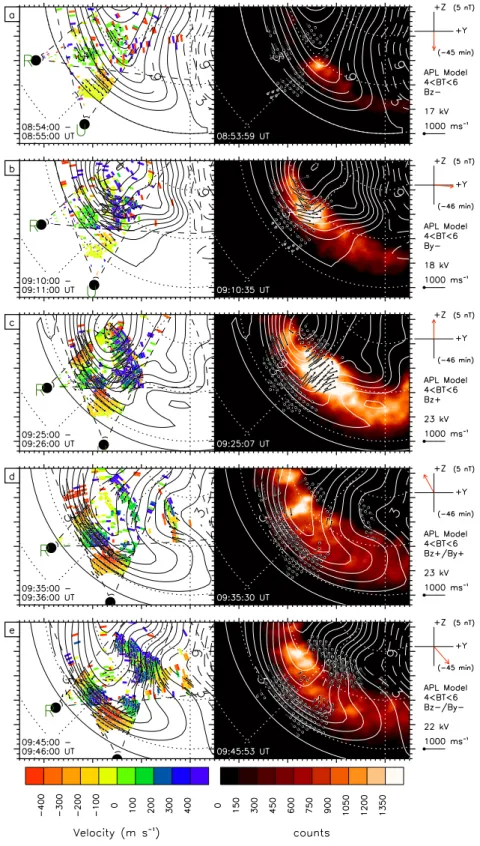
Fig. 4. Two-dimensional maps of the ionospheric flows and auroral images from selected times over the interval spanning the substorm. The
times of the radar scans are indicated in the bottom left-hand corner of each panel. Superposed on the line-of-sight radar data (left hand panels) are the electric equipotentials from the Map Potential analysis, shown at 3 kV intervals, and the two dimensional fitted flow vectors. The accompanying auroral images (right hand panels) are those which most closely correspond to the times of the radar scans, their exact times being shown in the bottom left-hand corner of each image. On the far right, parameters from the Map Potential analysis (see Sect. 2) are shown, including the concurrent (lagged) IMF vector, the APL statistical model used and voltage across the 21:00 MLT auroral zone from Fig. 3.
latitudes. These are evident at ∼09:10 UT (Unwin, beam 11), ∼09:25 UT (Bruny Island, beam 14), ∼10:00 UT (Bruny Is-land, beam 2) and ∼10:20 UT (Unwin, beam 11). The first of these flow bursts, for example, appeared at a magnetic lat-itude of about –71◦ at ∼09:10 UT on beam 11 of the Un-win radar which, at that time, was closely aligned with the 21:00 MLT meridian. In the space of ∼15 mins the patch moved equatorward to about –68◦, crossing the auroral oval from its poleward edge to well within the auroral zone. This suggests that the flow burst moved from a region of open field lines (in the polar cap) onto closed field lines and is there-fore a possible signature of reconnection in the tail. This is consistent with observations of a bursty bulk flow (BBF) de-tailed by Grocott et al. (2004) and will be discussed further in Sect. 4.
3.3 Auroral images and flow maps
Two-dimensional maps of the ionospheric flows and cor-responding auroral images are shown in Fig. 4 from se-lected times over the interval spanning the substorm activity. The times of the radar scans (indicated in the bottom left-hand corner of each panel) were chosen to best highlight the changes which occurred over the interval including those as-sociated with the substorm intensifications. Superposed on the line-of-sight radar data (left hand panels) are the elec-tric equipotentials from the Map Potential analysis, shown at 3 kV intervals, and the two dimensional fitted flow vec-tors. The accompanying auroral images (right hand panels) are those which most closely correspond to the times of the radar scans, their exact times being shown in the bottom left-hand corner of each image. On the far right, parameters from the Map Potential analysis (see Sect. 2) are shown, includ-ing the concurrent (lagged) IMF vector, the APL statistical model used and voltage across the 21:00 MLT auroral zone from Fig. 3.
During the first ∼50 mins of the interval there was insuffi-cient coverage of SuperDARN data in the premidnight sector to dominate the statistical model, and as such no interpreta-tion of the convecinterpreta-tion at the time of the first pseudobreakup (at 08:35 UT) is possible. By 08:54 UT, however, shortly after onset of the main substorm electrojet, the amount of radar scatter was sufficient to produce a reasonable potential pattern in the wider vicinity of the substorm bulge (panel a). Comparing this pattern to the auroral data now reveals that the bulge was located inside the clockwise vortex of the dusk convection cell with the flow reversal boundary located in-side the auroral oval. The scatter was still fairly sparse, how-ever, and those flows which were observed are only mod-erate in magnitude at a few ∼100 m s−1. The locations of the radars at this UT were also not ideal to fully observe the pre-midnight sector. By 09:10 UT (panel b) the amount of scatter had improved markedly, with flows of over 500 m s−1 being evident in the vicinity of the substorm bulge, corre-sponding to one of the transient flow features seen in Fig. 3.
These flows appear to have been equatorward crossing the bulge, then turning westwards at lower latitudes. A signif-icant intensification is evident in the auroral emissions at 09:25 UT (panel c), which is accompanied by yet further enhancements to both the amount of scatter present and to the velocity of the flows which peak at ∼800 m s−1. This is also reflected in the voltage across the dusk convection cell, which has increased by 5 kV. The additional backscatter also serves to draw the potential pattern equatorward such that by 09:36 UT (panel d) the auroral zone is shown to be contained entirely within the pre-midnight reversal region. Panels (c– e) also show the development of the fast (∼700 m s−1) dusk-side sunward flows alluded to in reference to Fig. 3 above, evidenced both in the red and blue coloured scatter in the two radar fields-of-view, and in the enhanced voltage men-tioned above. By 09:45 UT (panel e) the fast equatorward flow at higher latitudes, out of the polar cap, had also reap-peared. The auroral emissions themselves, however, have subsided somewhat (panels d–e) consistent with the recov-ery at 09:36 UT noted in the magnetometer data mentioned above.
Immediately after the fourth auroral intensification at 09:54 UT (marked on Figs. 2 and 3) there was an apparent re-duction in the dusk auroral zone potential, although the flow velocities themselves do not appear to have been dramati-cally reduced, still peaking in excess of 600 m s−1(panel f). An interesting feature is the apparent diversion of the flow around the enhanced portion of the poleward boundary of the oval, with fast equatorward flows to the west of this re-gion still evident. Ten minutes later at 10:05 UT (panel g) this patch of equatorward flow has shrunk somewhat, but has also moved slightly poleward in concert with the pole-ward edge of the oval. Both of these features are indicative of a poleward motion of the open-closed field line bound-ary and therefore of nightside reconnection removing open flux from the polar cap. This time also marks the first in-stance when the radars are located sufficiently late in MLT to begin to reveal the Harang discontinuity, i.e., the eastward and westward flows in the pre-midnight reversal region. This feature became even more well defined over the following hour (panels h–j), with a sharp eastward kink in the flow evi-dent at ∼–65◦3just poleward of the fast westward / sunward flows between –60◦and –62◦3. Panel (h) also shows the last significant auroral intensification (beginning at 10:15 UT in Fig. 2). This brightening occurred westward of the previous one, at 21:00 MLT, and is again accompanied by a poleward contraction of the oval. The poleward most band of scat-ter has also moved poleward, although there is also a band of equatorward scatter to the east of the bulge at ∼–70◦3. The sunward flows have also re-intensified with a voltage of 19 kV now existing across the 21:00 MLT auroral zone. An hour later (panel j), well into the recovery phase of the sub-storm, the Harang and sub-auroral flows were still very well defined.
4 Discussion
Substorms have been associated with a wide variety of auro-ral, magnetic field and plasma flow phenomena, the combi-nation of which serves to produce a very complicated over-all picture of substorm electrodynamics. In particular, when studied individually, only so much can be learned about the role of these phenomena in substorm physics. The present dataset is unique, however, in that it has enabled the simulta-neous observation of a number of these phenomena, reveal-ing much about their relationship with each other, and plac-ing them within a larger conceptual framework.
4.1 The large-scale picture
Although radar data coverage outside of the substorm-disturbed region is limited during this interval, the existence of significant flow signatures both in the polar cap and in the auroral zone serves to constrain the large-scale convection pattern, at least in the context of substorm activity. For ex-ample, the excitation of flow at the poleward edge of the au-roral oval which is evident after 09:10 UT (Fig. 4) is strongly indicative of the excitation of Dungey-cycle convection as reported by, e.g. Grocott et al. (2002). Indeed, the fact that these flows clearly cross the open-closed field line bound-ary implies reconnection driven flow. The development of these flows over the course of the expansion phase, rather than an instantaneous appearance at the time of substorm on-set, is corroborated by other recent studies such as those of Jayachandran et al. (2003) and Provan et al. (2004) which also show a large-scale reaction in the flows over the ∼10–20 mins following substorm onset. What is clear from this study, however, is the addition to these flows of other large-scale flow features, which have previously only been discussed in-dividually.
For example, the development of the Harang Discontinu-ity, which is a region of equatorward electric field extending into the post-midnight sector, is also evident in Fig. 4. One result of the Harang which can clearly be seen, for example, in Fig. 4h is the reversal of the dusk cell flow at a lower lat-itude than that of the dawn cell. Of course, the flow pattern is complicated further by smaller-scale perturbations which are imposed by localised changes in the conductivity, how-ever, these are discussed in more detail below. The larger-scale, azimuthally extended, Harang flows may actually cor-respond to the true form of the Kamide et al. (1994) equa-torward substorm convection cell as postulated by Liang et al. (2006). In this case, however, these flows also appear to be intrinsically related to the enhanced auroral and sub-auroral flows described earlier. These are themselves likely to con-tain the return flow associated with Dungey cycle convec-tion, but also contain structure driven by polarisation fields in the inner magnetosphere, such as the auroral westward flow channels (AWFCs) discussed, for example, by Parkin-son et al. (2003, 2005a, b). Interestingly, the Harang and
Fig. 5. Two scans of line-of-sight velocity data from the
north-ern hemisphere King Salmon radar, which is conjugate to TIGER Unwin (see Fig. 1). This data is shown in the same format as the left-hand panels of Fig. 4, and again has the southern hemisphere vectors and potential contours superposed, for comparison with the northern hemisphere data.
sub-auroral flows persisted for over an hour into the recovery phase of the substorm described here, well after the major auroral signatures of the substorm had subsided. This sup-ports the notion that they must be a response to something in addition to the substorm current system which will have dominated during the expansion phase.
Another facet of the flows described here relates to their conjugacy. Whilst the asymmetries mentioned above have been observed before during substorms, other asymmetries can exist, such as those introduced by a significant IMF By component, which could be present here. In this case, IMF Byfluctuates between ±6 nT over the course of the in-terval (as evidenced in the ACE data, not shown), making any inference of a By-related asymmetry difficult to make. However, previous studies of the effect of IMF By on night-side ionospheric flows have revealed an opposite asymme-try between the northern and southern hemispheres (Grocott et al., 2005), which is something that is not observed here. This is illustrated in Fig. 5, which shows two scans from the
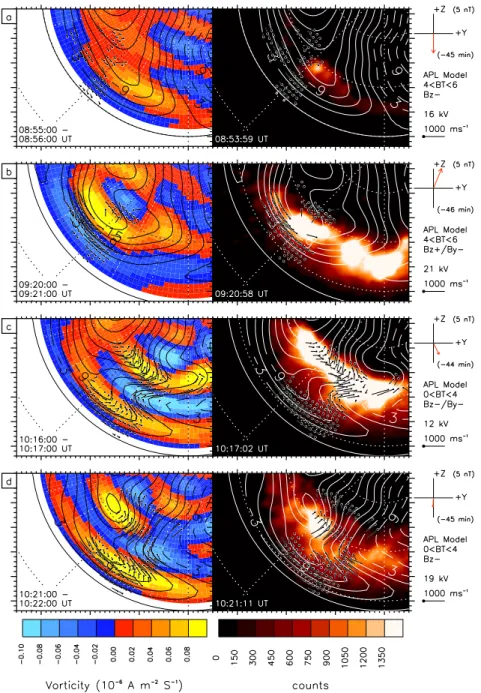
Fig. 6. Four selected maps of field-aligned current density (left-hand panel) and corresponding auroral images (right-hand panel). The pattern
of FAC is implied by the curl of the velocity field (derived from the electric potential) and has been determined using the technique described by McWilliams et al. (2001). Positive vorticities (red/yellow) indicate upward field aligned current, and negative vorticities (blue) downward field aligned current.
northern hemisphere King Salmon radar, which is conjugate to TIGER Unwin (see Fig. 1). This data is shown in the same format as the left-hand panels of Fig. 4, and again has the southern hemisphere vectors and potential contours super-posed, for comparison with the northern hemisphere data. The northern hemisphere flows, indicated by the coloured patches, are clearly consistent with those in the southern hemisphere with fast equatorward flows emanating from the polar cap followed by fast, westward, sunward flows at lower
latitudes. This is consistent with an interhemispheric study of sub-auroral polarisation streams conducted by Parkinson et al. (2005) who also found a long-time scale magnetic con-jugacy in the AWFC activity.
One final aspect of the large-scale electrodynamics which should be considered is that of the associated field-aligned current system. In an attempt to visualise the pattern of FAC during this interval, the curl of the velocity field (de-rived from the electric potential) has been determined using
the technique described by McWilliams et al. (2001) (after Freeman et al., 1990; Sofko et al., 1995). This is illustrated in Fig. 6, which shows the vorticity of the flow at four se-lected times, alongside the corresponding auroral map. Here, positive vorticities (red/yellow) correspond to upward field aligned current, and negative vorticities (blue) to downward field aligned current. Of course, the vorticity is not a direct indication of the FAC, the latter also being dependent on gra-dients in the conductivity. In particular, the meso-scale dis-tribution of FAC has been shown to be strongly dominated by conductivity gradients (e.g. Amm et al., 2005). With that in mind, however, the clear agreement between auroral en-hancements and changes in the vorticity is quite remarkable and must strongly imply a relationship with the FAC. Look-ing at panels (a) and (b), for example, the change in vorticity which occurs as a result of the main substorm intensifica-tion appears to be an enhanced region at the westward end of the substorm bulge. This implies a typical azimuthal sub-storm current wedge (SCW) configuration with the subsub-storm electrojet flowing westwards along the poleward edge of the bulge. Comparing this to the situation later on in the interval (panels c–d) suggests a significant change in the current pat-tern. There are still localised regions of enhanced vorticity associated with the bright aurora (discussed further below), but there is now an additional region at lower latitudes cor-responding to the Harang, but not to any significant auroral enhancement. This may well be associated with a merid-ional current system (MCS) of the kind described by Kamide et al. (1994), for example, in their Fig. 7. Liang et al. (2006) suggest that the MCS current system and associated eastward flows at auroral latitudes is a result of field line slippage (Lui and Kamide, 2003), whereas the SCW may be driven by re-connection. This is certainly consistent with the sub-auroral location of the MCS vs. the auroral location of the SCW. 4.2 The small-scale picture
One of the main problems in trying to describe a simple large-scale scenario for substorms, is the fact that they are intrinsically related to smaller-scale phenomena which serve to complicate their overall electrodynamics. When using HF radars to study substorms, for example, one of the most sig-nificant complicating factors is the variability in the charac-teristics of radar backscatter itself. Consider Fig. 4b, for ex-ample, which shows a patch of enhanced scatter collocated with the brightest aurora. According to Milan et al. (1999) in-tense, short lived, electron precipitation associated with auro-ral arcs can give rise to radar backscatter. However, enhance-ments to the ionospheric electron density which can also be caused by auroral precipitation can also give rise to backscat-ter bite-outs. In Fig. 4c, for example, there is evidence of a region devoid of scatter just equatorward of the enhanced flow region. This loss of scatter is something which is also often seen in association with substorm expansion phases and is understood to be related to enhanced refraction of the HF
radio signal, or by absorption of the signal by enhanced elec-tron densities in the bulge (Gauld et al., 2002). It is not diffi-cult to see how, in cases where this drop out of data is signif-icant, the lack of any observations of flow excitation can be misinterpreted as evidence for the absence of such flow.
Not all auroral arcs that do produce backscatter are asso-ciated with enhanced flows. Indeed, in some cases the high conductivities present in bright auroras can inhibit the elec-tric field, resulting is regions of stagnant flow. Fig. 4f, for example, shows a typical “zone of avoidance” in which sub-storm flows are diverted around a region of high conductivity. It is worth stressing at this point that no information from the auroral data is used in generating the potential patterns from SuperDARN, which are therefore clearly in remark-able agreement. There is some distinction, however, between the intense, short lived, auroral forms which can give rise to intense electric fields and those in which the electric field is reduced. A localised flow suppression region, however, should also not be interpreted as evidence that substorms do not excite flow. To the west of the flow suppression region in Fig. 4f, for example, there is still a significant zone of fast equatorward flow which forms part of a larger-scale flow system that is largely unchanged from that of Fig. 4e. The smaller-scale electrodynamics can therefore serve to compli-cate the geometry of the larger-scale picture but generally appear to act in addition to, rather than instead of, the more global-scale convection dynamics.
The variability in the location and size of these fast flow re-gions does, however, raise an interesting question pertaining to the origin of the flows. It was noted above in reference to Fig. 3 that there are transients which propagate equatorward from the polar cap into the auroral zone. These have strong analogues to similar flows observed on the dayside such as poleward moving radar auroral forms (PMRAFs) which have been shown to be the ionospheric flow signature of dayside reconnection (Milan et al., 2000; Wild et al., 2001). Perhaps these equatorward moving radar auroral forms, or EMRAFs, are the counterpart ionospheric flow signature of nightside reconnection? For instance, de la Beaujardi`ere et al. (1994) reported the occurrence of bursts of equatorward-directed flow in nightside Sondrestrom radar data which took place during a “quiet-time” interval in which the transverse com-ponents of the IMF were small and directed mainly north-ward. These bursts were initiated near the nightside open-closed field line boundary and had amplitudes up to several 100 m s−1. Simultaneous auroral data showed that each flow pulse was accompanied by a poleward boundary intensifi-cation (PBI) (Lyons et al., 1999), similar to at least one of the EMRAFs observed here. This is illustrated in Fig. 6c, which also reveals the kinked convection signature and as-sociated pattern of field-aligned currents at ∼70◦3. Lester et al. (2001) also reported radar signatures of nightside re-connection at the polar cap boundary, in this case taking the form of narrow bands of large spectral width, which oc-curred during an interval of weak solar wind forcing. That
such similar phenomenology can occur under such different geophysical conditions implies that the same underlying re-connection processes are involved whether during a substorm expansion phase or during extended intervals of geomagnetic quiet.
Poleward boundary intensifications are not the only mesoscale auroral feature which are associated with recon-nection and flow excitation. Indeed, PBIs themselves are of-ten observed to “eject” one or more north-south aligned auro-ral forms, or streamers, towards lower latitudes (Henderson et al., 1998) and these have been associated with the earth-ward transport of flux, specifically, bursty-bulk flows (BBFs) in the near-Earth plasma sheet. Presumably therefore, since they originate from the poleward most arc, these are the sig-natures of reconnection. However, during substorm growth phases, BBFs have also been observed coincident with dobreakups (e.g. Grocott et al., 2004). Traditionally, a pseu-dobreakup is described as a substorm which never progresses to a full expansion phase. If substorm reconnection begins on closed field lines, with a full expansion phase onset be-ginning only when the reconnection reaches open flux, then a pseudobreakup must presumably also involve only closed field lines. This is contrary to some studies such as those by Grocott et al. (2004) and Hubert et al. (2006), however, which suggest that pseudobreakups are associated with sig-nificant closure of open flux. This discrepancy in our un-derstanding of such phenomena is something which must be resolved.
5 Summary
In this paper we have discussed an interval of substorm ac-tivity during which the disturbed region was well observed by the FUV instrument on board the IMAGE spacecraft and by the TIGER pair of HF radars. This has enabled the spa-tial and temporal development of many different elements of the substorm process to be resolved including the large-scale excitation of equatorward flow out of the polar cap af-ter substorm onset, the occurrence of transient flow features and their relationship to auroral brightenings, the morphol-ogy of the substorm current wedge and Harang discontinuity, and the development of sub-auroral flows. Specifically, this study has revealed the following:
(a) Small-scale electrodynamics such as localised activa-tions of the aurora, transient flow enhancements and regions of flow suppression can be reconciled with the more global-scale evolution of the substorm, whilst re-vealing much about the complex interplay between the electric fields and aurora.
(b) “Equatorward moving radar auroral forms” (EMRAFS) propagate across the open-closed field line boundary as a likely HF radar signature of nightside reconnection. These are analogous to similar features on the dayside
that have been successfully used to quantify reconnec-tion.
(c) Simultaneous observations of the development of large-scale dynamical systems such as the Harang Disconti-nuity and the sub-auroral flow channels have enabled them to be placed within a simple conceptual frame-work of magnetospheric convection. This helps to rec-oncile observations of localised substorm current sys-tems such as the Kamide et al. (1994) ‘equatorward sub-storm convection cell’ with observations of global-scale intensifications associated with convection and polari-sation fields in the inner magnetosphere.
(d) A remarkable agreement between the vorticity of iono-spheric flow and auroral morphology supports the ex-istence of a number of distinct substorm current sys-tems including the traditional substorm current wedge, the Kamide et al. (1994) meridional current system, the nightside component of the DP-2 current system, the more equatorward currents associated with polarisa-tion electric fields and other, localised, regions of field-aligned-current.
Additional, multi-scale studies, are obviously warranted be-fore a complete synthesis of substorm electrodynamics can be claimed. These will no doubt come from future investiga-tions of substorm plasma sheet dynamics using THEMIS and its associated ground based observatories, combined with ob-servations of the auroral and sub-auroral ionosphere from Su-perDARN and StormDARN. The present study, in addition to providing a detailed overview of our current understand-ing, has defined a detailed framework within which these new data can be interpreted.
Acknowledgements. We would like to thank the PIs of the
Super-DARN radars for provision of the radar data employed in this study. The data employed were from radars funded by the research fund-ing agencies of Canada, France, Japan, South Africa, Australia, the UK, and USA. The TIGER research program is supported by the Australian Research Council, the Australian Antarctic Science Pro-gram and the TIGER Consortium Partners (La Trobe University, Australian Antarctic Division, DSTO Intelligence Surveillance and Reconnaissance Division, IPS Radio and Space Services, Monash University, and University of Newcastle). This particular collabora-tion was also supported by the Australian Academy of Sciences. Thanks also R. J. Barnes of the Johns Hopkins University Ap-plied Physics Laboratory for provision of the “Map-Potential” al-gorithm software, and Kathryn McWilliams of the University of Saskatchewan for the FAC software. For provision of ACE data we thank N. Ness and C. Smith of the Bartol Research Institute and D. McComas of the Southwest Research Institute. Alaskan mag-netometer data was courteously provided by the Geophysical Insti-tute, University of Alaska, Fairbanks. A. Grocott, M. Lester and T. K. Yeoman were supported during this study by PPARC grant PPA/G/O/2003/00013. SuperDARN operations at the University of Leicester are supported by PPARC grant PPA/R/R/1997/00256.
Collaboration during this study was supported by an IAS Advanced Fellowship (M. Lester) at La Trobe University and an AAS Visiting Fellowship (M. L. Parkinson) at the University of Leicester.
Topical Editor M. Pinnock thanks two referees for their help in evaluating this paper.
References
Akasofu, S.-I.: The dynamical morphology of the auroral polaris, J. Geophys. Res., 68, 1667–1672, 1963.
Akasofu, S.-I.: The development of the auroral substorm, Planet. Space Sci., 12, 273–282, 1964.
Akasofu, S.-I.: Polar and magnetospheric substorms, Dordrecht: Reidel, 1968.
Akasofu, S. I.: Physics of magnetospheric substorms, Dordrecht: Reidel, 1977.
Akasofu, S.-I., Chapman, S., and Meng, C.-I.: The polar electrojet, J. Atmos. Terr. Phys., 27, 1275–1305, 1965.
Akasofu, S.-I. and Meng, C.-I.: A study of polar magnetic sub-storms, J. Geophys. Res., 74, 292–313, 1969.
Amm, O., Aksnes, A., Stadsnes, J., Ostgaard, N., Vondrak, R. R., Germany, G. A., Lu, G., and Viljanen, A.: Mesoscale ionospheric electrodynamics of omega bands determined from ground-based electromagnetic and satellite optical observations, Ann. Geo-phys., 23, 325–342 2005.
Anderson, P. C., Hanson, W. B., Heelis, R. A., Craven, J. D., Baker, D. N., and Frank, L. A.: A proposed production model of rapid subauroral ion drifts and their relationship to substorm evolution, J. Geophys. Res., 98, 6069–6078, 1993.
Angelopoulos, V., Baumjohann, W., Kennel, C. F., Coroniti, F. V., Kivelson, M. G., Pellat, R., Walker, R. J., L¨uhr, H., and Paschmann, G.: Bursty bulk flows in the central plasma sheet, J. Geophys. Res., 97, 4027–4039, 1992.
Atkinson, G.: The current system of geomagnetic bays, J. Geophys. Res., 72, 6063–6067, 1967.
Baker, D. N., Akasofu, S.-I., Baumjohann, W., Bieber, J. W., Fair-field, D. H., Hones Jr., E. W., Mauk, B., McPherron, R. L., and Moore, T. E.: Substorms in the magnetosphere, in Solar Terres-trial Physics: Present and Future, NASA reference publication 1120, pp. 8.1–8.55, 1984.
Baker, K. B. and Wing, S.: A new magnetic coordinate system for conjugate studies at high latitudes, J. Geophys. Res., 94, 9139– 9143, 1989.
Baumjohann, W., Paschmann, G., and L¨uhr, H.: Characteristics of high-speed flows in the plasma sheet, J. Geophys. Res., 95, 3801–3809, 1990.
Blanchard, G. T., Lyons, L. R., and de la Beaujardi`ere, O.: Mag-netotail reconnection rate during magnetospheric substorms, J. Geophys. Res., 102, 24 303–24 312, 1997.
Blanchard, G. T., Lyons, L. R., de la Beaujardi`ere, O. Doe, R. A., and Mendillo, M.: Measurements of the magnetotail reconnec-tion rate, J. Geophys. Res., 101, 15265–15276, 1996.
Bostrom, R.: A model of the auroral electrojets, J. Geophys. Res., 69, 4963–4999, 1964.
Bristow W. A., Otto, A., and Lummerzheim, D.: Substorm con-vection patterns observed by the Super Dual Auroral Radar Net-work, J. Geophys. Res., 106, 24 593–24 609, 2001.
Cowley, S. W. H. and Lockwood, M.: Excitation and decay of so-lar wind-driven flows in the magnetosphere-ionosphere system,
Ann. Geophys., 10, 103–115, 1992, http://www.ann-geophys.net/10/103/1992/.
Cowley, S. W. H.: Excitation of flow in the Earth’s magnetosphere-ionosphere system: observations by incoherent-scatter radar, in: Polar Cap Boundary Phenomena, edited by: Egeland, A., Moen, J., and Lockwood, M., Kluwer Academic Publ., Dordrecht, p. 127, 1998.
Cowley, S. W. H., Khan, H., and Stockton-Chalk, A.: Plasma flow in the coupled magnetosphere-ionosphere system and its relation-ship to the substorm cycle, in: Substorms-4, edited by: Kokobun, S. and Kamide, Y., Terra Sci. Publ. Co., Tokyo, p. 623–628, 1998.
Clauer, C. R. and Kamide, Y.: DP-1 and DP-2 current systems for the March 22, 1979 substorms, J. Geophys. Res., 90, 1343–1354, 1985.
de la Beaujardi`ere, O., Lyons, L.R., and Friis-Christensen, E.: Son-drestrom radar measurements of the reconnection electric field, J. Geophys. Res., 96, 13 907–13 912, 1991.
de la Beaujardi`ere, O., Lyons, L. R., Ruohoniemi, J. M., Friis-Christensen, E., Danielsen, C., Rich, F. J., and Newell, P. T.: Quiet-time intensifications along the poleward boundary near midnight, J. Geophys. Res., 99, 287–298, 1994.
Dyson, P. L. and Develin, J. C.: The Tasman International Geospace Envirenoment Radar, The Physicist (The Australian Institute of Physics), 37, 48–53, 2000.
Elphinstone, R. D., Murphree, J. S., and Cogger, L. L.: What is a global auroral substorm?, Rev. of Geophys., 34, 169–232, 1996. Foster, J. C.: Radar observations of magnetosphere-ionosphere cou-pling at mid and high latitudes, J. Geomag. Geoelectr., 47, 801– 812, 1995.
Foster, J. C. and Burke, W. J.: SAPS, A new categorization for sub-auroral electric fields, EOS, Transactions, American Geophysical Union, 83(36), 393–394, 2002.
Foster, J. C. and Vo, H.B.: Average characteristics and activity de-pendence of the subauroral polarisation stream, J. Geophys. Res., 107, 1475, doi:10.1029/2002JA009409, 2002.
Fox, N. J., Cowley, S. W. H., Davda, V. N., Enno, G., Friis-Christensen, E., Greenwald, R. A., Hairston, M. R., Kivelson, M. G., Lester, M., Lockwood, M., L¨uhr, H., Milling, D. K., Mur-phree, J. S., Pinnock, M., and Reeves, G. D.: A multipoint study of a substorm occurring on 7 December 1992 and its theoretical implications, Ann. Geophys., 17, 1369–1384, 1999,
http://www.ann-geophys.net/17/1369/1999/.
Freeman, M. P. and Southwood, D. J.: The effect of magnetospheric erosion on mid- and high-latitude ionospheric flows, Planet. Space Sci., 36, 509–522, 1988.
Freeman, M. P., Southwood, D. J., Lester, M., and Waldock, J. A.: Measurement of field-aligned currents by the SABRE coherent scatter radar, in: Physics of Magnetic Flux Ropes, Geophysical Monograph Series, 58, edited by: Russell, C. T., Priest, E. R. and Lee, L. C., AGU, Washington, D.C., pp. 575–580, 1990. Freeman, M. P., Southwood, D. J., Lester, M., Yeoman, T. K., and
Reeves, G. D.: Substorm-associated radar auroral surges, J. Geo-phys. Res., 97, 12 173–12 185, 1992.
Galperin, Y. I., Ponomarev, V. N., and Zosimova, A. G.: Direct mea-surements of ion drift velocity in the upper ionosphere during a magnetic storm, 2. Results of measurements during the Novem-ber 3, 1967, magnetic storm, Cosmic Res. (Russian), 11, 283– 292, 1973.
Gauld, J. K., Yeoman, T. K., Davies, J. A., Milan, S. E., and Honary, F.: SuperDARN radar HF propagation and absorption response to the substorm expansion phase, Ann. Geophys., 20, 1631–1645, 2002,
http://www.ann-geophys.net/20/1631/2002/.
Grafe, A., Pellinen, R. J., Baumjohann, W., and Vallinkoski, M.: Development of the auroral electrojets on March 16, 1978: An event study, Geophysica, 23, 113–141, 1987.
Greenwald, R. A., Baker, K. B., Dudeney, J. R., Pinnock, M., Jones, T. B., Thomas, E. C., Villain, J.-P., Cerisier, J.-C., Se-nior, C., Hanuise, C., Hunsucker, R. D., Sofko, G., Koehler, J., Nielsen, E., Pellinen, R., Walker, A. D. M., Sato, N., and Yam-agishi, H.: DARN/SuperDARN: A global view of the dynamics of high-latitude convection, Space Sci. Rev., 71, 761–796, 1995. Grocott, A., Cowley, S. W. H., and Davies, J. A.: Comparison of ionospheric electric currents and plasma convection patterns observed during substorms, in: Proc. Fifth Internat. Conf. on Substorms, ESA SP443, ESA, Noordwijk, The Netherlands, pp. 295–298, 2000.
Grocott, A., Cowley, S. W. H., Sigwarth, J. B., Watermann, J. F., and Yeoman, T. K.: Excitation of twin-vortex flow in the night-side high-latitude ionosphere during an isolated substorm, Ann. Geophys., 20, 1577–1601, 2002,
http://www.ann-geophys.net/20/1577/2002/.
Grocott, A., Yeoman, T. K., Nakamura, R., Cowley, S. W. H., R`eme, H., and Klecker, B.: Multi-instrument observations of the ionospheric counterpart to a bursty bulk flow in the near-Earth plasma sheet, Ann. Geophys., 22, 1061–1075, 2004, http://www.ann-geophys.net/22/1061/2004/.
Grocott, A., Yeoman, T. K., Milan, S. E., and Cowley, S. W. H.: Interhemispheric observations of the ionospheric signature of tail reconnection during IMF-northward non-substorm intervals, Ann. Geophys., 23, 1763–1770, 2005,
http://www.ann-geophys.net/23/1763/2005/.
Henderson, M. G., Reeves, G. D., and Murphree, J. S.: Are north-south aligned auroral structures an ionospheric manifestation of bursty bulk flows?, Geophys. Res. Lett., 25, 3737–3740, 1998. Hones Jr., E. W.: Transient phenomena in the magnetotail and their
relation to substorms, Space Sci. Rev., 23, 393–410, 1979. Hubert, B., Milan, S. E., Grocott, A., Cowley, S. W. H., and
G´erard, J.-C.: Dayside and nightside reconnection rates inferred from IMAGE-FUV and SuperDARN data, J. Geophys. Res., in press, 2006.
Jayachandran, P. T., MacDougall, J. W., Donovan, E. F., Ruo-honiema, J. M., Liou, K., Moorcroft, D. R., and St. Mau-rice, J.-P.: Substorm associated changes in the high-latitude ionospheric convection, Geophys. Res. Lett., 30, doi:10.1029/2003GL017497, 2003.
Kamide, Y., Richmond, A. D., Emery, B. A., Hutchins, C. F., Ahn, B. H., de la Beaujardi`ere, O., Foster, J. C., Heelis, R. A., Kroehl, H. W., Rich, F. J., and Slavin, J. A.: Ground-based stud-ies of ionospheric convection associated with substorm expan-sion, J. Geophys. Res., 99, 19 451–19 466, 1994.
Khan, H. and Cowley, S. W. H.: Observations of the response time of high latitude ionospheric convection to variations in the in-terplanetary magnetic field using EISCAT and IMP-8 data, Ann. Geophys., 17, 1306–1335, 1999,
http://www.ann-geophys.net/17/1306/1999/.
Khan, H., Cowley, S. W. H., Kolesnikova, E., Lester, M.,
Brit-tnacher, M. J., Hughes, T. J., Hughes, W. J., Kurth, W. S., Mc-Comas, D. J., Newitt, L., Owen, C. J., Reeves, G. D., Singer, H. J., Smith, C. W., Southwood, D. J., and Watermann, J. F.: Ob-servations of two complete substorm cycles during the Cassini Earth swing-by: Cassini magnetometer data in a global context, J. Geophys. Res., J. Geophys. Res., 106, 30 141–13 175, 2001. Kirkwood, S., Opgenoorth, H. J., and Murphree, J. S.: Ionospheric
conductivities, electric fields and currents associated with auroral substorms measured by the EISCAT radar, Planet. Space Sci., 36, 1359–1380, 1988.
Lester, M.: HF coherent scatter radar observations of ionospheric convection during magnetospheric substorms, Adv. Polar Upper Atmos. Res., 14, 179–201, 2000.
Lester, M., Milan, S.E., Besser, V., and Smith, R.: A case study of HF radar spectra and 630.0 nm auroral emission in the pre-midnight sector, Ann. Geophys., 19, 327–339, 2001,
http://www.ann-geophys.net/19/327/2001/.
Liang, J., Sofko, G. J., and Frey, H. U.: Postmidnight convection dynamics during substorm expansion phase, J. Geophys. Res., 111, doi:10.1029/2005JA011483, 2006.
Lui, A. T. Y. and Kamide, Y.: A fresh perspective of the substorm current system and its dynamo, Geophys. Res. Lett., 30, 1958, doi:10.1029/2003GL017835, 2003.
Lyons, L. R., Nagai, T., Blanchard, G. T., Samson, J. C., Ya-mamoto, T., Mukai, T., Nishida, A., and Kokubun, S.: As-sociation between Geotail plasma flows and auroral poleward boundary intensifications observed by CANOPUS photometers, J. Geophys. Res., 104, 4485–4500, 1999.
McComas, D. J., Bame, S. J., Barker, P., Feldman, W. C., Phillips, J. L., Riley, P., and Griffee, J. W.: Solar Wind Electron Proton Alpha Monitor (SWEPAM) for the Advanced Composition Ex-plorer, Space Sci. Rev., 86, 563–612, 1998.
McPherron, R. L.: Growth phase of magnetospheric substorms, J. Geophys. Res., 75, 5592–5599, 1970.
McPherron, R. L.: Magnetospheric substorms, Rev. Geophys. Space Phys., 17, 657–681, 1979.
McPherron, R. L.: Physical processes producing magnetospheric substorms and magnetic storms, in: Geomagnetism, vol. 4, edited by: Jacobs, J., London: Academic Press, 593–739, 1991. McPherron, R. L., Russell, C. T., and Aubry, M.: Satellite studies of
magnetospheric substorms on August 15, 1968, 9. Phenomeno-logical models for substorms, J. Geophys. Res., 78, 3131–3149, 1973.
McWilliams, K. A., Yeoman, T. K., Sigwarth, J. B., Frank, L. A., and Brittnacher, M.: The dayside ultraviolet aurora and convec-tion responses to a southward turning of the interplanetary mag-netic field, Ann. Geophys., 19, 701–721, 2001,
http://www.ann-geophys.net/19/701/2001/.
Mende, S. B., Heetderks, H., Frey, H. U., Lampton, M., Geller, S. P., Habraken, S., Renotte, E., Jamar, C., Rochus, P., Spann, J., Fuselier, S. A., Gerard, J.-C., Gladstone, R., Murphree, S., and Cogger, L.: Far ultraviolet imaging from the IMAGE spacecraft, 1. System design, Space Sci. Rev., 91, 243–270, 2000a. Mende, S. B., Heetderks, H., Frey, H. U., Lampton, M., Geller, S.
P., Abiad, R., Segmund, O. H. W., Tremsin, A. S., Span, J., Dougani, H., Fuselier, S. A., Magoncelli, A. L., Bumala, M. B., Murphree, S., and Trondsen, T.: Far ultraviolet imaging from the IMAGE spacecraft, 2. Wideband FUV imaging , Space Sci. Rev., 91, 271–285, 2000b.