HAL Id: hal-00317908
https://hal.archives-ouvertes.fr/hal-00317908
Submitted on 7 Mar 2006
HAL is a multi-disciplinary open access
archive for the deposit and dissemination of
sci-entific research documents, whether they are
pub-lished or not. The documents may come from
teaching and research institutions in France or
abroad, or from public or private research centers.
L’archive ouverte pluridisciplinaire HAL, est
destinée au dépôt et à la diffusion de documents
scientifiques de niveau recherche, publiés ou non,
émanant des établissements d’enseignement et de
recherche français ou étrangers, des laboratoires
publics ou privés.
Comparison of a NLOM data assimilation product to
direct measurements in the Antarctic Polar Frontal
Zone: a case study
M. Losch, R. Schukay, V. Strass, B. Cisewski
To cite this version:
M. Losch, R. Schukay, V. Strass, B. Cisewski. Comparison of a NLOM data assimilation product
to direct measurements in the Antarctic Polar Frontal Zone: a case study. Annales Geophysicae,
European Geosciences Union, 2006, 24 (1), pp.3-6. �hal-00317908�
www.ann-geophys.net/24/3/2006/ © European Geosciences Union 2006
Annales
Geophysicae
Geo
Com
munica
tes
Comparison of a NLOM data assimilation product to direct
measurements in the Antarctic Polar Frontal Zone: a case study
M. Losch1, R. Schukay2, V. Strass1, and B. Cisewski11Alfred-Wegener-Institut f¨ur Polar- und Meeresforschung, Bremerhaven, Germany 2Universit¨at Bremen, Germany
Received: 3 November 2005 – Accepted: 3 February 2006 – Published: 7 March 2006
Abstract. A comparison of the Naval Research Lab
Lay-ered Ocean Model (NLOM) nowcast fields with independent in-situ observations from a cruise in the Polar Frontal Zone of the Atlantic Sector of the Southern Ocean is presented. NLOM sea surface temperature fields can be used to deter-mine the position of fronts and individual eddies, whereas the analyzed sea surface height appears to be out of phase. It is suggested that this dynamical inconsistency is caused by a low data coverage for assimilation at the time of the cruise in combination with the data assimilation technique, that treats sea surface height and sea surface temperature data indepen-dently.
Keywords. Oceanography: general (Descriptive and re-gional oceanography; Numerical modeling; Ocean predic-tion)
1 Introduction
Ocean model data assimilation and operational prediction of the mesoscale ocean circulation has reached a state of ma-turity that allows to make near real-time products publicly available. A few examples are: MODAS (Fox et al., 2002), FOAM (Bell et al., 2000), DIADEM/TOPAZ (http://www. mersea.eu.org), MERCATOR (http://www.mercator-ocean. fr), BLUElink (Oke et al., submitted, (2005)1, see also http: //www.marine.csiro.au/bluelink), and the NLOM data assim-ilation and prediction (Smedstad et al., 2003; Shriver et al., 2005). These products are not only interesting for their pri-mary purpose, military applications, but also for the scientific community, for instance, as a tool to guide research. Correspondence to: M. Losch
(mlosch@awi-bremerhaven.de)
1Oke, P. R., Schiller, A., Griffin, D. A., and Brassington, G. B.: Ensemble Data Assimilation for an Eddy-Resolving Ocean Model, Quart. J. Roy. Meteor. Soc., 2005.
In this note we report a scientific application of an ocean nowcast/forecast product and we point out a few difficulties that arose during our study. Specifically, we had intended to use sea surface height (SSH) and sea surface tempera-ture (SST) nowcasts and forecasts of the 1/16◦global Naval Research Lab (NRL) Layered Ocean Model NLOM (Smed-stad et al., 2003) to find a stable mesoscale eddy in the At-lantic sector of the Antarctic Polar Frontal Zone (PFZ) for an iron fertilization experiment. However, during the cruise it quickly became clear that the NLOM SSH data was in-consistent with in-situ observations. In the following we de-scribe data sources and the assimilation system in Sect. 2, investigate the inconsistencies in Sect. 3, and offer a plausi-ble explanation in the last section.
2 Observations and model data
2.1 European Iron Fertilization EXperiment: EIFEX Based on in-situ measurements by a conductivity-tempera-ture-depth (CTD) sonde and a ship mounted Acoustic Doppler Current Profiler (ADCP) and satellite altimetry, a mesoscale, cyclonic eddy in the South Atlantic with its center near 49◦240S and 02◦150E was chosen as the experimental site for the European Iron Fertilization Experiment (EIFEX). For the experiment, a patch within the eddy was fertilized with dissolved iron and subsequently the ecosystem response was monitored.
Throughout the experiment both hydrographic and dy-namic parameters were measured at CTD stations inside and outside the fertilized patch and along the ship track in a re-gion extending from approximately 1◦E to 4◦E and 48◦S to 51◦S. Many measurements covered the water column down to 500 m depth. Here, we use measurements spanning the period from 8 February (day 1) to 16 March 2004 (day 38).
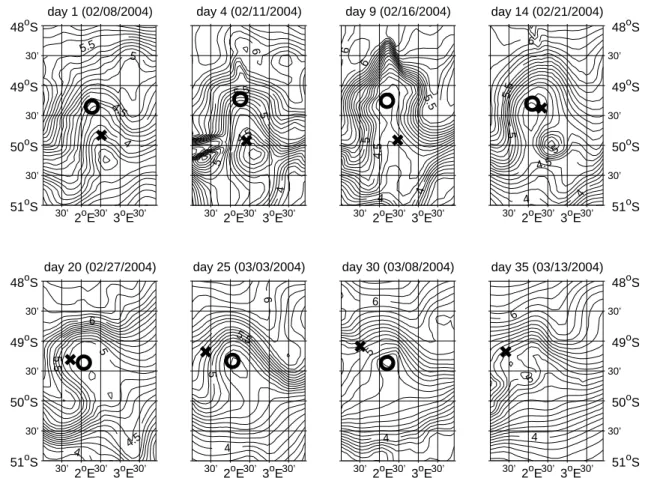
4 M. Losch et al.: NLOM in the polar frontal zone day 1 (02/08/2004) −70 −50 30’ 2oE 30’ 3oE 30’ 51oS 30’ 50oS 30’ 49oS 30’ 48oS day 4 (02/11/2004) − 70 − 50 30’ 2oE 30’ 3oE 30’ day 9 (02/16/2004) −70 −60 − 60 30’ 2oE 30’ 3oE 30’ day 14 (02/21/2004) − 70 −60 30’ 2oE 30’ 3oE 30’ 51 o S 30’ 50oS 30’ 49oS 30’ 48oS day 20 (02/27/2004) −70 −70 −60 30’ 2oE 30’ 3oE 30’ 51oS 30’ 50oS 30’ 49oS 30’ 48oS day 25 (03/03/2004) −80 −70 − 60 30’ 2oE 30’ 3oE 30’ day 30 (03/08/2004) −80 −70 − 60 30’ 2oE 30’ 3oE 30’ day 35 (03/13/2004) −80 −60 30’ 2oE 30’ 3oE 30’ 51 o S 30’ 50oS 30’ 49oS 30’ 48oS
Fig. 1. NLOM SSH, contour interval is 2.5 cm. The circles represent the eddy centers estimated from observed velocities, the crosses the
eddy centers from the model velocities. The eddy center on day 35 could not be determined from observations.
Finding a stable eddy was crucial for the success of the experiment, because only such a feature ensures min-imal dispersion of the fertilized patch in the highly vari-able PFZ. Daily satellite altimetry images from http:// ccar.colorado.edu/∼realtime/gsfc global-real-time ssh/ were
used to identify and monitor a suitable eddy both prior to the cruise and during the cruise. The same data source served for posterior comparisons with model and in-situ data. To ob-tain also forecasts of the future development of the regional eddy field, we tried to use output from a sophisticated data assimilation system that is operated by the Naval Research Laboratory (Smedstad et al., 2003) and is publicly available via the world wide web.
2.2 NLOM
The 1/16◦global Naval Research Lab (NRL) Layered Ocean Model NLOM is a daily operational product of the Naval Oceanographic Office (NAVOCEANO) with atmospheric forcing from the Navy Operational Global Atmospheric Prediction System (NOGAPS) and assimilation of SST and satellite altimeter data obtained via the NAVOCEANO
Altimeter Data Fusion Center. Both model and data assimilation schemes are described in Smedstad et al. (2003). The ocean model component is a layered model with six vertical layers and a very high horizontal resolution. SSH data from TOPEX/POSEIDON, its replacement JASON1, Geosat-Follow-On (GFO), and ERS-2 is assimilated using an optimum interpolation (OI) based scheme, a statisti-cal inference technique for vertistatisti-cal mass field updates, and geostrophic balance for velocity updates. The NLOM SST is relaxed to the Modular Ocean Data Assimilation Sys-tem (MODAS) SST analysis. Real-time and archived re-sults from the model can be viewed at the NRL web site http://www.ocean.nrlssc.navy.mil/global nlom.
For the duration of the iron fertilization experiment EIFEX, daily nowcasts of SST, SSH, and horizontal ve-locities in the surface layer were downloaded from ftp:// ftp7300.nrlssc.navy.mil/pub/smedstad/dailyout. (For the pe-riod 12–14 February however, there is a gap of 3 days in the time series because of server availability.)
day 1 (02/08/2004) 4 4.5 5 5.5 30’ 2oE 30’ 3oE 30’ 51oS 30’ 50oS 30’ 49oS 30’ 48oS day 4 (02/11/2004) 4 4.5 5 5 5.5 6 30’ 2oE 30’ 3oE 30’ day 9 (02/16/2004) 4 4 4.5 5 5.5 6 6 30’ 2oE 30’ 3oE 30’ day 14 (02/21/2004) 4 4 4.5 5 5 5.5 6 30’ 2oE 30’ 3oE 30’ 51 o S 30’ 50oS 30’ 49oS 30’ 48oS day 20 (02/27/2004) 4 4.5 5 5.5 6 30’ 2oE 30’ 3oE 30’ 51oS 30’ 50oS 30’ 49oS 30’ 48oS day 25 (03/03/2004) 4 5 5.5 6 30’ 2oE 30’ 3oE 30’ day 30 (03/08/2004) 4 5 6 30’ 2oE 30’ 3oE 30’ day 35 (03/13/2004) 4 5 6 30’ 2oE 30’ 3oE 30’ 51 o S 30’ 50oS 30’ 49oS 30’ 48oS
Fig. 2. Same as Figure 1, but for NLOM SST, contour interval is 0.1◦C.
3 Results
Figures 1 and 2 show a time series of modeled SSH and SST, respectively. Also shown are the positions of the eddy centers, defined as the point where the horizontal veloci-ties vanish, and estimated separately from both observed ADCP velocities and model data. The modeled SSH pattern agrees with the modeled eddy position, whereas the modeled SST pattern appears to be consistent with the observed eddy position. In order to quantify this impression, we estimate the position of the eddy again from the position of the local min-ima of SSH and SST separately and determine the distance from the observed eddy centers: The average of this distance is 51 km for SSH and 30 km for SST. In other words, mod-eled SST and SSH pattern appear to be inconsistent with each other in this specific region and time.
NLOM has a limited vertical resolution, so that due to layer-outcropping in the Southern Ocean the top layer in the PFZ may have a thickness of the order of 100 to 200 m (O. M. Smedstad, personal communication). Therefore the surface layer velocities are compared to vertical averages of the ADCP data that represent the circulation over the top 150 m. For a direct comparison the observed velocities from a centered time window of 5 days are interpolated to
1 5 8 9 10 16 18 25 31 1 4 8 9 10 11 12 13 14 15 1617 18 20 21 22 23 24 27 28 29 313233 35 36 37 38 NLOM observed 1oE 15’ 30’ 45’ 2oE 15’ 30’ 45’ 3oE 50oS 45’ 30’ 15’ 49oS
Fig. 3. Displacement of eddy center as estimated from direct
veloc-ity observations (circles) and model data (crosses). The annotations refer to the experiment day. Day 1 is 8 February 2004.
6 M. Losch et al.: NLOM in the polar frontal zone the NLOM model grid. Day 1 corresponds to 8 February
2004. The correlation between modeled and observed ve-locities is low for days 3 and 9 with coefficients of determi-nation (square of correlation coefficients) of r2= −0.06 and r2=0.13, respectively and higher for days 12 (r2=0.44) and 15 (r2=0.67).
In Fig. 3 the positions of of the observed eddy and of the modeled eddy are shown for each day for which it was pos-sible to estimate them in a unique way from the velocity fields. The observed eddy center remains nearly stationary (the maximum displacement is 24.8 km), while the eddy of the NLOM model moves through the domain from the south-east corner to the northwest corner covering a distance of 114.5 km in 38 days. For a few days (day 12, to 18, that is, 19–25 February, except for day 13, which appears to be an outlier), the modeled eddy positions almost coincide with the observed positions, possibly by chance, as the modeled eddy passes the position of the observed eddy.
This explains why the modeled velocity field agrees better with observations on days 12 and 15 than on days 3 and 9.
An independent estimate of the eddy’s position is obtained from the daily satellite altimetry images available at http:// ccar.colorado.edu/∼realtime/gsfc global-real-time ssh/: The
local minimum of the sea level anomaly agrees with in-situ observations (not shown).
4 Discussion and Conclusion
NLOM SST data describes consistently the mesoscale pat-tern in the PFZ for the duration of the EIFEX cruise. Be-cause of the low vertical resolution in NLOM, all but one layer outcrop south of the PFZ, making the model largely barotropic (H. Hurlburt, personal communications). It is re-assuring to see that the model still has some skill just north of this area. However, we found that modeled SSH was not consistent with observations. At the same time modeled SST and SSH appear to be inconsistent with each other pointing towards a deficiency in the assimilation scheme.
A close inspection of the available satellite data suggests a possible reason for the discrepancy between model and ob-servations. Satellite altimetry data are essential to keep the almost entirely non-deterministic features and eddies of the model on track. From the end of February to the end of March (i.e. during EIFEX) only a few satellite altimetry data were available: ERS-2 data were only available in the north-east Atlantic, JASON-1 had data outages 15–20 February and 24–26 February, and GFO data were only available un-til 23 February (see http://www7320.nrlssc.navy.mil/global nlom/globalnlom/navo/arc list SATELLITES.html). Also satellite altimetry is not assimilated south of 50◦S by choice (O. M. Smedstad, personal communication), so that part of the EIFEX experimental region did not “feel” any direct effect of SSH assimilation. However, data outages alone
cannot explain all differences between in-situ data and model product. For example, Fig. 3 suggests that the NLOM eddy center does not coincide with the observed position of the eddy before 15 February. During the first data outage the NLOM eddy moves even closer to the observed position.
In NLOM, SST and SSH are assimilated separately and with different methods (relaxation for SST with a short e-folding scale of 3 h and an incremental updating technique for SSH), so that in principle, model SST and SSH need not be dynamically consistent immediately after the analy-sis step. A (more expensive) multivariate data assimilation scheme could improve this situation. In general, observed SSH anomalies and observed SST fields can be expected to have consistent patterns. However, if SSH data are sparse and predominantly SST observations are assimilated, as in the described case, the model may adjust SST quickly, but SSH correction may take a few model hours, resulting in persis-tently dynamically inconsistent SST and SSH fields. There-fore, we recommend the concurrent use of all (SSH, SST, and velocity) fields of the NLOM product. This procedure avoids the misinterpretation of individual fields that may be temporarily dynamically inconsistent due to a combination of data availability and assimilation technique.
The NLOM assimilation system has been highly success-ful in many regions of the ocean and model validation tests are impressive (Smedstad et al., 2003; Shriver et al., 2005). However, we found an example of the limitations of the system, mostly determined by its specific data assimilation scheme in combination with poor data availablity. In spite of the enormous progress that has been made over the last decade, optimal data assimilation techniques still require large computer resources and a lot of manpower. Many chal-lenges remain for the future.
Acknowledgements. We thank the Naval Research Laboratory for
making the NLOM data publicly available. Fruitful discussions with and numerous helpful comments from O. M. Smedstad and Harley E. Hurlburt are greatly appreciated.
Topical Editor N. Pinardi thanks a referee for her/his help in evaluating this paper.
References
Bell, M. J., Forbes, R. M., and Hines, A.: Assessment of the FOAM Global Data Assimilation System for Real-Time Ocean Forecast-ing, J. Mar. Sys., 25, 1–22, 2000.
Fox, D. N., Teague, W. J., Barron, C. N., Carnes, M. R., and Lee, C. M.: The Modular Ocean Data Assimilation System (MODAS), J. Atmos. Oceanic Technol., 19, 240–252, 2002. Shriver, J. F., Hurlburt, H. E., Smedstad, O. M., Wallcraft, A. J.,
and Rhodes, R. C.: 1/32◦real-time global ocean prediction and value-added over 1/16◦resolution, J. Mar. Sys., accepted, 2005. Smedstad, O. M., Hurlburt, H. E., Metzger, E. J., Rhodes, R. C.,
Shriver, J. F., Wallcraft, A. J., and Kara, A. B.: A real-time 1/16◦ global ocean nowcast/forecast system., J. Mar. Sys., 40-41, 341– 361, 2003.