Phenotyping malignant hyperthermia susceptibility by measuring
halothane-induced changes in myoplasmic calcium concentration
in cultured human skeletal muscle cells
T. Girard
1*, S. Treves
1, K. Censier
1, C. R. Mueller
2, F. Zorzato
1 3and A. Urwyler
11
Departments of Anaesthesiology and Research, Kantonsspital/University of Basel, CH-4031 Basel,
Switzerland.
2Institut fuer Humangenetik, Biozentrum, University of Wuerzburg, D-97074 Wuerzburg,
Germany.
3Department of Experimental and Diagnostic Medicine, General Pathology Section,
University of Ferrara, Via Borsari 46, I-44100 Ferrara, Italy.
*Corresponding author
Background. Malignant hyperthermia (MH) is a potentially lethal disease triggered by volatile anaesthetics and succinylcholine in genetically predisposed individuals. Because of the heteroge-netic nature of MH, a simple geheteroge-netic-based diagnostic test is not feasible and diagnosis requires an invasive open muscle biopsy followed by the in vitro contracture test (IVCT). Our aim was to establish if measurements of halothane-induced increases in intracellular calcium ion concen-tration [Ca2+]
iin cultured human skeletal muscle cells can be used to phenotype MH
suscepti-bility and if different mutations in the ryanodine receptor (RYR1) gene affect halothane-induced increases in [Ca2+]
i.
Methods. Primary cultures of human skeletal muscle cells were established from 54 individuals diagnosed by the IVCT according to the protocol of the European MH Group as: MH suscep-tible (n=22), MH negative (n=18) or MH equivocal (n=14). All individuals were screened for the presence of the most common mutations in the RYR1 gene. [Ca2+]
iwas measured by
¯uores-cent digital microscopy using fura-2/AM in 10 cells from each patient at ®ve different halothane concentrations.
Results. The halothane-induced increase in [Ca2+]
i differed signi®cantly between the three
diagnostic groups. Different mutations of the RYR1 gene did not have a speci®c impact on halothane-induced increases in [Ca2+]
i.
Conclusions. Measurements of [Ca2+]
iin human skeletal muscle cells can be used to
pheno-type MH susceptibility; however, we did not observe a speci®c effect of any mutation in the RYR1 gene on the halothane-induced increase in [Ca2+]
i.
Br J Anaesth 2002; 89: 571±9
Keywords: anaesthesia; anaesthetics volatile, halothane; ions, calcium; muscle, skeletal, myoblasts
Accepted for publication: June 11, 2002 Malignant hyperthermia (MH) is a pharmacogenetic disease triggered by halogenated anaesthetics and succinylcholine in predisposed individuals.1±3 The incidence of MH
epi-sodes is about 1 in 15 000 anaesthetics in children and 1 in 50 000 in adults, although these ®gures may underestimate the true prevalence, since many reactions occur in patients who have previously come into contact with trigger agents and had uneventful anaesthesia.4 5Symptoms characterizing
an impending MH crisis include a rapid and sustained increase in body temperature, skeletal muscle rigidity, acidosis, rhabdomyolysis and tachycardia6or any
combin-ation of the above (see review by Gronert and colleagues3).
If such a reaction is not recognized in its early phases and treatment quickly initiated, the patient is likely to die.
In their daily lives MH-predisposition does not pose a threat to MH-susceptible (MHS) individuals, so the major goal of MH diagnostics is to identify susceptible individuals before the administration of trigger agents.7 8 To date the
gold standard of MH diagnosis is the in vitro contracture test (IVCT). This invasive procedure involves an open muscle biopsy and in vitro challenge of muscle strips with halothane or caffeine. According to the guidelines of the
European MH Group, patients are then diagnosed as MHS or MH negative (MHN) on the basis of contractile threshold and sensitivity of the muscle bundles to halothane and caffeine. If contracture is achieved only with either caffeine or halothane, the patient is diagnosed as MH equivocal (MHE).6 9
The underlying cause of MH is an abnormality in skeletal muscle calcium metabolism.10 11 Therefore, alterations in
proteins involved in the regulation of the intracellular calcium concentration ([Ca2+]
i), such as the calcium pump,
the calcium release channel or other proteins implicated in excitation±contraction coupling, could potentially cause
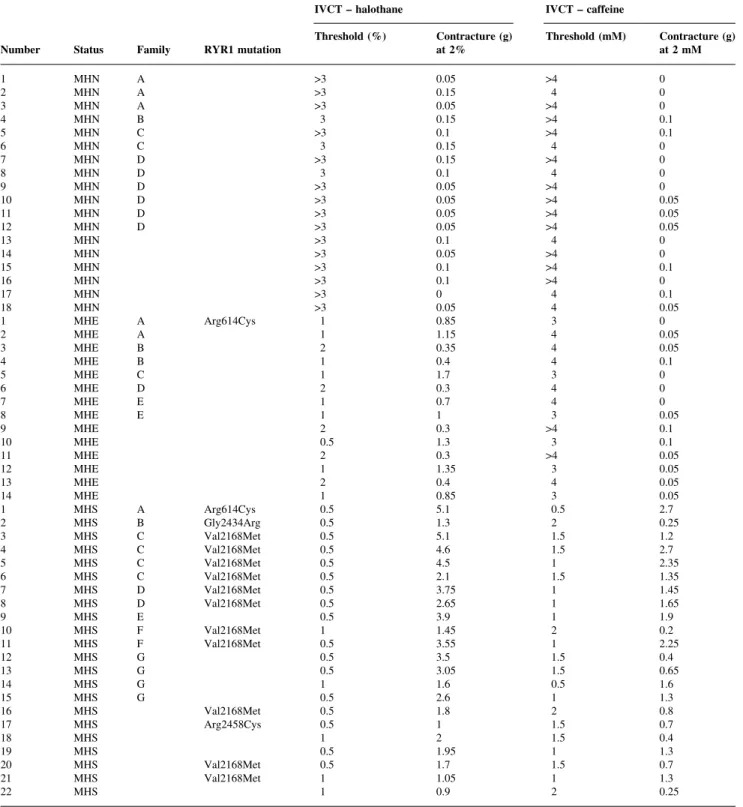
Table 1 Family of origin (a capital letter indicates members belonging to the same family, the absence of a letter indicates single members of a family), identi®cation of malignant hyperthermia (MH)-linked ryanodine receptor (RYR1) mutation and in vitro contracture test (IVCT) of muscle biopsies. MHN=MH negative; MHS=MH susceptible; MHE=MH equivocal
IVCT ± halothane IVCT ± caffeine
Number Status Family RYR1 mutation Threshold (%) Contracture (g)at 2% Threshold (mM) Contracture (g)at 2 mM
1 MHN A >3 0.05 >4 0 2 MHN A >3 0.15 4 0 3 MHN A >3 0.05 >4 0 4 MHN B 3 0.15 >4 0.1 5 MHN C >3 0.1 >4 0.1 6 MHN C 3 0.15 4 0 7 MHN D >3 0.15 >4 0 8 MHN D 3 0.1 4 0 9 MHN D >3 0.05 >4 0 10 MHN D >3 0.05 >4 0.05 11 MHN D >3 0.05 >4 0.05 12 MHN D >3 0.05 >4 0.05 13 MHN >3 0.1 4 0 14 MHN >3 0.05 >4 0 15 MHN >3 0.1 >4 0.1 16 MHN >3 0.1 >4 0 17 MHN >3 0 4 0.1 18 MHN >3 0.05 4 0.05 1 MHE A Arg614Cys 1 0.85 3 0 2 MHE A 1 1.15 4 0.05 3 MHE B 2 0.35 4 0.05 4 MHE B 1 0.4 4 0.1 5 MHE C 1 1.7 3 0 6 MHE D 2 0.3 4 0 7 MHE E 1 0.7 4 0 8 MHE E 1 1 3 0.05 9 MHE 2 0.3 >4 0.1 10 MHE 0.5 1.3 3 0.1 11 MHE 2 0.3 >4 0.05 12 MHE 1 1.35 3 0.05 13 MHE 2 0.4 4 0.05 14 MHE 1 0.85 3 0.05 1 MHS A Arg614Cys 0.5 5.1 0.5 2.7 2 MHS B Gly2434Arg 0.5 1.3 2 0.25 3 MHS C Val2168Met 0.5 5.1 1.5 1.2 4 MHS C Val2168Met 0.5 4.6 1.5 2.7 5 MHS C Val2168Met 0.5 4.5 1 2.35 6 MHS C Val2168Met 0.5 2.1 1.5 1.35 7 MHS D Val2168Met 0.5 3.75 1 1.45 8 MHS D Val2168Met 0.5 2.65 1 1.65 9 MHS E 0.5 3.9 1 1.9 10 MHS F Val2168Met 1 1.45 2 0.2 11 MHS F Val2168Met 0.5 3.55 1 2.25 12 MHS G 0.5 3.5 1.5 0.4 13 MHS G 0.5 3.05 1.5 0.65 14 MHS G 1 1.6 0.5 1.6 15 MHS G 0.5 2.6 1 1.3 16 MHS Val2168Met 0.5 1.8 2 0.8 17 MHS Arg2458Cys 0.5 1 1.5 0.7 18 MHS 1 2 1.5 0.4 19 MHS 0.5 1.95 1 1.3 20 MHS Val2168Met 0.5 1.7 1.5 0.7 21 MHS Val2168Met 1 1.05 1 1.3 22 MHS 1 0.9 2 0.25
MH. Studies into the molecular mechanisms underlying this disease have demonstrated that the ryanodine receptor (RYR1) gene on human chromosome 19q is the primary locus of MH.2 7 12Mutation screening has identi®ed more
than 30 mutations in the RYR1 gene so far. Although approximately 50% of MH families have mutations in the RYR1 gene, linkage studies have revealed that this is a heterogenetic disease.7 12±16
The aim of the present study was to determine if halothane-induced increases in [Ca2+]
i in human skeletal
muscle cells can be used to phenotype MH susceptibility and if different mutations in the RYR1 gene have a distinct effect on the halothane-induced increases in [Ca2+]
i.
Methods
Study protocol
In order to determine if halothane-induced increases in [Ca2+]
i in human skeletal muscle cells can be used to
phenotype MH susceptibility, we compared the results obtained by the IVCT with results obtained by measuring the halothane-induced increase in [Ca2+]
i in cultured
skeletal muscle cells. Patients included in the study were tested by the IVCT according to the protocol of the European MH Group.9On the same day, primary skeletal
muscle cell cultures were established from surplus frag-ments of the muscle biopsies. For each patient, increases in [Ca2+]
iwere measured in 10 muscle cells after exposure to
3.9, 4.6, 5.7, 7.2 or 8.6 mM halothane. These concentrations were chosen because in a previous study17we found that the
biggest differences in [Ca2+]
ibetween cells from MHS and
MHN individuals were obtained in this range of halothane concentrations.
In order to determine if different mutations have a different effect on halothane-induced increases in [Ca2+]
i,
all patients were screened for nine of the most common mutations in the RYR1 gene (described below) and the increases in [Ca2+]
iin subjects carrying different mutations,
as well as in subjects carrying the same mutation in the RYR1 gene, were analysed and compared.
Patient selection
We selected 54 patients from 26 families with a positive history of MH without clinical signs of neuromuscular disease. The age range of the patients was 8±59 yr. Twenty-two patients were diagnosed as MHS, 18 as MHN and 14 as MHE by IVCT. Patients were classi®ed as MHS if a contracture force >0.2 g was elicited by at least 2% halothane and 2 mM caffeine, as MHE if a contracture force >0.2 g was elicited only by either caffeine or halothane, and MHN if contractures >0.2 g were not reached with either trigger agent. The characteristics of the individuals involved in this study, including contractures obtained from the muscle strips during the IVCT, family of origin and mutation found are given in Table 1.
The protocol for the study was approved by the University of Basel Hospital Ethics Committee and written informed consent was obtained from patients.
Materials
Dulbecco modi®ed Eagle (DME) medium containing 4.5 mg ml±1 glucose, fetal calf serum (FCS), horse serum,
penicillin G and streptomycin was purchased from Life Technologies Ltd, Paisley, UK. Insulin was purchased from Eli Lilly and Co., Indianapolis, IN, USA. Cell culture material was from Becton Dickinson GmbH, Heidelberg, Germany. Halothane was from Halocarbon Labs, Inc., Hackensack, NJ, USA. The mammalian blood DNA isol-ation kit and Taq polymerase and DNA restriction enzymes were from Roche Molecular Biochemicals (Basel, Switzerland). The kit for DNA isolation from tissue was from Machery-Nagel GmbH, DuÈren, Germany. The poly-merase chain reaction (PCR) puri®cation kit was from Qiagen GmbH, Hilden, Germany. Fura-2/AM and ionomy-cin were from Sigma Chemical Co., St Louis, MO, USA. Primers were from Microsynth GmbH, Balgach,
Fig 1 Average peak change (D) in [Ca2+]
iinduced by different halothane
concentrations in human skeletal muscle cells. Single-cell intracellular calcium measurements were performed with the ¯uorescent calcium indicator fura-2/AM, using a Zeiss imaging system attached to an Axiovert ¯uorescent microscope, as described in the Methods section. Results are mean (SEM); the number of cells measured ranged between 132 and 246 for each halothane concentration and diagnostic group. The halothane-induced increase in [Ca2+]
iwas signi®cantly different between
the three diagnostic groups (P<0.001) and between the different halothane concentrations (P<0.0001; repeated measurements ANOVA). Fisher's PLSD post-hoc test revealed signi®cant differences (P<0.001) between all halothane concentrations, with the exception of 3.9 vs 4.6 mM.
Switzerland. All other chemicals were reagent grade or of highest available grade.
Human skeletal muscle cell cultures
Primary human muscle cell cultures were established from surplus fragments taken from biopsies of patients undergo-ing diagnostic IVCT as described previously.17Cells were
grown in DME, 10% horse serum, insulin 5 ng ml±1, 2 mM
glutamine, antibiotics and 7 mM HEPES, pH 7.4 (pro-liferative medium) under standard cell culture conditions. For cryopreservation, about 106cells were resuspended in
DME containing 40% FCS and 10% DMSO and were stored in liquid nitrogen.
[Ca
2+]
i
measurements
For measurements of [Ca2+]
i, cells were trypsinized and
transferred from tissue culture ¯asks to glass coverslips and allowed to grow in proliferative medium until groups of
cells were visible. We have previously demonstrated that under these culture conditions the cells acquire skeletal-muscle-speci®c proteins such as sarcomeric a-actinin and type-1 RYR,17although they do not fully differentiate into
multinuclear myotubes. Such primary cultures exhibit a degree of variability in the maturity of individual cells.
Cells to be tested were loaded with the ¯uorescent calcium indicator fura-2/AM. Single-cell calcium measure-ments using ¯uorescence microscopy were performed on 10 cells before and after the addition of halothane. A new coverslip containing fura-2/AM-loaded cells was used for each halothane concentration. For each experiment a total of 72 digital images were recorded at excitations of 340 and 380 nm and the ratio calculated, as per our previous study.17
The values obtained during the ®rst 10 cells (i.e. before the application of halothane) were used to calculate the resting [Ca2+]
i. Values were then taken during halothane perfusion
as well as after addition of EGTA/ionomycin and calcium ions to obtain Rmin(the value obtained in the presence of
EGTA) and Rmax(the value obtained in the presence of high
Table 2 Halothane-induced changes (D) in [Ca2+]
i, 340/380 nm ratio and integral calcium in primary cultures derived from MHN individuals: de®nition of
cut-off values Percentile Halothane concentration (mM) n 50th 75th 90th 95th 97th D [Ca2+] i 3.9 198 31 50.6 85.1 110.3 117.2 4.6 198 47 74 101 127 137.9 5.7 205 72.7 105.5 167 203.5 230.6 7.2 178 106 158.6 239.2 310.4 507.2 8.6 173 139.5 265.6 391.4 513.8 570.5 D 340/380 nm ratio 3.9 198 0.07 0.09 0.13 0.15 0.176 4.6 198 0.09 0.13 0.17 0.201 0.233 5.7 205 0.13 0.187 0.27 0.347 0.409 7.2 178 0.2 0.28 0.35 0.376 0.43 8.6 173 0.25 0.422 0.57 0.677 0.733 Integral calcium 3.9 220 2.5 4.8 7.5 9.1 9.9 4.6 209 3.8 7.6 10.4 11.7 12.8 5.7 206 4.3 9.6 12 15.3 18.3 7.2 216 8.7 13.5 22 28.7 31.1 8.6 206 13.1 23.3 34.7 40.9 45.6
Table 3 Diagnosis of MH susceptibility by single-cell calcium measurements (changes in (D)[Ca2+]
i, 340/380 nm ratio and integral calcium) compared with
in vitro contracture test (IVCT)-based diagnosis. MHN=MH negative; MHS=MH susceptible; MHE=MH equivocal Diagnosis by IVCT MHN MHE MHS (n=18) (n=14) (n=22) D [Ca2+] i>95th percentile 1 (6%) 4 (29%) 15 (68%) D [Ca2+] i97th percentile 0 2 (14%) 11 (50%) D ratio >95th percentile 1 (6%) 5 (36%) 15 (68%) D ratio >97th percentile 1 (6%) 4 (29%) 13 (59%)
Integral calcium >95th percentile 2 (11%) 7 (50%) 12 (55%)
calcium after the addition of ionomycin). Each run lasted approximately 6 min, including the time taken to run the calibration at the end of the experiment. Halothane in DMSO was administered at the indicated concentrations from a gas-tight vial by means of a roller pump. Its actual concentration was veri®ed by gas chromatography in several test runs using ®xed ¯ow rates, temperature and tubing. Calibration was performed using the EGTA/ ionomycin/manganese chloride method.18 The changes in
¯uorescence were converted into [Ca2+]
iusing the formula
[Ca2+]
i=[kD3(R±Rmin)/(Rmax±R)] 3Sf2/Sb2, where kD
(dis-sociation constant) of fura-2/AM was assumed to be 225 nM and Sf2 and Sb2 are the ¯uorescent values for Ca2+free (f)
and bound (b) of the indicator. These values are a constant. The ratios were analysed and converted into [Ca2+]
i
values (nM) using a programmable database application (Omnis 7/3 from Blyth Holding Inc., Suffolk, UK). The increase in [Ca2+]
i was determined by the difference
between resting [Ca2+]
iand peak [Ca2+]iafter the addition
of halothane. The whole transient elicited by a given halothane concentration was used to calculate the integral calcium, which re¯ects the total amount of calcium released.
Mutation screening
Screening for the presence of nine of the most frequent MH-linked mutations (Arg163Cys, Gly341Arg, Arg614Cys, Arg614Leu, Arg2163Cys, Val2168Met, Gly2434Arg,
Arg2458Cys, Arg2458His) was performed by genomic DNA PCR ampli®cation followed by restriction enzyme digestion and polyacrylamide gel electrophoresis. Total genomic DNA was isolated from either peripheral blood or muscle fragments not used for IVCT. PCR conditions and primer sequences were as described previously.19
Statistical analysis
The [Ca2+]
imeasurements from the three diagnostic groups
were compared using repeated measurements ANOVA. Within each halothane concentration, the results from the three diagnostic groups were compared using Fishers's protected least signi®cant difference (PLSD) post-hoc test.
To determine normal [Ca2+]
ivalues, all measurements of
the MHN cells were pooled and median values, as well as 75th, 90th, 95th, 97th and 99th percentiles, were calculated for each halothane concentration. These percentile values were used to de®ne different cut-off values. Median values were calculated for each individual at the ®ve halothane concentrations and compared with the cut-off values de®ned by the MHN population. If the cut-off value was exceeded at any concentration of halothane, the patient was classi®ed as MHS.
StatView (SAS Institute Inc., Cary, NC, USA) was used for statistical analysis.
Results
MH phenotyping by [Ca
2+]
i
measurements
We investigated intracellular calcium homeostasis in pri-mary skeletal muscle cells obtained from 22 individuals diagnosed as MHS, 14 individuals diagnosed as MHE and 18 individuals diagnosed as MHN by IVCT, according to the European MH Group protocol. Single-cell [Ca2+]
i
measurements were performed at the ®ve halothane con-centrations in 10 fura-2/AM-loaded cells; the ¯uorescent changes induced by halothane were converted into [Ca2+]
i
values by performing signal calibration at the end of each experiment. Some cells contracted when high intracellular calcium concentrations were reached, so the ¯uorescence signal could not be calibrated. These cells were therefore excluded from Figure 1, in which we show the peak [Ca2+]
i
induced by halothane. The results depicted in Figure 1 show that halothane-induced increases in [Ca2+]
i in primary
skeletal muscle cells differed signi®cantly between MHS, MHE and MHN individuals. The increases in [Ca2+]
iwere
dose dependent (P<0.0001; repeated measurements ANOVA; Figure 1). In addition, the increases in [Ca2+]
iin
muscle cells from MHS and MHE individuals were shifted to lower halothane concentrations when compared with cells from MHN individuals (P<0.0001; repeated measure-ments ANOVA, Figure 1). Fisher's PLSD post-hoc test revealed signi®cant differences (P<0.001) between all
Fig 2 Receiver operating characteristic (ROC) curve comparing the diagnostic results of [Ca2+]
i measurements at different cut-off values
(50±99th percentile) with IVCT diagnosis. The curve shows sensitivity and speci®city of the [Ca2+]
i measurements for the diagnosis of MH
halothane concentrations, with the exception of 3.9 vs 4.6 mM.
Cut-off values for the determination of MH susceptibility by [Ca2+]
i measurements were calculated on the basis of
results from the individuals diagnosed as MHN by the IVCT and are presented in Table 2. Using the 95th percentile as a cut-off value, MH susceptibility was diagnosed by meas-urements of [Ca2+]
iin 15 of 22 MHS patients (68%), 4 of 14
MHE patients (29%) and 1 of 18 MHN patients (6%) (Table 3). We calculated sensitivity and speci®city by comparing results obtained by the [Ca2+]
i measurements
with results obtained by the IVCT. Using the 95th percentile as a cut-off value, the speci®city was 0.94 (95% con®dence intervals [CI] 0.73 to 1.0, Table 3, Fig. 2) and the sensitivity was 0.68 (95% CI 0.45 to 0.86). Taking into account that the speci®city of the IVCT using the European MH Group protocol is 0.93,20the actual number of MHS could be 20
instead of 22. This would increase the sensitivity of [Ca2+] i
measurements to 0.75 (95% CI 0.51 to 0.91).
Effect of RYR1 gene mutations on halothane-induced
increases in [Ca
2+]
i
We next investigated whether the presence of different RYR1 gene mutations has an impact on halothane-induced [Ca2+]
itransients and whether cells from different patients
carrying the same mutation respond in a similar way. Figure 3 shows a box plot of the halothane-induced [Ca2+]
i
transients (peak [Ca2+]
i and total amount of [Ca2+]i
released) from individuals carrying four different MH-linked mutations. The increase in [Ca2+]
i is particularly
evident at halothane concentrations >5.7 mM and was irrespective of the mutation.
The halothane `trigger concentration' appears to vary between individuals with different mutations.19 21In order
to study if this is speci®c for a given mutation or a more general phenomenon, we analysed the halothane-induced peak [Ca2+]
i in cells obtained from unrelated individuals
carrying the same Val2168Met mutation. Halothane trigger concentrations and peak [Ca2+]
i were different in these
unrelated individuals (Fig. 4), suggesting that the genetic background in¯uences the halothane-induced increase in [Ca2+]
i.
Discussion
In the present report we show that halothane-induced increases in [Ca2+]
iin human skeletal muscle cells can be
used to phenotype MH susceptibility. However, our results
show that different mutations in the RYR1 gene have no speci®c effect on halothane-induced increases in [Ca2+]
i.
Measurements of halothane-induced increases in [Ca2+] iin
human skeletal muscle cells con®rmed the IVCT diagnosis of MH susceptibility in 15 of 22 MHS individuals (68%) when the 95th percentile of the values obtained from the MHN population was used as a cut-off value. Taking into account that the speci®city of the IVCT following the protocol of the European MH Group is 0.93, this could reduce the number of MHS individuals to 20, leading to an increase in the number of coinciding MHS diagnoses (15 of 20, 75%). Only one MHN individual exceeded the 95th percentile cut-off value. This discordance could be due to either a wrong IVCT diagnosis or oversensitivity of diagnosis based on measurements of halothane-induced increases in [Ca2+]
i.
In seven of 22 individuals the IVCT diagnosis of MHS could not be con®rmed by halothane-induced increases in [Ca2+]
i. This could be due to either a reduced speci®city of
the IVCT (not every MHS diagnosis can be con®rmed by molecular genetic analysis), or to an overestimation of the halothane-induced increases in [Ca2+]
iof the true `normal'
populationÐin the present study `normal' [Ca2+] i values
were obtained from individuals from MHS families, not from non-MH-linked individuals.
In this study we con®rm and extend our previous results. In fact, our earlier work was based on observations carried out on two MHS subjects and three MHN subjects while in this study we also included 14 MHE individuals, and the number of patients involved was 10 times larger. In the study by Censier and colleagues,17 we observed that the
maximum difference between MHS and MHN, as far as halothane-induced increases in [Ca2+]
i are concerned,
occurred at halothane concentrations of 5.7±9.5 mM. In addition, we con®rm that the mean increase in [Ca2+]
i of
cells from MHN individuals occurring at 8.6 mM halothane is similar to that of cells from MHS individuals at 5.7 mM halothane (203 nM vs 167 nM, respectively; P=0.269, student's t-test for unpaired samples).
The response of cells presented in our previous report17 seem to be different from those found in this
study. In the present study we examined a larger sample than previously and we believe that the values obtained are more likely to represent the MHN population. We would like to point out that it is very important to perform [Ca2+]
i measurements at several halothane
concentrations and we suggest concentrations ranging around 5.7 mM since this is the concentration where maximal differences can be observed.
Fig 3 Halothane-induced [Ca2+]
iresponse of cultured human skeletal muscle cells for four individuals. Single-cell [Ca2+]imeasurements were
performed as described in Figure 1. The box plot shows median peak D [Ca2+]
iand median total calcium release induced at each halothane
concentration, together with 10th, 25th, 75th and 90th percentiles. PanelsA,C,EandGshow the peak [Ca2+]
i; panelsB,D,FandHshow total amount
of calcium released (arbitrary units, a.u.) by halothane in individuals carrying the indicated RYR1 mutation. Mutation screening was performed as described in the Methods section.
In this study we used small fragments of tissue (2±4 mm3)
left over from muscle biopsies. We have already assessed the feasibility of obtaining primary cultures from needle biopsies (unpublished observations). This approach offers obvious physical advantages for the patients, as well as being cheaper. Obviously there are some limitations in the use of this novel approach: (i) the need for cell culture and ¯uorescent calcium imaging facilities, (ii) the fact that cells cultured from the biopsies give rise to heterogeneous cell populations that do not respond to halothane in a uniform way, (iii) not all individuals diagnosed as MHS by IVCT had an halothane-induced increase in [Ca2+]
ibeyond that of
the MHN population.
As to the future of MH diagnostics, one can envisage that individuals from families with de®ned mutations could ®rst undergo genetic testing.22 If no mutation is found, they
could undergo a skeletal muscle needle biopsy followed by measurements of halothane-induced increases in [Ca2+]
i. If
measurements of [Ca2+]
i do not reveal MH susceptibility,
then an IVCT could be performed. With this less invasive and stepwise approach, the high sensitivity of the IVCT and thus the high safety level of MH diagnostics is maintained. In fact if these criteria were used, only three of the 22 MHS individuals and seven of the 14 MHE individuals would still require the invasive IVCT. For the time being, however, all the MHN individuals would still require IVCT testing.
The common ®nal pathway for MH is the loss of the ®ne regulation of calcium homeostasis in muscle cells. The present investigation is not only potentially important from a clinical point of view, but also from a biological one. In fact, it indicates that although a variety of factors such as metabolic processes, muscle training, protein composition
Fig 4 Halothane-induced [Ca2+]
i response of cultured human skeletal muscle cells from single members of four families carrying the same
Val2168Met mutation (families D, C and F ± as given in Table 1; the individual shown in panel a was the only member of this family investigated). Median peak D [Ca2+]
iinduced by each halothane concentration, together with 10th, 25th, 50th, 75th and 90th percentile are shown in the box plot.
and enzyme activation may in¯uence the IVCT (at least as far as contracture force is concerned), there is an intrinsic `defect' in the machinery involved in [Ca2+]
ihomeostasis in
MHS individuals. Each individual may compensate for the molecular defect in a variety of ways, which may be in¯uenced by the speci®c mutation present as well as other genetic and `environmental' factors. This hypothesis is supported by the fact that the halothane-induced changes in [Ca2+]
i in cells from MHS individuals bearing the same
point mutation but with a different genetic background do not coincide, and because MHS individuals with RYR1 mutations do not undergo MHS reactions at every contact with trigger agents.4 5 Our results also show that the
penetrance of a given mutation varies between individuals. This observation would be expected in view of the fact that the RYR must assemble as a tetramer in order to function as a calcium channel. The results of this study, as well as data from IVCT, tend to favour the hypothesis that mutated channels are probably randomly distributed, giving rise to `heterogeneous' responses, but the presence of a single mutated channel is suf®cient to confer the MHS phenotype. This hypothesis is supported by our previous work,17 in
which the normal phenotype was not reconstituted by transfecting MHS cells with wild-type channels.
In conclusion, measurements of [Ca2+]
imay be useful in
increasing the accuracy of MH phenotyping and may therefore be used as a complementary method for the diagnosis of MH susceptibility.
Acknowledgements
We would like to thank Esther Schmid for performing the cell cultures. This work was supported by Swiss National Foundation grant number 32±47176.96 and by a grant by the Swiss Foundation for Neuromuscular Research and from the Department of Anaesthesia, University Hospital Kantonsspital Basel.
References
1 Denborough M. Anaesthetic deaths in a family. Lancet 1960; 2: 45 2 Denborough M. Malignant hyperthermia. Lancet 1998; 352:
1131±6
3 Gronert G, Antonigni J, Pessah I. Malignant hyperthermia. In: Miller R, ed. Anesthesia. New York: Churchill Livingstone, 2000; 1033±52
4 Bendixen D, Skovgaard LT, Ording H. Analysis of anaesthesia in patients suspected to be susceptible to malignant hyperthermia before diagnostic in vitro contracture test. Acta Anaesthesiol Scand 1997; 41: 480±4
5 Puschel K, Schubert-Thiele I, Hirth L, Benkmann HG, Brinkmann B. Malignant hyperthermia during the 13th general anaesthesia. Anaesthesist 1978; 27: 488±91
6 Larach MG, Localio AR, Allen GC, et al. A clinical grading scale to
predict malignant hyperthermia susceptibility. Anesthesiology 1994; 80: 771±9
7 MacLennan DH, Phillips MS. Malignant hyperthermia. Science 1992; 256: 789±94
8 Ording H. Diagnosis of susceptibility to malignant hyperthermia in man. Br J Anaesth 1988; 60: 287±302
9 European Malignant Hyperpyrexia Group. A protocol for the investigation of malignant hyperpyrexia (MH) susceptibility. Br J Anaesth 1984; 56: 1267±9
10 Iaizzo PA, Klein W, Lehmann-Horn F. Fura-2 detected myoplasmic calcium and its correlation with contracture force in skeletal muscle from normal and malignant hyperthermia susceptible pigs. P¯ugers Arch 1988; 411: 648±53
11 Mickelson JR, Gallant EM, Litterer LA, et al. Abnormal sarcoplasmic reticulum ryanodine receptor in malignant hyperthermia. J Biol Chem 1988; 263: 9310±5
12 McCarthy TV, Healy JM, Heffron JJ, et al. Localization of the malignant hyperthermia susceptibility locus to human chromosome 19q12±13.2. Nature 1990; 343: 562±4
13 Fujii J, Otsu K, Zorzato F, et al. Identi®cation of a mutation in porcine ryanodine receptor associated with malignant hyperthermia. Science 1991; 253: 448±51
14 Manning BM, Quane KA, Ording H, et al. Identi®cation of novel mutations in the ryanodine-receptor gene (ryr1) in malignant hyperthermia: Genotype-phenotype correlation. Am J Hum Genet 1998; 62: 599±609
15 Robinson RL, Monnier N, Wolz W, et al. A genome wide search for susceptibility loci in three european malignant hyperthermia pedigrees. Hum Mol Genet 1997; 6: 953±61
16 Jurkat-Rott K, McCarthy T, Lehmann-Horn F. Genetics and pathogenesis of malignant hyperthermia. Muscle Nerve 2000; 23: 4±17
17 Censier K, Urwyler A, Zorzato F, Treves S. Intracellular calcium homeostasis in human primary muscle cells from malignant hyperthermia-susceptible and normal individuals. Effect of overexpression of recombinant wild-type and arg163cys mutated ryanodine receptors. J Clin Invest 1998; 101: 1233±42 18 Grynkiewicz G, Poenie M, Tsien RY. A new generation of Ca2+
indicators with greatly improved ¯uorescence properties. J Biol Chem 1985; 260: 3440±50
19 Girard T, Urwyler A, Censier K, et al. Genotype-phenotype comparison of the swiss malignant hyperhermia population. Hum Mutat 2001; 18: 357±8
20 Ording H, Brancadoro V, Cozzolino S, et al. In vitro contracture test for diagnosis of malignant hyperthermia following the protocol of the European MH Group: Results of testing patients surviving fulminant mh and unrelated low-risk subjects. The european malignant hyperthermia group. Acta Anaesthesiol Scand 1997; 41: 955±66
21 Tong J, Oyamada H, Demaurex N, et al. Caffeine and halothane sensitivity of intracellular Ca2+release is altered by 15 calcium release channel (ryanodine receptor) mutations associated with malignant hyperthermia and/or central core disease. J Biol Chem 1997; 272: 26332±9
22 Urwyler A, Deufel T, McCarthy T, West S. Guidelines for molecular genetic detection of susceptibility to malignant hyperthermia. Br J Anaesth 2001; 86: 283±7
![Fig 1 Average peak change (D) in [Ca 2+ ] i induced by different halothane concentrations in human skeletal muscle cells](https://thumb-eu.123doks.com/thumbv2/123doknet/14920478.662688/3.918.80.432.71.383/average-change-induced-different-halothane-concentrations-skeletal-muscle.webp)
![Table 2 Halothane-induced changes (D) in [Ca 2+ ] i , 340/380 nm ratio and integral calcium in primary cultures derived from MHN individuals: de®nition of cut-off values Percentile Halothane concentration (mM) n 50th 75th 90th 95th 97th D [Ca 2+ ] i 3.9 19](https://thumb-eu.123doks.com/thumbv2/123doknet/14920478.662688/4.918.82.811.110.418/halothane-induced-integral-cultures-individuals-percentile-halothane-concentration.webp)
![Fig 2 Receiver operating characteristic (ROC) curve comparing the diagnostic results of [Ca 2+ ] i measurements at different cut-off values (50±99th percentile) with IVCT diagnosis](https://thumb-eu.123doks.com/thumbv2/123doknet/14920478.662688/5.918.79.436.70.422/receiver-operating-characteristic-comparing-diagnostic-measurements-different-percentile.webp)
![Fig 4 Halothane-induced [Ca 2+ ] i response of cultured human skeletal muscle cells from single members of four families carrying the same Val2168Met mutation (families D, C and F ± as given in Table 1; the individual shown in panel a was the only member o](https://thumb-eu.123doks.com/thumbv2/123doknet/14920478.662688/8.918.104.777.70.675/halothane-response-cultured-skeletal-families-carrying-mutation-individual.webp)