Optimization of the Data Acquisition and Processing using a Prior Knowledge of the
Camera Characteristics: an EFTEM Case Study
G. Lucas, and C. Hébert
Interdisciplinary Center for Electron Microscopy (CIME), Ecole Polytechnique Fédérale de Lausanne (EPFL), Lausanne, Switzerland
In transmission electron microscopy (TEM), electrons are nowadays traditionally detected using a charged-coupled device (CCD) in the case of indirect detection trough a scintillator via an optical fiber coupling, or more recently using complementary metal-oxide semiconductor (CMOS) with direct detection. In both cases the “true” image is unfortunately degraded by the non-ideal point spread function (PSF) of the detector leading to a blurring of the signal and the addition of stochastic noise components such as dark-current noise or readout-noise.
Detector performances can be assessed by the measurement of the effective gain, the conversion factor, the point spread or modulation transfer function (MTF), the noise power spectrum (NPS) and the detective quantum efficiency (DQE) [1,2]. Defective pixels can also be listed as outliers in a lookup table. On-site characterization of the detector performance can be useful for several reasons. First of all, it allows us to verify the specifications provided by the manufacturers of the devices, to compare the relative performance of different detectors and to estimate their degradation over time. Secondly it can help to optimize the data acquisition strategy for a given problem, for instance low dose experiments or high-resolution imaging. Finally this information can be used as prior knowledge for data processing algorithms.
In this work energy filtered transmission electron microscopy (EFTEM) has been used to illustrate the benefits of the knowledge of the characteristics of the detection system. EFTEM is useful technique to investigate the chemistry of materials at the nanometric scale. However such a technique is often limited by long exposition times and weak signals, in particular at high-energy losses. Images corresponding to different energy losses are sequentially recorded on the camera device, resulting in a 3-dimensional dataset {x, y, E} for which each image plane {x, y} is convolved with the PSF of the camera and each spectrum {E} with the resolution response function of the spectrometer.
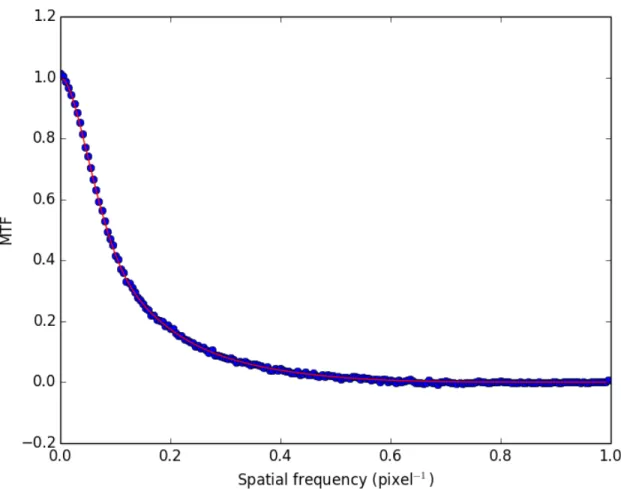
This works aims in a first step to measure the noise and contrast transfer characteristics of the Gatan US1000 camera used in our JEOL 2200FS TEM microscope in order to improve our EFTEM acquisitions. The recently developed silhouette method [2] is used for the determination of the CCD MTF. In a seconds step this works tries to apply multivariate statistical approaches such as principal component analysis [3,4] and algorithms based on statistics in order to perform the denoising of the data as well as the improvement of its spatial or spectral resolution by deconvolution techniques. The prior knowledge of the (quasi-poissonian) noise model and the MTF of the camera are embedded in the deconvolution algorithms in order to perform the regularization of the solutions in a realistic way. The data processing procedure is demonstrated on a simulated dataset providing a ground truth for exploring the applications, limits and eventual pitfalls of the algorithms under known noise levels and MTF. After the measurement of the CCD characteristics (see figure 1) acquisition parameters required for a good signal-to-noise ratio are optimized. The algorithms are then applied to the real datasets.
788
doi:10.1017/S1431927614005662 © Microscopy Society of America 2014Microsc. Microanal. 20 (Suppl 3), 2014
https:/www.cambridge.org/core/terms. https://doi.org/10.1017/S1431927614005662
References:
[1] M. Vulovic et al, Acta Crystallographica Section D: Biological Crystallography. 66 (2010) p. 97-109.
[2] W. Van den Broek et al, Microscopy and Microanalysis 18 (2011) p. 336-342. [3] G. Lucas et al, Micron 52-53 (2013) p. 49-56.
[4] Multivariate Statistical Analysis plugin for Digital Micrograph™, lsme.epfl.ch/msa.
Figure 1. Modulation transfer function extracted from the CCD (dotted blue line). The red solid line is
the corresponding fit using a sum of Gaussian and Lorenztian functions.
789 Microsc. Microanal. 20 (Suppl 3), 2014
https:/www.cambridge.org/core/terms. https://doi.org/10.1017/S1431927614005662