Prevalence and trends of stunting among pre-school children,
1990–2020
Mercedes de Onis*, Monika Blo¨ssner and Elaine Borghi
Growth Assessment and Surveillance Unit, Department of Nutrition for Health and Development, World Health Organization, 20 Avenue Appia, 1211 Geneva 27, Switzerland
Submitted 2 December 2010: Accepted 28 April 2011: First published online 14 July 2011 Abstract
Objective: To quantify the prevalence and trends of stunting among children using the WHO growth standards.
Design: Five hundred and seventy-six nationally representative surveys, including anthropometric data, were analysed. Stunting was defined as the proportion of children below 22SDfrom the WHO length- or height-for-age standards median.
Linear mixed-effects modelling was used to estimate rates and numbers of affected children from 1990 to 2010, and projections to 2020.
Setting: One hundred and forty-eight developed and developing countries. Subjects: Boys and girls from birth to 60 months.
Results: In 2010, it is estimated that 171 million children (167 million in developing countries) were stunted. Globally, childhood stunting decreased from 39?7 (95 % CI 38?1, 41?4) % in 1990 to 26?7 (95 % CI 24?8, 28?7) % in 2010. This trend is expected to reach 21?8 (95 % CI 19?8, 23?8) %, or 142 million, in 2020. While in Africa stunting has stagnated since 1990 at about 40 % and little improvement is anticipated, Asia showed a dramatic decrease from 49 % in 1990 to 28 % in 2010, nearly halving the number of stunted children from 190 million to 100 million. It is anticipated that this trend will continue and that in 2020 Asia and Africa will have similar numbers of stunted children (68 million and 64 million, respectively). Rates are much lower (14 % or 7 million in 2010) in Latin America.
Conclusions: Despite an overall decrease in developing countries, stunting remains a major public health problem in many of them. The data summarize progress achieved in the last two decades and help identify regions needing effective interventions. Keywords Stunting Length Height Pre-school children Growth monitoring
Poor linear growth, or stunting (low length- or height-for-age), in young children is the result of multiple circum-stances and determinants, including antenatal, intra-uterine and postnatal malnutrition(1). Stunting in early life is associated with adverse functional consequences, includ-ing poor cognition and educational performance, low adult wages, lost productivity and, when accompanied by excessive weight gain later in childhood(2), increased risk of nutrition-related chronic diseases. Early interventions can prevent these outcomes and also decrease the risk of maternal mortality and short- and long-term disability due to obstructed labour(3,4).
In 2000, we reported on the prevalence and trends of stunting among pre-school children in developing coun-tries(5) based on data from 241 nationally representative samples from 106 countries. The results showed that the prevalence of stunting decreased from 47 % in 1980 to 33 % in 2000 (by 40 million), but that progress was uneven across regions. Despite the overall decrease, stunting had increased
in Eastern Africa; Northern Africa and the Caribbean had shown only modest improvements; and Western Africa and Central America had presented very little progress. The results underlined the importance of monitoring global levels and trends of stunting in young children.
These earlier analyses were based on estimates derived using the National Center for Health Statistics (NCHS) growth reference(6), which was recommended for inter-national use at that time. Since April 2006, WHO has
recommended the WHO Child Growth Standards(7),
which differ substantially from the NCHS reference(8). The present analyses describe levels and trends of stunting in pre-school children based on the WHO stan-dards. We relied on a much larger and more recent set of national surveys than in the previous analyses. Moreover, while the earlier report covered only developing countries and reported trends from 1980 to 2005, the present paper reports on trends from 1990 to 2020 and includes estimates for both developed and developing countries.
Methods
Cross-sectional data on the prevalence of stunting were obtained from national surveys included in the WHO Global Database on Child Growth and Malnutrition(9). In all, 576 nationally representative surveys were available from 148 countries/territories. Of these surveys, 537 were conducted in developing and thirty-nine in developed countries. For twenty-four countries, only one national survey was available, twenty-eight countries had two surveys, and ninety-six countries had three or more sur-veys. About 39 % of the surveys (n 227) were conducted between 1991 and 1999, 20 % (n 118) dated from 1990 and earlier, and 40 % (n 231) were undertaken in 2000 or later (Table 1). The earliest survey (from Colombia) dates from 1966, while the most recent surveys (Bhutan, Cambodia, Chile, Egypt, Mauritania and Vietnam) were conducted in 2008. All surveys included boys and girls, and age groups ranged from birth to 5 years. Surveys applied standard measuring protocols, i.e. supine length measured in children up to 24 months and standing height for 24 months of age and older. The complete set of surveys used in the analysis is available on request.
Prevalence of stunting was defined as the proportion of children who fell below 22SDfrom the length- or height-for-age WHO Child Growth Standards median. We con-structed a data file with the following variables: region, sub-region, country, survey year, sample size, prevalence of stunting, and population of children ,5 years of age during the survey year. To obtain comparable prevalences, surveys with available raw data (327 out of 576) were re-analysed using the WHO Child Growth Standards(10). Where raw data were not available, i.e. for the remaining 249 surveys (43 %), we applied an algorithm for converting
prevalences based on the NCHS reference to prevalences based on the WHO standards(11). The steps taken to ensure standardized quality control and survey analysis have been described elsewhere(12).
Linear mixed-effects modelling was used to estimate prevalence rates by region from 1990 to 2020. This meth-odology, which has been used in previous trend analyses(13–15), is described in detail elsewhere(16). In brief, a single linear mixed-effect model was fitted for each group of sub-regions belonging to the same region. The basic model contained the factors sub-region, year, and the interaction between year and sub-region as fixed effects, and country as random effect. Consequently, we obtained from each model an estimated intercept and a slope for every sub-region within the region. Unstructured covar-iance (which allows an intercept and slope to be estimated for each country) was used to reflect individual country trends, except in Asia where compound symmetry pro-vided the best fit(16). Fitting was performed on the logistic transform (‘logit’) of the prevalence to ensure that all prevalence estimates and their confidence intervals would lie between zero and one.
We carried out weighted analyses by under-5s popu-lation size using UN popupopu-lation estimates(17). Regional prevalence estimates were derived using the sum of the estimated numbers affected in the sub-regions divided by the total population of under-5s of that region. The overall regional estimate is thus the weighted average of the sub-region prevalence estimates (weighted by the respective under-5s population proportions). Corre-sponding confidence intervals were derived using the delta method based on the standard errors of the sub-region prevalence estimates(16). The same approach was used to derive prevalence estimates and confidence
Table 1 Description of the 576 surveys included in the analysis by UN region and sub-region
No. of surveys by survey period UN region/sub-region No. of surveys Countries with surveys/total no. of countries Coverage of under-5 population (%) #1990 1991–1999 $2000 Africa 205 53/55 99?4 39 82 84 Eastern 64 17/18 99?1 11 29 24 Middle 23 9/9 100?0 3 7 13 Northern 33 6/7 99?9 7 14 12 Southern 17 5/5 99?8 2 8 7 Western 68 16/16 100?0 16 24 28 Asia* 187 42/47 99?5 26 79 82 Eastern* 13 3/4 96?6 1 4 8 South-central 77 14/14 99?3 12 35 30 South-eastern 55 10/11 99?1 10 18 27 Western 42 15/18 96?1 3 22 17
Latin America & Caribbean 135 27/37 97?6 40 52 43
Caribbean 34 7/16 90?5 9 12 13
Central America 32 8/8 99?0 10 13 9
South America 69 12/13 98?6 21 27 21
Oceania- 10 7/22 91?0 6 3 1
All developing countries 537 129/161 99?2 111 216 210
Developed countries 39 19/45 62?8 7 11 21
Global 576 148/206 96?5 118 227 231
*Excluding Japan.
intervals for aggregate levels for developing countries and globally. Estimates for developed countries were derived using a single model, with year as fixed effect and country as random effect, and an unstructured covariance model. Analyses were done using Statistical Analysis Systems statistical software package version 9 (SAS Institute, Cary, NC, USA).
Countries were grouped into regions and sub-regions following the UN classification system. Population coverage refers to the sum of the latest-year-survey populations of the countries within the group divided by the total population referent to the median of the years used in the sum. Thus, coverage reflects the contribution of all surveys involved in fitting the trend but varies across the analysis period. Because all fifty-eight countries for which no data are available have small populations, there is only a negligible impact on overall coverage.
Results
Table 1 shows the distribution, by geographical region, of surveys included in the analysis together with the under-5s population coverage. Overall, Africa and Asia have popu-lation coverage of more than 99 %, while coverage for Latin America and the Caribbean is somewhat lower (98 %). For all developing countries and globally, the population coverage is very high (99 % and 97 %, respectively), while it is much lower (63 %) for developed countries due either to a lack of national surveys or reported estimates that are based on local references.
Estimates of the prevalence and numbers (including 95 % confidence intervals) of stunted pre-school children from 1990 to 2010, and projections for 2015 and 2020, are shown in Tables 2 and 3, respectively. Worldwide, the pre-valence of childhood stunting decreased from 39?7 (95 % CI
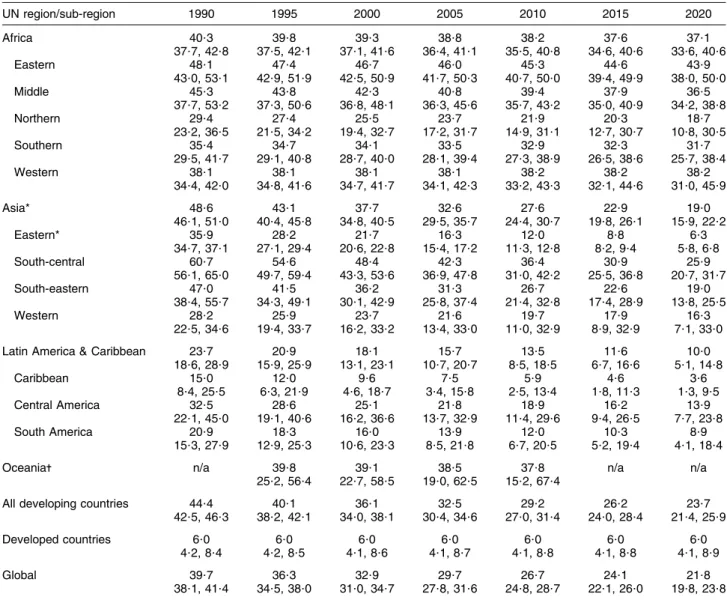
Table 2 Estimated prevalence (%) of stunted pre-school children 1990–2020, with 95 % confidence intervals, by UN region and sub-region
UN region/sub-region 1990 1995 2000 2005 2010 2015 2020 Africa 40?3 39?8 39?3 38?8 38?2 37?6 37?1 37?7, 42?8 37?5, 42?1 37?1, 41?6 36?4, 41?1 35?5, 40?8 34?6, 40?6 33?6, 40?6 Eastern 48?1 47?4 46?7 46?0 45?3 44?6 43?9 43?0, 53?1 42?9, 51?9 42?5, 50?9 41?7, 50?3 40?7, 50?0 39?4, 49?9 38?0, 50?0 Middle 45?3 43?8 42?3 40?8 39?4 37?9 36?5 37?7, 53?2 37?3, 50?6 36?8, 48?1 36?3, 45?6 35?7, 43?2 35?0, 40?9 34?2, 38?8 Northern 29?4 27?4 25?5 23?7 21?9 20?3 18?7 23?2, 36?5 21?5, 34?2 19?4, 32?7 17?2, 31?7 14?9, 31?1 12?7, 30?7 10?8, 30?5 Southern 35?4 34?7 34?1 33?5 32?9 32?3 31?7 29?5, 41?7 29?1, 40?8 28?7, 40?0 28?1, 39?4 27?3, 38?9 26?5, 38?6 25?7, 38?4 Western 38?1 38?1 38?1 38?1 38?2 38?2 38?2 34?4, 42?0 34?8, 41?6 34?7, 41?7 34?1, 42?3 33?2, 43?3 32?1, 44?6 31?0, 45?9 Asia* 48?6 43?1 37?7 32?6 27?6 22?9 19?0 46?1, 51?0 40?4, 45?8 34?8, 40?5 29?5, 35?7 24?4, 30?7 19?8, 26?1 15?9, 22?2 Eastern* 35?9 28?2 21?7 16?3 12?0 8?8 6?3 34?7, 37?1 27?1, 29?4 20?6, 22?8 15?4, 17?2 11?3, 12?8 8?2, 9?4 5?8, 6?8 South-central 60?7 54?6 48?4 42?3 36?4 30?9 25?9 56?1, 65?0 49?7, 59?4 43?3, 53?6 36?9, 47?8 31?0, 42?2 25?5, 36?8 20?7, 31?7 South-eastern 47?0 41?5 36?2 31?3 26?7 22?6 19?0 38?4, 55?7 34?3, 49?1 30?1, 42?9 25?8, 37?4 21?4, 32?8 17?4, 28?9 13?8, 25?5 Western 28?2 25?9 23?7 21?6 19?7 17?9 16?3 22?5, 34?6 19?4, 33?7 16?2, 33?2 13?4, 33?0 11?0, 32?9 8?9, 32?9 7?1, 33?0
Latin America & Caribbean 23?7 20?9 18?1 15?7 13?5 11?6 10?0
18?6, 28?9 15?9, 25?9 13?1, 23?1 10?7, 20?7 8?5, 18?5 6?7, 16?6 5?1, 14?8 Caribbean 15?0 12?0 9?6 7?5 5?9 4?6 3?6 8?4, 25?5 6?3, 21?9 4?6, 18?7 3?4, 15?8 2?5, 13?4 1?8, 11?3 1?3, 9?5 Central America 32?5 28?6 25?1 21?8 18?9 16?2 13?9 22?1, 45?0 19?1, 40?6 16?2, 36?6 13?7, 32?9 11?4, 29?6 9?4, 26?5 7?7, 23?8 South America 20?9 18?3 16?0 13?9 12?0 10?3 8?9 15?3, 27?9 12?9, 25?3 10?6, 23?3 8?5, 21?8 6?7, 20?5 5?2, 19?4 4?1, 18?4
Oceania- n/a 39?8 39?1 38?5 37?8 n/a n/a
25?2, 56?4 22?7, 58?5 19?0, 62?5 15?2, 67?4
All developing countries 44?4 40?1 36?1 32?5 29?2 26?2 23?7
42?5, 46?3 38?2, 42?1 34?0, 38?1 30?4, 34?6 27?0, 31?4 24?0, 28?4 21?4, 25?9
Developed countries 6?0 6?0 6?0 6?0 6?0 6?0 6?0
4?2, 8?4 4?2, 8?5 4?1, 8?6 4?1, 8?7 4?1, 8?8 4?1, 8?8 4?1, 8?9
Global 39?7 36?3 32?9 29?7 26?7 24?1 21?8
38?1, 41?4 34?5, 38?0 31?0, 34?7 27?8, 31?6 24?8, 28?7 22?1, 26?0 19?8, 23?8
n/a, no data available. *Excluding Japan.
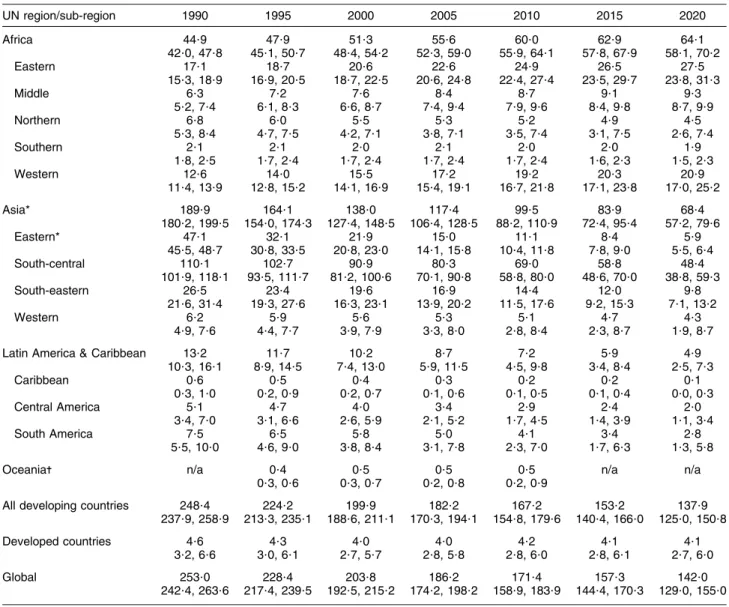
38?1, 41?4) % in 1990 to 26?7 (95 % CI 24?8, 28?7) % in 2010, for a relative decrease of 33 %. Given the status quo, this trend is expected to continue and reach a prevalence of 21?8 % (95 % CI 19?8, 23?8) % in 2020, for a further relative decrease of 18 % from 2010 (Table 2). In terms of numbers of affected children, it is estimated that 171 million pre-school children were stunted in 2010, 167 million (95 %) of whom lived in developing countries. Between 2010 and 2020, the global number of stunted children is forecast to decrease further to 142 million (Table 3).
Trends in stunting during the study period follow dif-ferent patterns in developing and developed countries. While the prevalence of stunting in developed countries has been stable at 6?0 (95 % CI 4?1, 8?8) % since 1990 and is expected to remain at this level, developing countries have experienced a decrease from 44?4 (95 % CI 42?5, 46?3) %
in 1990 to 29?2 (95 % CI 27?0, 31?4) % in 2010. The fore-cast is that this decreasing trend will continue and reach a prevalence of 23?7 (95 % CI 21?4, 25?9) % in 2020. Figure 1 presents regional and aggregate level trends for stunting during the period 1990–2020.
In Africa between 1990 and 2010, the prevalence of childhood stunting stagnated at about 40 % and, if the current trend continues, not much improvement is antici-pated for the next decade. Given population growth, this translates into increasing numbers of stunted children (from 45 million in 1990 to 60 million in 2010). In contrast, Asia showed a dramatic decrease in the prevalence of stunting from almost 49 % in 1990 to less than 28 % in 2010, nearly halving the number of stunted children from 190 million in 1990 to 100 million in 2010. It is anticipated that this decreasing trend will continue, reaching a total
Table 3 Estimated numbers (millions) of stunted pre-school children 1990–2020, with 95 % confidence intervals, by UN region and sub-region UN region/sub-region 1990 1995 2000 2005 2010 2015 2020 Africa 44?9 47?9 51?3 55?6 60?0 62?9 64?1 42?0, 47?8 45?1, 50?7 48?4, 54?2 52?3, 59?0 55?9, 64?1 57?8, 67?9 58?1, 70?2 Eastern 17?1 18?7 20?6 22?6 24?9 26?5 27?5 15?3, 18?9 16?9, 20?5 18?7, 22?5 20?6, 24?8 22?4, 27?4 23?5, 29?7 23?8, 31?3 Middle 6?3 7?2 7?6 8?4 8?7 9?1 9?3 5?2, 7?4 6?1, 8?3 6?6, 8?7 7?4, 9?4 7?9, 9?6 8?4, 9?8 8?7, 9?9 Northern 6?8 6?0 5?5 5?3 5?2 4?9 4?5 5?3, 8?4 4?7, 7?5 4?2, 7?1 3?8, 7?1 3?5, 7?4 3?1, 7?5 2?6, 7?4 Southern 2?1 2?1 2?0 2?1 2?0 2?0 1?9 1?8, 2?5 1?7, 2?4 1?7, 2?4 1?7, 2?4 1?7, 2?4 1?6, 2?3 1?5, 2?3 Western 12?6 14?0 15?5 17?2 19?2 20?3 20?9 11?4, 13?9 12?8, 15?2 14?1, 16?9 15?4, 19?1 16?7, 21?8 17?1, 23?8 17?0, 25?2 Asia* 189?9 164?1 138?0 117?4 99?5 83?9 68?4 180?2, 199?5 154?0, 174?3 127?4, 148?5 106?4, 128?5 88?2, 110?9 72?4, 95?4 57?2, 79?6 Eastern* 47?1 32?1 21?9 15?0 11?1 8?4 5?9 45?5, 48?7 30?8, 33?5 20?8, 23?0 14?1, 15?8 10?4, 11?8 7?8, 9?0 5?5, 6?4 South-central 110?1 102?7 90?9 80?3 69?0 58?8 48?4 101?9, 118?1 93?5, 111?7 81?2, 100?6 70?1, 90?8 58?8, 80?0 48?6, 70?0 38?8, 59?3 South-eastern 26?5 23?4 19?6 16?9 14?4 12?0 9?8 21?6, 31?4 19?3, 27?6 16?3, 23?1 13?9, 20?2 11?5, 17?6 9?2, 15?3 7?1, 13?2 Western 6?2 5?9 5?6 5?3 5?1 4?7 4?3 4?9, 7?6 4?4, 7?7 3?9, 7?9 3?3, 8?0 2?8, 8?4 2?3, 8?7 1?9, 8?7
Latin America & Caribbean 13?2 11?7 10?2 8?7 7?2 5?9 4?9
10?3, 16?1 8?9, 14?5 7?4, 13?0 5?9, 11?5 4?5, 9?8 3?4, 8?4 2?5, 7?3 Caribbean 0?6 0?5 0?4 0?3 0?2 0?2 0?1 0?3, 1?0 0?2, 0?9 0?2, 0?7 0?1, 0?6 0?1, 0?5 0?1, 0?4 0?0, 0?3 Central America 5?1 4?7 4?0 3?4 2?9 2?4 2?0 3?4, 7?0 3?1, 6?6 2?6, 5?9 2?1, 5?2 1?7, 4?5 1?4, 3?9 1?1, 3?4 South America 7?5 6?5 5?8 5?0 4?1 3?4 2?8 5?5, 10?0 4?6, 9?0 3?8, 8?4 3?1, 7?8 2?3, 7?0 1?7, 6?3 1?3, 5?8
Oceania- n/a 0?4 0?5 0?5 0?5 n/a n/a
0?3, 0?6 0?3, 0?7 0?2, 0?8 0?2, 0?9
All developing countries 248?4 224?2 199?9 182?2 167?2 153?2 137?9
237?9, 258?9 213?3, 235?1 188?6, 211?1 170?3, 194?1 154?8, 179?6 140?4, 166?0 125?0, 150?8
Developed countries 4?6 4?3 4?0 4?0 4?2 4?1 4?1
3?2, 6?6 3?0, 6?1 2?7, 5?7 2?8, 5?8 2?8, 6?0 2?8, 6?1 2?7, 6?0
Global 253?0 228?4 203?8 186?2 171?4 157?3 142?0
242?4, 263?6 217?4, 239?5 192?5, 215?2 174?2, 198?2 158?9, 183?9 144?4, 170?3 129?0, 155?0
n/a, no data available. *Excluding Japan.
number of stunted children in Asia (68 million) similar to the number in Africa (64 million) in 2020. In Latin America both the prevalence and number of affected children were much lower than in Africa and Asia (14 % or 7 million in 2010) and they are expected to continue decreasing in the coming decade (Tables 2 and 3). Data in Oceania remain scarce and thus trend modelling is not possible. However, individual countries like Papua New Guinea show high rates of stunting (44 % in 2005).
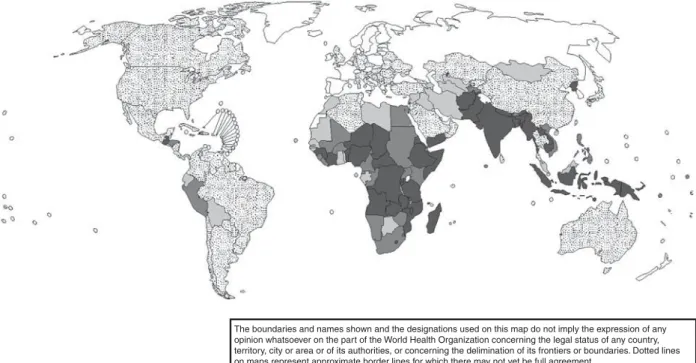
Nationally, there is great variation in rates of childhood stunting. Figure 2 maps countries according to their latest national stunting prevalence estimate. Rates are categorized as low, medium, high and very high (,20 %, 20–29?9 %, 30–39?9 % and $40 %, respectively)(18). Extremely high rates appear in countries like Afghanistan, Burundi and Yemen, with levels above 50 % in most recent surveys. Other countries of sub-Saharan Africa, South-central and South-eastern Asia also present high or very high stunting
0 1990 1995 2000 2005 Year 2010 2015 2020 5 10 15 20 25 30 35 40 45 50 55 Stunting (%)
Fig. 1 Stunting trends from 1990 to 2020 by UN region (1 – 1 – 1, Africa; 3 – 3 – 3, Asia; B – B – B, Latin America & the Caribbean; , – , – ,, developing countries;2 – 2 – 2, developed countries)
The boundaries and names shown and the designations used on this map do not imply the expression of any opinion whatsoever on the part of the World Health Organization concerning the legal status of any country, territory, city or area or of its authorities, or concerning the delimination of its frontiers or boundaries. Dotted lines on maps represent approximate border lines for which there may not yet be full agreement.
© WHO 2010. All rights reserved
Fig. 2 Latest country estimates of stunting in children aged 0–5 years ( , no data; , ,20 %; , 20–29?9 %; , 30–39?9 %; , $40 %)
rates. At the other end of the spectrum, levels below 10 % are found in e.g. Chile, the Czech Republic and the former Yugoslav Republic of Macedonia. Country-specific prevalence data, disaggregated by age group, sex, urban/ rural and region, are available from the WHO Global Database on Child Growth and Malnutrition(9).
Discussion
The dual aim of the present report is to describe global levels and patterns of childhood stunting for the period 1990–2020 based on the WHO Child Growth Standards and to assess the magnitude of the problem relative to what we described a decade ago(5). The earlier analyses were based on 241 nationally representative surveys from 106 countries, with trend data for only sixty-five countries, whereas we now report on 576 national surveys from 148 countries with trend data for 124 countries.
Stunting is much more common than underweight (low weight-for-age) or wasting (low weight-for-height)(9), affecting globally in 2010 about 171 million or 27 % of children aged 0–5 years. Deeply rooted in poverty and deprivation, stunting is a nutrition problem that affects mainly developing countries, with the highest rates found in Eastern, Middle and Western Africa, where, respectively, 45 %, 39 % and 38 % of pre-schoolers were affected in 2010. Marked differences are observed among regions. In Africa, the prevalence of stunting in 2010 was 38 % and it is forecast to stagnate in the coming decade. In contrast, the prevalence in Asia is substantially lower (28 % in 2010, expected to decrease to 19 % in 2020). Projected trends in the prevalence of stunted children combined with dissimilar population growth (increasing in Africa, decreasing in Asia) will narrow the gap between their respective contributions to the total number of stunted children worldwide. While in 2010 there were 100 million stunted children in Asia and 60 million in Africa, these numbers are expected to change to 68 and 64 million, respectively, by 2020 if recent trends continue. This is largely due to expected slow and little improvement in Eastern, Middle and Southern Africa and complete stagnation in Western Africa, while substantial progress is anticipated for all sub-regions in Asia.
There are some limitations to the present analyses. First, coverage for developed countries is low (63 %). Some have not yet conducted national surveys while others report results using local references. Second, national surveys were not done randomly across geographical regions. Depending on where and when surveys were conducted, bias may have been introduced into the regional estimates of past and future prevalences. Third, some regions, despite broad coverage, present wide confidence intervals. This is due either to heterogeneity within the group or uncertainty resulting from too few data points. Northern Africa (21?9 (95 % CI 14?9, 31?1) % in 2010), with such
nutritionally diverse countries as Tunisia (9 % in 2006) and Sudan (38 % in 2006), is an example of a heterogeneous region. For Oceania, only ten surveys were available and thus the 95 % CI around the 2010 estimate (37?8 %) ranges from 15?2 % to 67?4 %. Finally, like any forecasting method, the further trends are projected the greater the uncertainty of the estimates. Although confidence intervals partially reflect this uncertainty, trajectories might change as new estimates become available. Despite these limitations and the inherent speculative nature of extrapolating estimates to 2020, the present results provide a useful base for monitoring levels and trends of childhood stunting.
Two success stories underline the association between child stunting and socio-economic status. In Brazil’s Northeast stunting decreased from 34 % in 1986 to 6 % in 2006. Comprehensive statistical models identified four primary reasons for this dramatic decline: (i) increased purchasing power of low-income families; (ii) improved educational levels of mothers; (iii) expanded public water and sewage systems; and (iv) virtual universalization of basic health care, including prenatal care(19). The Brazilian experience shows that the scourge of chronic malnutrition can be rapidly reduced if income among the poor rises and simultaneously there is increased access to schools, clean water, sanitation and basic health care(20). Similarly, in Mexico stunting decreased from 27 % to 16 % over the period 1988–2006 due to better targeting and enhanced coverage of a conditional cash-transfer programme and increased access to health-care facilities(21,22).
The data presented here confirm that childhood stunting remains a major public health problem in developing countries. There is nevertheless evidence that children the world over can attain their full growth potential if they are nurtured in healthy environments and their caregivers follow recommended health, nutrition and care prac-tices(23). Growth faltering often begins in utero and con-tinues for the first two years of life(24). The main window of opportunity to prevent stunting is thus the intra-uterine and postnatal periods, from conception until 24 months. Significant reductions in stunting can be achieved through a comprehensive set of priority interventions for reducing the global burden of disease and fostering economic development in low-income countries.
Stunting often goes unrecognized in children who live in communities where short stature is so common that it seems normal. Thus, measuring length (up to 24 months) or height (from 24 months onwards) – and not just weight – should become standard practice when assessing child growth. Similarly, rather than monitoring only under-weight, policy makers should use stunting as an indicator of overall child health and nutritional status. This is par-ticularly important as the nutrition transition accelerates in many developing countries(15)towards higher rates of overweight and obesity, which can result in populations with low rates of underweight but persistently high rates of stunting.
Acknowledgements
Disclaimer: The authors are staff members of the World Health Organization. The authors alone are responsible for the views expressed in this publication and they do not necessarily represent the decisions or policies of the World Health Organization. Sources of funding: This research received no specific grant from any funding agency in the public, commercial or not-for-profit sectors. Conflicts of interest: No author had a personal or financial conflict of interest. Author contributions: M.d.O. developed the report’s conceptual framework, coordinated analyses and prepared the initial draft. M.B. and E.B. collected data sets, conducted analyses and contributed to writing. All authors read and approved the final report.
References
1. Waterlow JC (1994) Introduction. Causes and mechanisms of linear growth retardation (stunting). Eur J Clin Nutr 48, Suppl. 1, S1–S4.
2. Victora CG, Adair L, Fall C et al., for the Maternal and Child Undernutrition Study Group (2008) Maternal and child undernutrition: consequences for adult health and human capital. Lancet 371, 340–357.
3. Kwawukume EY, Ghosh TS & Wilson JB (1993) Maternal height as a predictor of vaginal delivery. Int J Gynaecol Obstet 41, 4.
4. Merchant KM, Villar J & Kestler E (2001) Maternal height and newborn size relative to risk of intrapartum caesarean delivery and perinatal distress. BJOG 108, 689–696. 5. de Onis M, Frongillo EA & Blo¨ssner M (2000) Is
malnutrition declining? An analysis of changes in levels of child malnutrition since 1980. Bull World Health Organ 78, 1222–1233.
6. National Center for Health Statistics (1977) NCHS Growth Curves for Children, Birth–18 Years. Publication no. (PHS) 78–1650. Washington, DC: National Center for Health Statistics, Department of Health, Education and Welfare. 7. WHO Multicentre Growth Reference Study Group (2006)
WHO Child Growth Standards based on length/height, weight and age. Acta Paediatr Suppl 450, 76–85. 8. de Onis M, Onyango AW, Borghi E et al., for the
WHO Multicentre Growth Reference Study Group (2006) Comparison of the World Health Organization (WHO) Child Growth Standards and the National Center for Health Statistics (NCHS)/WHO international growth reference: implications for child health programmes. Public Health Nutr 9, 942–947.
9. World Health Organization, Department of Nutrition for Health and Development (2010) WHO Global Database
on Child Growth and Malnutrition. http://www.who.int/ nutgrowthdb/en/
10. World Health Organization (2010) WHO Anthro for personal computers: software for assessing growth and development of the world’s children (version 3.1). http:// www.who.int/childgrowth/software/en/
11. Yang H & de Onis M (2008) Algorithms for converting estimates of child malnutrition based on the NCHS reference into estimates based on the WHO Child Growth Standards. BMC Pediatr 8, 19.
12. de Onis M & Blo¨ssner M (2003) The World Health Organization Global Database on Child Growth and Malnutrition: methodology and applications. Int J Epidemiol 32, 518–526.
13. de Onis M, Blo¨essner M, Borghi E et al. (2004) Estimates of global prevalence of childhood underweight in 1990 and 2015. JAMA 291, 2600–2606.
14. Black RE, Allen LH, Bhutta ZA et al., for the Maternal and Child Undernutrition Study Group (2008) Maternal and child undernutrition: global and regional exposures and health consequences. Lancet 371, 243–260.
15. de Onis M, Blo¨ssner M & Borghi E (2010) Global prevalence and trends of overweight and obesity among preschool children. Am J Clin Nutr 92, 1257–1264. 16. de Onis M, Blo¨ssner M & Borghi E (2004) Methodology for
estimating regional and global trends of child malnutrition. Int J Epidemiol 33, 1260–1270.
17. Department of Economic and Social Affairs, United Nations Population Division (2009) World Population Prospects, The 2008 Revision. New York: UN.
18. World Health Organization (1995) Physical Status: The Use and Interpretation of Anthropometry. Report of a WHO Expert Committee. WHO Technical Report Series no. 854. Geneva: WHO.
19. Lima AL, Silva AC, Konno SC et al. (2010) Causes of the accelerated decline in child undernutrition in Northeastern Brazil (1986–1996–2006). Rev Saude Publica 44, 17–27.
20. Monteiro CA, Benicio MH, Konno SC et al. (2009) Causes for the decline in child under-nutrition in Brazil, 1996–2007. Rev Saude Publica 43, 35–43.
21. Rivera JA, Irizarry LM & Gonza´lez-de Cossı´o T (2009) Overview of the nutritional status of the Mexican population in the last two decades. Salud Publica Mex 51, Suppl. 4, S645–S656.
22. Rivera JA (2009) Improving nutrition in Mexico: the use of research for decision making. Nutr Rev 67, Suppl. 1, S62–S65.
23. WHO Multicentre Growth Reference Study Group (2006) Assessment of differences in linear growth among popula-tions in the WHO Multicentre Growth Reference Study. Acta Paediatr Suppl 450, 56–65.
24. Victora CG, de Onis M & Hallal PC (2010) Worldwide timing of growth faltering: revisiting implications for interventions using the World Health Organization growth standards. Pediatrics 125, e473–e480.