Overweight and obesity in a Swiss city: 10-year trends
Ursula G Kyle
1, Michel P Kossovsky
2, Laurence Genton
1and Claude Pichard
1,*
1Clinical Nutrition, Geneva University Hospital, 1211 Geneva, Switzerland:2Hospital Care System Research and Analysis Group, Geneva University Hospital, 1211 Geneva, Switzerland
Submitted 19 April 2006: Accepted 14 November 2006: First published online 27 February 2007
Abstract
Background: Increased rates of overweight/obesity have been reported in recent years in developed countries. This population study of healthy subjects evaluated the changes in overweight/obesity prevalence in 2003, compared with 1993, and determined the association of age, sex and leisure-time activity with body mass index (BMI), fat-free mass index (FFMI) and fat mass index (FMI).
Design: Two transversal samples of convenience.
Participants: Healthy volunteers (1993, n ¼ 802; 2003, n ¼ 1631).
Methods: Fat-free mass was determined using the bioelectrical impedance multiple regression equation. Multivariable linear regression, including confounding variables (age, sex, leisure-time activity), was used to model the body composition evolution between the 1993 and the 2003 subjects.
Results: BMI and FMI were higher in 2003 than in 1993, P , 0.001. FFMI was not higher in 2003 than in 1993, P ¼ 0.38. More subjects were overweight/obese in 2003 than in 1993 (27.5 versus 17.2%, chi-square P , 0.001), and had a high FFMI (30.2 versus 21.8%, chi-square P , 0.001) and high FMI (28.0 versus 20.3%, chi-square P , 0.001). Multivariate linear regressions showed that leisure-time activity was negatively, and sex, age and inclusion year were positively associated with BMI, FFMI and FMI (the exception was a negative association with sex) (P , 0.001).
Conclusion: Overweight prevalence increased between 1993 and 2003 in a Swiss city, and was associated with a higher fat mass. This observation remained statistically significant after adjustment for age, sex and leisure-time activity.
Keywords Body composition Leisure-time activity Long-term trends Fat-free mass Fat mass
Increased rates of overweight and obesity have been reported in recent years in developed countries. Current International Obesity Task Force estimates suggest that worldwide at least 1.1 billion adults are overweight, including 312 million who are obese1. In the USA, 35% of adults are overweight and an additional 30% are obese2. Mean body mass index (BMI) as well as the prevalence of overweight increased in virtually all Western European countries from the early 1980s to the mid 1990s3. In Switzerland, the prevalence of overweight increased in men aged 20 – 29 years by . 10% between 1980 and 1990 to reach 25%; and in women in the same age group, the prevalence increased progressively since 1960 to reach 10.5% in 19904. The overweight/obesity prevalence continued to increase by 10% in men and 8% in women between 1993 and 20005. Increases in BMI are associated with increases in lean body and fat tissues.
In epidemiological studies, both low and high BMI have been associated with increased morbidity6 – 9, including higher risk of coronary heart disease, hypertension, hyperlipidaemia, diabetes, cancer and osteoarthritis10, and excess mortality10. BMI has been used to estimate an excess or deficit in body weight, but is an imprecise
measurement of fatness11,12. The direct measurement of fat-free mass (FFM) and body fat (BF) permits a more precise determination of whether morbidity and mortality are associated with the lean or fat body compartment. Thus, it would be of interest to determine the longitudinal population trends of FFM and BF. However, the differences in FFM or BF in older, compared with younger, subjects may be due to shorter height of older subjects or due to changes in body composition. The use of the fat-free mass index (FFMI) and fat mass index (FMI), similarly to BMI (weight/height2, kg m22), permits comparison of subjects of different heights13.
In long-term studies, weight gain has been associated with low physical activity levels14. However, the long-term effects of leisure-time activity on FFM and BF are not well known.
While increases in the prevalence of overweight/obesity have been reported previously in Switzerland5, through-out Western Europe3 and the USA2, at the present time little is known about the prevalence of low and high FFM and BF. The purpose of this population study of healthy subjects (n ¼ 2433) was to determine the changes in prevalence of overweight and obesity in 2003, compared
with 1993, and further to determine the association of age, sex and leisure-time activity with BMI, FFMI and FMI.
There are no previously published studies that report body composition trends over a 10-year period. Although other studies15 – 17 have reported body composition changes over time, these studies are limited in length of follow-up or number of subjects.
Methods Subjects
The study population comprised two samples of healthy volunteers (1993, n ¼ 802; 2003, n ¼ 1631) between the ages of 20 and 74 years in Geneva, Switzerland who were non-randomly recruited through advertisement in local news-papers, at trade fairs and fun runs, among public administration staff, and by invitations sent to leisure clubs for the elderly in 1993 and 2003. Identical procedures and measurements were used for both data collection points. Subjects with known acute pathologies or physical handicap were excluded. Volunteers were invited to participate in the study if they had not visited a physicians in the last 6 months for acute or chronic conditions. Subjects with conditions that might interfere with bioelectrical impedance analysis (BIA) measurements were excluded, including water or electrolyte imbalance (such as visible oedema and ascites), skin abnormalities (e.g. pachydermia secondary to hypothyroid-ism) and abnormal body geometry (such as amputation, limb atrophy). Study participants were exclusively Caucasians.
The protocol to perform BIA measurements and obtain physical activity, health status and medication data was approved by the Geneva University Hospital Ethics Committee, and study subjects gave written informed consent.
Body composition measurements
Body height was measured to the nearest 0.5 cm and body weight to the nearest 0.1 kg on a balance beam scale. Subjects were dressed in indoor clothing without shoes and heavy sweaters or jackets. Whole-body resistance was measured with four surface electrodes placed on the right wrist and ankle, as previously described18. Briefly, an electrical current of 50 kHz and 0.8 mA was produced by a generator (Bio-Z2w; Spengler) and applied to the skin
using adhesive electrodes (3M Red Dot T; 3M Health Care) with the subject lying supine19. The skin was cleaned with 70% alcohol.
The FFM was calculated by the following previously validated multiple regression equation20: FFM ¼ 24.104 þ (0.518 £ height2/resistance) þ (0.231 £ weight) þ (0.130 £ reactance) þ (4.229 £ sex (men ¼ 1, women ¼ 0))
BF was calculated as weight 2 FFM. The BMI, FFMI and FMI were derived as FFM and BF (kg), respectively, divided by height (m) squared (kg m22).
FFMI and FMI (kg m22) were used to classify patients as normal or high FFMI, and normal, high or very high FMI.
Ranges of FFMI and FMI were derived from polynomial regression equations for each of the BMI cut-offs (18.5, 25 and 30 kg m22) from our healthy subjects (n ¼ 5635)21. These cut-offs correspond to World Health Organization categories for normal weight (18.5 – 25 kg m22), over-weight (25 – 29.9 kg m22) and obese ($ 30 kg m22). We did not consider the categories below 18.5 kg m22because of the small number of subjects falling into this category.
The FFMI (kg m22) was considered21‘normal’ if , 19.7 (men) and , 16.7 (women); and ‘high’ if $ 19.8 (men) and $16.8 (women).
The FMI (kg m22) was considered ‘normal’ if , 5.1 (men) and , 8.1 (women); and ‘high/very high’ if . 5.2 (men) and .8.2 (women);.
Leisure-time activity
Subjects completed a questionnaire to specify the hours and minutes of physical activity per week performed on a regular basis throughout the year, including seasonal variations. Leisure-time activity in this study was predominantly walking, with seasonal activities including skiing, swimming and bicycling. The subjects who performed .3 h of physical activity per week for longer than 2 months were classified as ‘physically active’. Only physical activity at moderate or high intensity (4.0 metabolic equivalents (METs) or more, as defined by the activity intensity codes by the Minnesota Leisure Time Activities Questionnaire22), was counted. Subjects who reported less than 3 h of leisure-time activity per week were classified as ‘sedentary’, as previously reported by our group23,24.
Statistical methods
The results are expressed as the mean ^ standard deviation. The differences between age, leisure-time activity groups and between 1993 and 2003 were analysed by unpaired t-tests using Statview 5.0. Chi-square was used to determine differences between body composition classifications. Statistical significance was set at P # 0.05 for all tests.
Multivariable linear regression was used to model the evolution of body composition between the 1993 and the 2003 subjects. In addition to the time of measurement (1993 or 2003), age, sex and leisure-time activity were introduced in the model. This procedure was performed because we wanted to take into account any age, sex or physical activity differences between the two cohorts. It was reasonable to postulate that changes in demographic composition and leisure habits could have occurred in a 10-year time frame. Therefore, in order to capture the true ‘time’ effect, this modelling was performed in order to control for potential confounding variables. Coefficients associated with the time of measurement therefore captured the evolution of body composition adjusted for sex, age and leisure-time activity between two samples of convenience, recruited in similar conditions.
Results
Comparison of 1993 and 2003 cohort
There was no significant difference in the number of active compared with sedentary study participants between 1993 and 2003 (Table 1). On the other hand, the 2003 cohort included significantly more
women than the 1993 cohort. Mean age was
significantly higher in 2003 (41.4 ^ 11.8 years) than in 1993 (38.1 ^ 12.5 years).
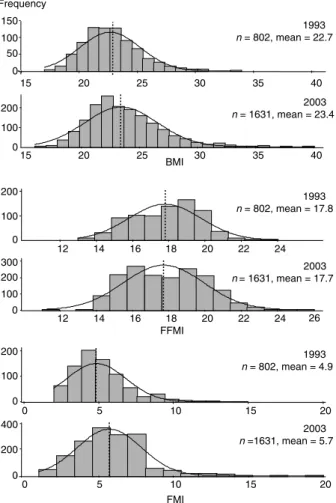
The mean BMI was significantly higher in 2003 (P , 0.001) (Fig. 1). A greater number of subjects were overweight/obese in 2003 (27.5%) compared with 1993 (17.2%, chi-square P , 0.001). The FFMI was not significantly higher in 2003 compared with 1993. However, significantly more subjects had a high FFMI in 2003 (30.2%) than in 1993 (21.8%, chi-square P , 0.001). The FMI was significantly higher in 2003 than in 1993 and a greater number of subjects had a high FMI in 2003 (28.0%) compared with 1993 (20.3%, chi-square P , 0.001) (Table 1).
After adjustment for the relevant covariates (age, sex and level of activity), the body composition indices were only slightly different from the unadjusted results (BMI 22.6 ^ 0.1 kg m22for the 1993 subjects and 23.5 ^ 0.07 kg m22for the 2003 subjects, P , 0.001; FMI 5.1 ^ 0.07 kg m22for the 1993 subjects and 5.6 ^ 0.05 kg m22 for the 2003 subjects, P , 0.001; FFMI 17.5 ^ 0.05 kg m22for the 1993 subjects and 17.8 ^ 0.03 kg m22 for the 2003 subjects, P , 0.001). However, the difference between the 1993 and the 2003 cohort concerning the FFMI became statistically significant when adjusted values were used.
Sedentary and active cohorts
The mean BMI, FMI and FFMI were significantly higher in 2003 than in 1993 in sedentary and active men and women (except for non-significant differences in sedentary women).
The mean BMI was significantly higher in sedentary subjects in both 2003 and 1993 (men, 25.0 ^ 3.0 and 23.7 ^ 2.6 kg m22; women, 23.0 ^ 3.3 and 22.6 ^ 3.3 kg m22) than in the active cohort (men, 24.1 ^ 2.6 and 22.9 ^ 2.6 kg m22; women, 22.0 ^ 2.8 and
20.6 ^ 1.9 kg m22, respectively, P , 0.05). Similarly, the mean FMI was significantly higher in the sedentary subjects (men, 5.5 ^ 2.0 and 4.8 ^ 1.8 kg m22; women, 6.9 ^ 2.2 and 6.7 ^ 2.3 kg m22) than in the active cohort (men, 4.6 ^ 1.7 and 4.7 ^ 1.4 kg m22; women, 5.7 ^ 1.6 and 6.0 ^ 2.0 kg m22, P , 0.001) in 2003 and 1993, respectively. FFMI was not significantly higher in 1993 in active than in sedentary subjects (men, 18.9 ^ 1.2 and 18.9 ^ 1.4 kg m22;
women, 15.6 ^ 1.0 and 16.0 ^ 1.4 kg m22, P . 0.05) and in 2003 in men (19.3 ^ 1.4 and 19.5 ^ 1.6 kg m22, P . 0.05), but was significantly higher in sedentary than active women in 1993 (16.0 ^ 1.4 and 15.6 ^ 1.0 kg m22, P ¼ 0.02).
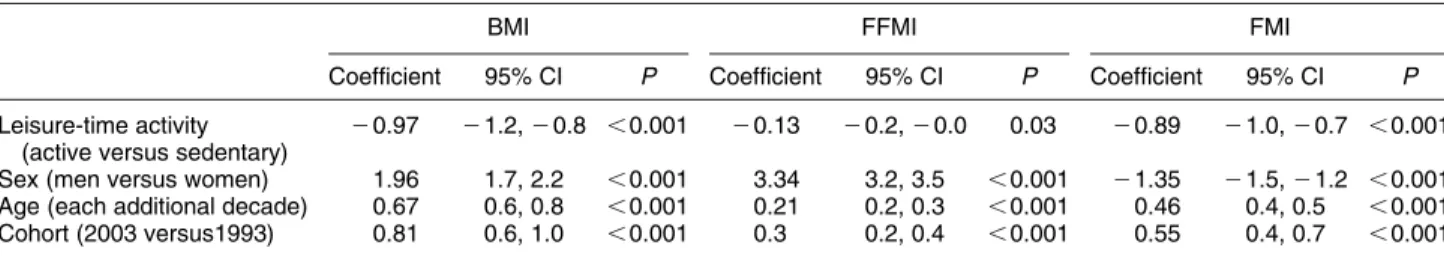
In order to take into account the observed differences in sex and age distributions and to isolate the ‘pure’ time effect represented by the study period, a multivariable analysis that adjusts for these differences was used. The multivariate regression model (Table 2) shows that leisure-time activity was negatively associ-ated with all body composition indices. Age and year of inclusion were associated with an increase in all three body composition indices. Men had a significantly higher BMI and FFMI, and a significantly lower FMI than women.
Table 1 Characteristics of the two cohorts of subjects 1993 (n ¼ 802) 2003 (n ¼ 1631) P Active subjects 460 (57.4) 942 (57.8) 0.86
Women 291 (36.3) 810 (49.7) ,0.001
Mean Age (years) 38.1^12.5 41.4^ 11.8 ,0.001 Mean FFMI (kg m22) 17.8^2.0 17.7^ 2.2 0.38
Mean FMI (kg m22) 4.9^2.0 5.7^ 2.1 ,0.001 Mean BMI (kg m22) 22.7^2.6 23.4^ 3.1 ,0.001
FFMI – fat-free mass index; FMI – fat mass index; BMI – body mass index.
Results are expressed as n (%) or mean ^ standard deviation.
Fig. 1 Frequency distribution of body mass index (BMI, kg m22) (top), fat-free mass index (FFMI, kg m22) (middle) and fat mass index
Discussion
Prevalence of overweight and obesity
Overall the prevalence of overweight/obesity was 10% higher and the prevalence of high FMI was 8.0% higher in 2003 than in 1993. This suggested that overall rates of overweight and obesity are on the rise in Switzerland. The study showed that 27.6 and 5.4% of sedentary subjects, respectively, were considered overweight and obese in 2003, which is similar to overweight and obesity rates of 29 and 8%, respectively, reported in a random survey in Switzerland25. This compared with overweight and obesity rates of 65% (35 and 30%, respectively) in the USA2, 60% in Germany26 and obesity rates of 19% in Spain27, reported in the late 1990s/early 2000s. Thus the rate of overweight in Switzerland is gradually approaching that seen in the USA and Western Europe, but obesity rates remain slightly lower than in other developed countries. Only six (, 0.01%) sedentary and active subjects had BMI .35 kg m22. Rates of overweight and obesity in this study
were lower because of exclusion of subjects with health-related problems (recent hospitalisation, chronic disease). However, the BMI change from 1993 to 2003 could result in considerable increases in overweight and obesity in the future.
Our study showed that the higher prevalence of overweight/obesity in 2003 than 1993 resulted partly in a higher prevalence of high FFMI in active subjects. This effect can be considered beneficial, because higher lean tissue reserves are thought to protect from detrimental effects of malnutrition, such as sarcopenia and frailty in older subjects15,28.
The prevalence of low and high/very high FMI was similar to the prevalence of low and overweight/obese BMI. Overall the prevalence of high and very high FMI was underestimated by 1 – 2% by BMI. This suggests that in healthy, physically active subjects, BMI provides a good estimation of fatness. However, our previous studies have shown significant underestimations of fatness by BMI in patients at hospital admission29,30 and patients with respiratory insufficiencies31. This finding suggests that excess body fat is poorly estimated by BMI in sedentary subjects or those with chronic diseases. Our study did not determine fat distribution, i.e. did not distinguish between central and subcutaneous adiposity,
and no data are available on the possible shift of fat from limbs to trunk.
Association of leisure-time activity, sex, age and year of inclusion with BMI, FFMI and FMI
As expected, sex was positively associated with FFMI and negatively associated with FMI. Numerous studies have documented higher muscle mass and lower body fat in men than in women15,32. BMI was also positively associated with sex, men having a higher BMI than women.
Our results show that leisure-time activity was negatively associated with BMI, FFMI and FMI. Leisure-time activity may, through the effects of increased energy expenditure, preserve both functional status and lean body mass, and contribute to reduce fat accumulation33. In previous studies14, low recreational activity reported at follow-up survey was strongly associated with major weight gain (. 13 kg over the preceding 10 years).
Even though the age and gender composition of the two cohorts were different, the year of inclusion remained statistically significant in a multivariable analysis and was positively associated with BMI, FFMI and FMI. We are thus confident that we captured a real evolution of body composition in the Geneva population across a 10-year period. The association of age and year of inclusion (2003 versus 1993) with BMI increase was higher than the beneficial effects of leisure-time activity and thus resulted in higher BMI and FMI in both the sedentary and active cohort in 2003 than 1993 and also resulted in higher FFMI in 2003. This suggests that the higher weights and BMI, at least within the limits of change reported in this study, did not necessarily have a negative effect on body composition in active subjects in view of the higher prevalence of high FFMI and low FMI (data not shown). The lower rates of obesity in the active subjects also suggest that leisure-time activity had a positive effect on BMI and weight, and support a relationship between physical inactivity and the development of overweight and obesity34.
Haapanen et al.34found that increased physical activity was associated with small body mass gain and low physical activity, and, in particular, decreasing levels of activity during a 10-year follow-up period was strongly associated with large body mass gain.
Table 2 Associations of physical activity, sex and age on body mass index and body composition indices
BMI FFMI FMI
Coefficient 95% CI P Coefficient 95% CI P Coefficient 95% CI P
Leisure-time activity (active versus sedentary)
20.97 21.2, 2 0.8 , 0.001 20.13 20.2, 2 0.0 0.03 20.89 21.0, 2 0.7 , 0.001 Sex (men versus women) 1.96 1.7, 2.2 ,0.001 3.34 3.2, 3.5 ,0.001 21.35 21.5, 2 1.2 , 0.001 Age (each additional decade) 0.67 0.6, 0.8 ,0.001 0.21 0.2, 0.3 ,0.001 0.46 0.4, 0.5 ,0.001 Cohort (2003 versus1993) 0.81 0.6, 1.0 ,0.001 0.3 0.2, 0.4 ,0.001 0.55 0.4, 0.7 ,0.001
Our active subjects expended at least 720 kcal week21 (180 min week21 at 4 METS) on leisure-time activity. Physical activity expending 1000 kcal week21 has been associated with a 30% reduction in all-cause mortality rates, and a slightly favourable effect on all-cause mortality has been noted with physical activity as low a 500 kcal week21 (Kesaniemi et al.35). Lee et al.36 found that fit but overweight men (BMI $ 27.8 kg m22) had a similar rate of all-cause mortality to physically fit men of above normal weight and had a lower risk of all-cause mortality than unfit, normal weight men. Unfit men had substantially higher cardiovascular disease mortality than fit men in each BMI group36.
Numerous studies have shown a J- or U-shaped relationship between BMI and mortality6,37,38 and a U-shaped relationship between BMI and expenditure on health care39. Heitman et al.7suggested that the apparent U-shaped association between BMI and total mortality may be the result of compound risk functions from BF and FFM, e.g. total mortality was a linear function of high BF and low FFM. Allison et al.6 evaluated a hypothetical model in which death increased linearly with BF and decreased linearly with FFM. In spite of higher weights in our active subjects in 2003 than in 1993, the active subjects showed a desirable profile of body composition with preserved FFMI and smaller increases in FMI compared with sedentary subjects. On the other hand, sedentary subjects are at risk of becoming obese. Thus leisure-time activity appears to counteract some of the negative effects of high BMI. Public health initiatives should therefore stress the benefits of leisure-time activity on the positive effects on body composition in terms of morbidity6.
Study limitations
The main limitation of the study is that it consisted of two transversal measurements, made in two distinct samples of convenience. It is therefore possible that the body composition evolution observed between the two cohorts is accidental. However, the recruitment conditions and the measurement procedures were similar.
The socio-economic level was not assessed; however, we do not believe that it affected the prevalence of obesity. Our study did not adjust for smoking, menopausal status and other lifestyle determinants (diet, alcohol). Whole-body composition measurements in our study did not determine fat distribution, i.e. did not identify intra-abdominal versus subcutaneous obesity. Collection of body composition as well as of waist and hip circumfer-ence data in conjunction with body composition measurements is recommended for future studies. Conclusion
Overall the prevalence of overweight/obesity was 10% higher and the prevalence of high FMI was 8.0% higher in
2003 than in 1993 in a sample of convenience recruited in a Swiss city, and was mainly associated with an increase in fat mass. This observation remained statistically significant after adjustment for age, sex and leisure-time activity. Acknowledgements
Sources of funding: Foundation Nutrition 2000Plus. Conflict of interest declaration: none.
Authorship responsibilities: U.G.K. was involved in data design, collection of data, analysis of data and writing of the manuscript. L.G. and M.P.K. carried out analysis of data and writing of the manuscript. C.P. was involved in data design, data analysis, writing of the manuscript, and obtaining Institutional Review Board approval and funding.
References
1 James PT, Rigby N, Leach R. The obesity epidemic, metabolic syndrome and future prevention strategies. European Journal of Cardiovascular Prevention and Rehabilitation 2004; 11: 3 – 8.
2 National Center for Health Statistics (NCHS), Centers for Disease Control and Prevention. Prevalence of Overweight and Obesity Among Adults: United States [online]. Hyatts-ville, MD: NCHS, 2002. Available at http://www.cdc.gov/ nchs/products/pubs/pubd/hestats/obese/obse99.htm. Accessed 15 January 2007.
3 Silventoinen K, Sans S, Tolonen H, Monterde D, Kuulasmaa K, Kesteloot H, et al. Trends in obesity and energy supply in the WHO MONICA Project. International Journal of Obesity and Related Metabolic Disorders 2004; 28: 710 – 8.
4 Groscurth A, Vetter W, Suter PM. [Is the Swiss population gaining body weight? Body mass index in insurance applications between 1950 and 1990]. Schweizerische Rundschau fur Medizin Praxis 2003; 92: 2191 – 200. 5 Galobardes B, Costanza MC, Bernstein MS, Delhumeau CH,
Morabia A. Trends in risk factors for the major ‘lifestyle-related diseases’ in Geneva, Switzerland, 1993 – 2000. Annals of Epidemiology 2003; 13: 537 – 40.
6 Allison DB, Gallagher D, Heo M, Pi-Sunyer FX, Heymsfield SB. Body mass index and all-cause mortality among people age 70 and over: the Longitudinal Study of Aging. International Journal of Obesity and Related Metabolic Disorders 1997; 21: 424 – 31.
7 Heitmann BL, Erikson H, Ellsinger BM, Mikkelsen KL, Larsson B. Mortality associated with body fat, fat-free mass and body mass index among 60-year-old Swedish men – a 22-year follow-up. The study of men born in 1913. International Journal of Obesity and Related Metabolic Disorders 2000; 24: 33 – 7.
8 Goulenok C, Monchi M, Chiche JD, Mira JP, Dhainaut JF, Cariou A. Influence of overweight on ICU mortality: a prospective study. Chest 2004; 125: 1441 – 5.
9 Tremblay A, Bandi V. Impact of body mass index on outcomes following critical care. Chest 2003; 123: 1202 – 7. 10 Ogden CL, Carroll MD, Flegal KM. Epidemiologic trends in
overweight and obesity. Endocrinology and Metabolism Clinics of North America 2003; 32: 741 – 60.
11 Stolarczyk LM, Heyward VH, Van Loan MD, Hicks VL, Wilson WL, Reano LM. The fatness-specific bioelectrical impedance analysis equations of Segal et al: are they generalizable and practical? American Journal of Clinical Nutrition 1997; 66: 8 – 17.
12 Segal KR, Van Loan M, Fitzgerald PI, Hodgdon JA, Van Itallie TB. Lean body mass estimation by bioelectrical impedance analysis: a four-site cross over validation. American Journal of Clinical Nutrition 1988; 47: 7 – 14.
13 Van Itallie TB, Yang M-U, Heymsfield SB, Funk RC, Boileau RA. Height-normalized indices of the body’s fat-free mass and fat mass: potentially useful indicators of nutritional status. American Journal of Clinical Nutrition 1990; 52: 953 – 9.
14 Williamson DF, Madans J, Anda RF, Kleinmann JC, Kahn HS, Byers T. Recreational physical activity and ten-year weight change in a US national cohort. International Journal of Obesity 1993; 17: 279 – 86.
15 Gallagher D, Ruts E, Visser M, Heshka S, Baumgartner RN, Wang J, et al. Weight stability masks sarcopenia in elderly men and women. American Journal of Physiology 2000; 279: E366 – 75.
16 Hughes VA, Frontera WR, Roubenoff R, Evans WJ, Singh MA. Longitudinal changes in body composition in older men and women: role of body weight change and physical activity. American Journal of Clinical Nutrition 2002; 76: 473 – 81. 17 Heitmann BL, Garby L. Composition (lean and fat tissue) of
weight changes in adult Danes. American Journal of Clinical Nutrition 2002; 75: 840 – 7.
18 Lukaski HC, Bolonchuk WW, Hall CB, Siders WA. Validation of tetrapolar bioelectrical impedance measurements to assess human body composition. Journal of Applied Physiology 1986; 60: 1327 – 32.
19 Houtkooper LB, Lohman TG, Going SB, Howell WH. Why bioelectrical impedance analysis should be used for estimating adiposity. American Journal of Clinical Nutrition 1996; 64: 436S – 48S.
20 Kyle UG, Genton L, Karsegard L, Slosman DO, Pichard C. Single prediction equation for bioelectrical impedance analysis in adults aged 20 – 94 years. Nutrition 2001; 17: 248 – 53.
21 Kyle UG, Schutz Y, Dupertuis YM, Pichard C. Body composition interpretation: contribution of fat-free mass index and body fat mass index. Nutrition 2003; 19: 597 – 604. 22 Taylor HL, Jacobs DR Jr, Schucker B, Knudsen J, Leon AS, Debacker G. A questionnaire for the assessment of leisure time physical activities. Journal of Chronic Diseases 1978; 31: 741 – 55.
23 Kyle UG, Gremion G, Genton L, Slosman DO, Golay A, Pichard C. Physical activity and fat-free and fat mass as measured by bioelectrical impedance in 3853 adults. Medicine and Science in Sports and Exercise 2001; 33: 576 – 84.
24 Kyle UG, Morabia A, Schutz Y, Pichard C. Sedentarism affects body fat mass index and fat-free mass index in adults aged 18 – 98 y. Nutrition 2004; 20: 255 – 60.
25 Eichholzer M, Bernasconi F, Jordan P, Gutzwiller F. [Nutrition in Switzerland 2002 – results of the Swiss Health Survey]. Schweizerische Rundschau fur Medizin Praxis 2005; 94: 1713 – 21.
26 Mensink GB, Lampert T, Bergmann E. [Overweight and obesity in Germany 1984 – 2003]. Bundesgesundheitsblatt
Gesundheitsforschung Gesundheitsschutz 2005; 48: 1348 – 56.
27 Mataix J, Frias M, Martinez-de-Victoria E, Lopez-Jurado M, Aranda P, Llopis J. Factors associated with obesity in an adult Mediterranean population: influence on plasma lipid profile. Journal of the American College of Nutrition 2005; 24: 456 – 65.
28 Baumgartner RN, Koehler KM, Gallagher D, Romero L, Heymsfield SB, Ross RR, et al. Epidemiology of sarcopenia among the elderly in New Mexico. American Journal of Epidemiology 1998; 147: 755 – 63.
29 Kyle UG, Nicod L, Raguso C, Hans D, Pichard C. Prevalence of low fat-free mass index (FFMI) and high and very high body fat mass index (BFMI) following lung transplantation. Acta Diabetologica 2003; 40: S258 – 60.
30 Kyle U, Morabia A, Unger P, Slosman D, Pichard C. Contribution of body composition to nutritional assessment at hospital admission in 995 patients: a controlled population study. British Journal of Nutrition 2001; 86: 725 – 31. 31 Kyle UG, Raguso CA, Janssen JP, Pichard C. Body
composition differences in patients on home mechanical ventilation (hmv) compared to healthy volunteers during 1 y follow-up. Clinical Nutrition 2003; 22: S3.
32 Kyle UG, Genton L, Gremion G, Slosman DO, Pichard C. Aging, physical activity and height-normalized body composition parameters. Clinical Nutrition 2004; 23: 79 – 88. 33 Tager IB, Haight T, Sternfeld B, Yu Z, van Der Laan M. Effects of physical activity and body composition on functional limitation in the elderly: application of the marginal structural model. Epidemiology 2004; 15: 479 – 93.
34 Haapanen N, Miilunpalo S, Pasanen M, Oja P, Vuori I. Association between leisure time physical activity and 10-year body mass change among working-aged men and women. International Journal of Obesity and Related Metabolic Disorders 1997; 21: 288 – 96.
35 Kesaniemi YK, Danforth E Jr, Jensen MD, Kopelman PG, Lefebvre P, Reeder BA. Dose – response issues concerning physical activity and health: an evidence-based symposium. Medicine and Science in Sports and Exercise 2001; 33: S351 – 8.
36 Lee CD, Jackson AS, Blair SN. US weight guidelines: is it also important to consider cardiorespiratory fitness? Inter-national Journal of Obesity and Related Metabolic Disorders 1998; 22(Suppl. 2): S2 – S7.
37 Rissanen AM, Helio¨vaara M, Knekt P, Reunanen A, Aromaa A. Determinants of weight gain and overweight in adult Finns. European Journal of Clinical Nutrition 1991; 45: 419 – 30.
38 Cornoni-Huntley JC, Harris TB, Everett DF, Albanes D, Micozzi MS, Miles TP, et al. An overview of body weight of older persons, including the impact on mortality. The National Health and Nutrition Examination Survey 1 – Epidemiologic follow-up study. Journal of Clinical Epide-miology 1991; 44: 743 – 53.
39 Heithoff KA, Cuffel BJ, Kennedy S, Peters J. The association between body mass and health care expenditures. Clinical Therapy 1997; 19: 811 – 20.