Supplementary Information
Nanoparticle shapes of LiMnPO
4, Li
+diffusion orientation and
diffusion coefficients for high volumetric energy Li
+ion
cathodes
Nam Hee Kwon1, Hui Yin1, Tatiana Vavrova1, Jonathan H-W. Lim 2,3, Ullrich Steiner 3, Bernard Grobéty4, Katharina M. Fromm1
1 University of Fribourg, Department of Chemistry, Chemin du Musée 9, CH-1700 Fribourg, Switzerland
2 Thin Films and Interfaces Group - Optoelectronics Sector, Cavendish Laboratory, Department of Physics, University of Cambridge, J.J. Thomson Avenue, Cambridge CB3 0HE, United Kingdom
3 Adolphe Merkle Institute - Soft Matter Physics Group, Chemin des Verdiers 4, CH-1700 Fribourg, Switzerland
4 University of Fribourg, Department of Geosciences, Chemin du Musée 6, CH-1700 Fribourg, Switzerland
Electrochemical potential spectroscopy (EPS) Experimental method
The lithium ion diffusion coefficient was measured in a three-electrode open cell with lithium counter and reference electrodes with 1M LiPF6 in EC/DMC (Sigma)
inside a grounded Faraday cage housed in an argon glovebox. Electrochemical control and measurement were performed using a Bio-Logic SP-300 potentiostat. Electrochemical Potential Spectroscopy (EPS) is a variant of Potentiostatic Intermittent Titration Technique (PITT) where there is no open-circuit period applied between voltage steps. EPS was performed through chronoamperometric response measurements as 5 mV step voltages are applied. Charging measurements (lithium extraction) start from the initial open-circuit potential, the applied voltage is step-wise increased every 3 minutes until 4.4V (vs. Li/Li+). For the discharge portion
(lithium insertion), it is decreased instead, also in 5 mV steps, held for 3 minutes each until 2.5V (vs. Li/Li+).
The current transient response to applied step potential is described by the equation below, where l as the electrode thickness, F is Faraday’s constant and S is the electrode surface area. To avoid the need to calculate the difference between the concentration of the lithium ions at the surface (Cs) and bulk (Co), the EPS-derived
lithium ion diffusion coefficient (𝐷𝐷�Li,EPS) was calculated from the slope of the linear
portion of the natural log of the current transient ln(i(t)) vs. time t. As the slope equates to �−𝜋𝜋2𝐷𝐷�Li,EPS
4𝑙𝑙2 �, the 𝐷𝐷�Li,EPS can be calculated.
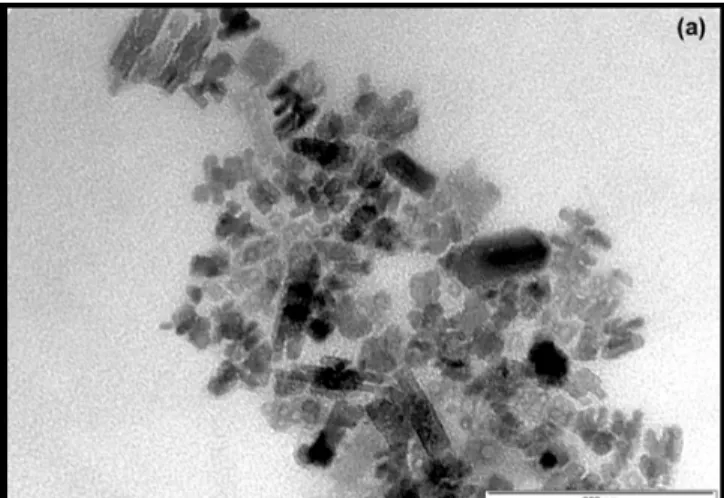
Fig. S1. TEM image of LiMnPO4 particles synthesized with manganese acetate.
Fig. S2. Rietveld refinement analysis of nano-LiMnPO4. The red is experimental and
the blue is calculated. The reliablility factors, Rwp (weighted profile R-factor) = 1.9663, Rexp (expected R-factor)= 0.9665, Rp= 1.4447, GOF (goodness of fit) = 4.1388.
Fig. S3. The pore size distribution of the composites, nano-LiMnPO4 and carbon