Assumption-free morphological quanti
fication of
single anisotropic nanoparticles and aggregates
†
Dimitri
Vanhecke, *
aLaura
Rodríguez-Lorenzo,
aCalum
Kinnear,
bEstelle
Durantie,
aBarbara
Rothen-Rutishauser
aand
Alke Petri-Fink
a,cCharacterizing the morphometric parameters of noble metal nanoparticles for sensing and catalysis is a persistent challenge due to their small size and complex shape. Herein, we present an approach to deter-mine the volume, surface area, and curvature of non-symmetric anisotropic nanoparticles using electron tomography and design-based stereology without the use of segmentation tools or modeling of the par-ticles. Finally, we apply these tools to aggregates to estimate their fractal dimension.
Introduction
Accurate characterization of nanomaterials is in high demand as it holds the key to understanding the structure–function relationship of these promising materials.1 Whereas nano-particles with simple geometries, such as spheres, can be approximated by mathematical models, complex anisotropic nano-objects cannot.
Au nanostars are currently considered as some of the most efficient photonic nanoparticles (NPs).2,3 The nanostars’ optical, and indeed physicochemical, properties are strongly dependent on local geometric factors with the areas of high surface curvature, i.e. the tips, typically dominating.4 Precise control and tuning of these geometric factors is particularly interesting for surface-enhanced spectroscopic, catalytic and sensing applications.5–10 as well as therapeutic approaches.11 Their anisotropic morphology cannot be reduced to simple models; it is the key to the functionality of these particles.12–14 In addition, the reactivity of NPs increases proportionally with the number of atoms on the surface. However, quantitative results for these vital morphological properties have not been fully addressed.15–18
Recently, there has been also increasing interest in produ-cing Au NP assemblies. Numerous colorimetric sensors based on Au NP aggregation, which utilize a measurable color change from red (single particle) to purple (aggregates), as a
quantification tool have been extensively developed.19 In addition, reversible Au NP assemblies are a crucial component of inks,20in technological applications, and as signal enhan-cers21in Raman scattering applications. These NP assemblies, even spherical ones, typically yield discrete anisotropic objects that are prone to bias in the determination of their surface area, the number of primary Au NPs per assembly and fractal dimensions.22 Therefore, it is necessary to develop suitable techniques to characterize these typically polydisperse and complex nanostructured assemblies.
One popular method to experimentally determine the specific surface area of nanomaterials is the Brunauer– Emmett–Teller (BET) technique.23 BET is a well-established method to measure the surface area of powders based on the physical adsorption of gas molecules.24 It has been widely applied to mesoporous NPs such as silica that present an extre-mely large surface area and are stable as a powder.25However, this method is potentially inaccurate for samples such as polymer surface functionalized NPs, most likely due to the degradation of the polymer shell upon heating leading to a loss of stability and aggregation of the NPs. Furthermore, it has been shown that it is challenging to correct for gas adsorp-tion onto the excess polymer in the sample.
Another option to assess the morphology is microscopy and electron tomography (ET) is the approach that offers sufficient resolution in three dimensions. Since precise tilting stages26 and sufficient computing power became available, this 3D imaging technique has found critical acclaim.27Amorphous or weakly diffracting objects, such as biological samples, domi-nated the first decade28of studies using ET, however, later it widely expanded into materials science29e.g. to characterize catalysts,30semiconductors,31ceramics,32 and has led to the first 3D atomic map of a Au nanorod.33
Quantification routines typically require a segmented dataset: in its simplest form, each voxel is either assigned to
†Electronic supplementary information (ESI) available. See DOI: 10.1039/ c6nr07884b
aUniversity of Fribourg, Adolphe Merkle Institute, Ch. des Verdiers 4, Fribourg, Switzerland. E-mail: [email protected]
bUniversity of Melborne, Bio21 Institute, 30 Flemington Rd, Parkville, VIC 3052, Australia
cUniversity of Fribourg, Chemistry Department, Ch. Du Musée 9, Fribourg, Switzerland
http://doc.rero.ch
Published in "Nanoscale 9(15): 4918–4927, 2017"
which should be cited to refer to this work.
the object or to the background resulting in a binary dataset.34 The number information can then be extracted from the binary dataset. Electron tomography data suffer from missing information at higher tilt angles in reciprocal space: with the increasing tilt angle the path length of the electrons in the sample increases until, at high angles typically above 70°, no signal is detected.35The result is a low signal-to-noise ratio, especially at the polar regions of the object. To cope with the missing information in such undersampled datasets, segmen-tation routines usually require user input, criteria, or thresholds such as an intensity limit in threshold-based methods or contour tracing in manual segmentation.
Here, we pursue an alternative approach for quantification that does not require segmentation of the datasets: stereology.
Stereology,36which literally translates from the Greek“the study of objects in 3-D”, is a branch of stochastic geometry,37 providing quantitative three-dimensional interpretations based on two-dimensional cross sections of objects.38These are characterized by avoiding the application of models nor are assumptions about the size, shape, orientation, intensity or distribution of structural features made.39 Interestingly, although stereology has its origin in materials science,40it is now predominantly used in histology and biomedical sciences,41,42 with several journals in the biomedical field demanding stereological methods for quantification.43,44
Here, we implement stereological methods on objects of interest to materials science. First, we present a stereological analysis of single anisotropic nanostars to quantify the surface area, volume and integrated curvature based on standard brightfield electron tomograms. We validated this approach in two ways: comparing surface, volume and curvature before and after a thermal reshaping process and by simulation experi-ments. Both validation approaches measure accuracy and pre-cision. The results of the stereological analysis were sub-sequently compared with threshold-based image quantifi-cation or BET gas adsorption measurements.
Second, we show the use of stereological methods to retrieve the volume, fractal dimension and average particle radius within particle aggregates. Both examples show that stereological analysis, combined with electron tomography, is an efficient tool to retrieve meaningful morphological para-meters of these promising but challenging materials.
Results
Morphology of Au nanostars by stereological analysis
A total of 16 brightfield TEM tomograms of single Au nano-stars were recorded in a systematic uniform random sampling procedure (SURS, ESI chapter 1†). The nanostars appear as electron dense objects of about 40 nm diameter with a varying number of tips, surrounded by a shell of lower electron density corresponding to surface grafted polyvinylpyrrolidone (PVP, Fig. SI-2, 3 and Video SI-1†). The 3D structure (Video SI-2†) confirms the interconnected nature of the individual spikes
across the particle, in excellent agreement with the high-resolution TEM observation reported previously.45
Stereological probes were used to estimate the surface area, volume and integrated mean curvature of single Au nanostars. Practically, when a probe,46 an isotropic set of parallel lines separated by a distance u (here: 4.6 nm, the same distance as the axial spacing of the ET), is randomly placed over the par-ticle’s 3D map (Fig. SI-4–8†), the surface area is a function of the number of intersections between this Fakir probe and the particle periphery, over all slices in the 3D map in all three orthogonal dimensions (XY, YZ, XZ, see the ESI† for formulas and a detailed stereological analysis for a single nanostar).
The volume is obtained in a similar fashion: a geometrical probe grid of equidistant crossings, known as the Cavalieri estimator47 and in essence a point grid created from two orthogonal sets of Fakir probes, is randomly placed over the 3D map (Fig. SI-4–8†). The volume of the particle can be esti-mated from the number of points located within the particle.48 Complementary to these two first-order parameters, the inte-grated mean curvature,49 a second-order parameter, can be obtained by sweeping an imaginary line across each slice (ran-domly, but for the ease of viewing the horizontal dimension was chosen) and registering the number of parallel tangent counts with the particle surface. Integrating the convex (Fig. SI-5–8†) and concave counts for all slices in the tomo-graphic 3D map in all three dimensions (XY, YZ, XZ) provides the data to calculate the curvature on a per particle basis. The results of these analyses can be found in Fig. 2. The Holmes effect arising from the use of optical slices is discussed in the ESI (chapter 3†).
Validation method I: comparison with modeled data
The area of Au isotropic nanospheres can be measured from 2D TEM micrographs, and the radius calculated based on the model of an exact sphere. In parallel, the volume of the nano-spheres was estimated using the Cavalieri estimator described above (Fig. 2, Table SI-1†). Assuming that the reshaped par-ticles are spheres, any statistical difference between the model-based calculation and the estimated stereological value must lead to the conclusion that the tested stereological approach is biased. However, as shown in Fig. 1, no significant difference between the model (42 300 nm3± 8000 nm3, n = 20) and the stereological approach (44 900 ± 8300 nm3, n = 20) was found. The coefficient of error (CE), a marker for precision, was found to be 2.8% (86% of the CE is noise, see Tables SI-1–3† for an example of this calculation and ESI chapter 8† for the detailed results). A similar conclusion could be drawn based on the surface area of the thermally reshaped nanospheres: no signifi-cant difference was found between the model-based, calcu-lated mean surface area (7800 nm2± 1300 nm2, n = 20) and the Fakir probe based stereological estimate (7200 nm2± 800 nm2, n = 20). Therefore, we conclude that stereology agrees with standard modeling methods.
Single brightfield TEM projections have limited use for the quantification of anisotropic objects, such as nanostars, due to the necessity of assumptions about the true 3D form of the
object. The design-based stereological approach overcomes these limitations and is therefore applicable to both isotropic and anisotropic particles.
Thermal reshaping of Au nanostars50 is a temperature-dependent process: weakly bound Au atoms from the convex tips of the nanostars are etched and re-deposited on more favorable adsorption sites in areas of concave curvature, i.e. where the tips join the core.51,52 During this process, a con-tinuous blue-shift in the absorbance of the LSPR tip-mode (λmax= 824 nm) can be observed which eventually merges with
the core-mode (λmax = 544 nm) of a spherical nanoparticle
(Fig. SI-10†).52 ET performed before (on Au nanostars) and after thermal reshaping (on Au nanospheres) was used to vali-date the accuracy of the stereological approach.
One advantage of stereological analysis on anisotropic Au nanostars is that it can be used to investigate the mechanism involved in thermal reshaping, i.e. whether the dominant process is surface melting or Ostwald ripening. The volume of the nanostars estimated by the Cavalieri approach before thermal reshaping was 35 100 ± 7200 nm3(CE = 1.62%), which is significantly lower than the nanospheres after reshaping as mentioned above (44 900 ± 8300 nm3, CE = 2.82%, Fig. 2A, ESI chapters 7 and 8†). The transformation is therefore likely due to a form of Ostwald ripening.50
The surface area of the nanostars was estimated by the Fakir method at 9700 ± 1800 nm2 (n = 16, Table SI-1†). Unsurprisingly, this result differed significantly (p < 0.001) from the surface area of the nanospheres obtained by the same Fakir method after the reshaping process (7200 ± 800 nm2, n = 20; Fig. 2B), despite the larger mean volume of the nanospheres. This difference reflects why star-like particles possess such great potential as catalysts: an excellent catalytic activity due to a greater surface-to-volume ratio.53In general, with the increasing anisotropic nature of the nanoparticle, its
catalytic activity enhances, as shown for platinum54 and silver55NPs.
Besides the first order parameters of volume and surface area, second order parameters such as the integrated mean curvature can be particularly useful to describe anisotropic objects. The integrated mean curvature estimation, Mv, is
defined as the curvature in each point on the particle surface integrated over the entire surface and corrected for its volume. For a closed object, such as nanoparticles, it is a single value. Mvis significantly higher ( p < 0.001) for nanostars than for
nanospheres: 0.0244 ± 0.0039 nm nm−3 versus 0.0160 ± 0.0017 nm nm−3(Fig. 2C, Tables SI-4 and 5†). It is interesting to note the presence of zones with both positive, i.e. convex (tips), and negative, i.e. concave (core), curvatures (Fig. SI-5 and SI-9†), a morphological characteristic that may play an important role in their reactivity. For example, the pKa of
acidic groups was found to shift depending on the proximity of neighboring ligands i.e. on the underlying radius of curva-ture of the NPs.56Numerous papers have clearly shown that the curvature of a solid surface influences the degree of confor-mational change induced in proteins upon binding. For example, phospholipid bilayers or enzyme adsorbed onto silica NPs57,58or BSA adsorbed on Au NP59surfaces showed a rapid conformational change at both secondary and tertiary structure levels. Moreover, the grafting density of ligands on surfaces can depend on the local curvature. It was shown that the number of thiolated methyl-poly(ethylene glycol) (PEG) ligands on the surface of Au NPs decreases as the diameter increases due to the change in curvature.60 Curvature is a crucial parameter in the utilization of nanostars in the
Fig. 1 Spherical particle volume based on 2D profiles (= model-based, left) is not significantly different from the model-free stereological esti-mate (right), vouching for the accuracy of the estiesti-mate since the LSPR absorbance spectrum (grey) matches the one of a nanosphere. Scale bar = 20 nm.
Fig. 2 Comparison of volume (A), surface area (B) and integrated mean curvature (C) between anisotropic nanostars and their thermally reshaped spherical counterparts.
medical field: when an electromagnetic field excites the free electrons of a Au nanostar, a highly localized, strong electric field develops at the sharp tips or vertices of high curvature.61 It is also the reason for the extremely high SERS activity of Au nanostars, which has been reported previously.3,5 Note that the integrated mean curvature cannot be retrieved from single projections.
These data highlight the importance of alternatives to model-based quantification and the accurate determination of descriptive parameters for nanomaterials.
Validation II: simulation
While quantification algorithms can extract information from the ET 3D maps, they rely on a preceding segmentation step. This step may produce unwanted effects, especially in ET data with its low signal-to-noise ratio. To demonstrate this, an ideal representation of a spherical Au nanoparticle was simulated in silico (Fig. 3, ESI chapter 6†). The object included a highly electron dense spherical particle (red) surrounded by a less dense shell (yellow) and nearby smaller spherical particles, mimicking fiducial markers (blue). The density of the particle is higher than the density of the shell but both vary according to a Poisson distribution, simulating shot noise of the camera. The volume of the central sphere, excluding the shell and fidu-cial markers, was probed in three ways: by mathematical calcu-lation, through threshold segmentation and by design-based stereology (Fig. 3).
The central sphere of the simulated object has a volume of 4.188 × 106pixel3(Fig. 3, black bar).
The stereological analysis (Cavalieri) was performed separ-ately by five scientists who were not involved in the study. Their average estimate of the central sphere was 4.180 × 106 pixel3± 0.053 × 106pixel3. There was no significant difference compared to the calculated result (Fig. 3, dark gray bar).
Finally, the volume of the central sphere was calculated after segmentation of the tomographic dataset.62 This approach is based on a histogram threshold rendering method whereby all pixels below a set limit, the threshold value, are assigned to the nano-object. The segmentation by threshold-ing resulted in an ambiguous result and varied as a function of the threshold value (Fig. 3, light gray bars), i.e. it was subjec-tive. Due to the simulated Poisson noise, low threshold values integrated parts of the shell and the surrounding fiducial markers with the central sphere, thereby overestimating the volume. High threshold values excluded the voxels belonging to the shell but at the expense of removing pixels from the central sphere, thereby underestimating its volume.
The lack of convergence in the threshold value, even in simulated data with high signal-to-noise ratio, is the root of the problematic use of thresholds for image quantification. Even basic software packages can provide a range of morpho-logical parameters (volume and surface being just the most basic ones), but the segmentation threshold value is often based on the experimenter’s prejudiced perception of how the object is expected to look. Even if a threshold value series is calculated (black line in Fig. 3) and a convergence value exists, the segmented object may not reflect reality but may be influ-enced by local density fluctuations. Software packages can indeed deliver quantification at astonishing precision but may fail to deliver accuracy. It is the experimenter’s duty to dis-tinguish sources of bias in the quantification and undertake action to avoid misinterpretation of the data. Choosing quanti-fication methods that are inherently bias-free could be an appealing means to fulfill this task.
Other methods
Alternatively, the specific surface area of nanomaterials, such as powders, can be determined experimentally by the Brunauer–Emmett–Teller (BET) technique. BET has been widely applied to mesoporous NPs, such as silica, that present an extremely large surface area and are stable as a powder. However, we could not achieve a BET readout for PVP stabil-ized Au NPs after freeze-drying, which was likely due to the loss of integrity of the PVP shell upon heating leading to a loss of stability and fusing of NPs. Even if a measurement could be made, the correction for gas adsorption onto the excess polymer in the sample would have been challenging.63,64
Precision of the stereological estimates
The stereological approach for these nanostars has a high cer-tainty, as was evaluated through the evolution of the standard error of the mean (SEM, Fig. SI-12†). Initially, the SEM drops with increasing number of particles (n); however, after approxi-mately five particles the change in the SEM with increasing n is minimal. Therefore, five randomly-chosen Au nanostars in
Fig. 3 Volume estimation of a simulated particle (red) surrounded by a shell (yellow) andfiducial markers (blue). The theoretical volume (black bar) and the stereological estimates (dark gray bar) do not vary signi fi-cantly. The stereological estimate was repeated byfive different scien-tists not involved in this study (n = 5). The result of the threshold seg-mentation was dependent on the threshold level (black line) and obvious convergence is not present. No single threshold level could extract the entire central sphere and entirely eliminate the shell and fiducial markers.
this study would have been statistically sufficient for an accu-rate stereological estimation. Of course, this number depends on the natural variance of the particle population (e.g. polydis-persity), the sampling methodology at the TEM, and the probe spacing (u).
Spherical Au NP aggregate analysis
The example above shows how standard microscopic methods can be efficiently expanded for the accurate characterization of single anisotropic particles. However, spherical particles usually yield irregular shaped aggregates in solid–liquid separ-ation processes (e.g. drying), or in complex media (e.g. biologi-cal fluids) by colloidal destabilization. This again yields aniso-tropic objects, precluding again characterization by light scat-tering methods and conventional microscopy. Here, we show how information (structure and mass) of such objects can be provided by the stereological toolbox.
Spherical Au NP aggregate volume
A total of 49 tomograms of discrete aggregates of Au nano-particles (Fig. 4A for an example) were recorded in an SURS fashion (one field empty, yielding 48 tomograms of aggre-gates). The 3D stacks (Fig. 4B) allowed for the counting of the number of particles per aggregate: between 1 and 146 single, spherical Au NPs (mean = 19.7, median = 13, example in Fig. 4C). The volume per aggregate is estimated by the Cavalieri probe, as described above. Altogether, these data provide the average particle volume: 2360 nm3± 480 nm3(CE = 18.0%, n = 48 tomograms). An average particle radius in the aggregates of 8.22 nm (± 0.22 nm, n = 947) can be estimated, assuming spherical particles. In parallel, the single particle radius was extracted from the TEM micrographs of non-aggre-gated, single particles obtained after image thresholding and image quantification (Fig. SI-12†) yielding an average radius of 8.34 nm (± 0.66 nm, n = 27 363). A student’s t-test showed that these two results are not significantly different (p = 0.1491), providing further evidence for the accuracy of the stereology-based method.
Fractal dimension of Au NP aggregates
The sandbox approach for the estimation of the fractal dimen-sion is based on the measurement of the area of the aggregate in 2D projections within a predefined box and natural log–log plot these data against the total area of the square. A linear relationship develops with the increasing size of the areas.
It can be shown that the slope of this relationship corres-ponds to the fractal dimension.65Expanding this idea to three dimensions requires the square to extend to a cube: boxes of increasing size are overlaid onto each counting slice (Fig. 4D, colors corresponding to Fig. 5, Fig. SI-13†) and the Cavalieri points, randomly placed inside the boxes, are counted
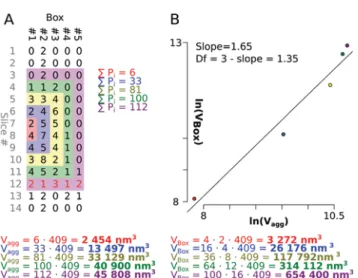
Fig. 4 Au NP aggregates and calculating their fractal dimension. (A) A TEM micrograph aggregate at 0° tilt. The overlapping of particles impedes the counting of the number of particles. (B) A 3D electron tomographic map of the same object. TheXY and XZ planes are depicted. The XZ plane shown corresponds to the level of the vertical black line shown in theXY plane. (C) The tomogram was used as the template for a 3D rendering, assuming spherical objects. (D) A slice (slice #12) through the stack with overlaid boxes and Cavalieri points. In red are the points that fall on the aggregate (2 in the red box, 1 in the blue,etc.). The number of points in each box are used in Fig. 5 to estimate the fractal dimension (compare the values for slice #12 in Fig. 5 with the counts in 4D). Scale bar = 50 nm.
Fig. 5 Example of the calculation of the fractal dimension of a particle. The counted Cavalieri points are listed according to their origin (slice, and within slice, which box). The volume of the aggregate of each box equals the point count multiplied by the thickness (0.34 nm), the area per point (100 nm2) and thek factor (12, see ESI chapter 3†), or the number of points multiplied by 409 (0.34 × 100 × 12). (B) The natural log of these values plotted against the natural log of the box’s volume. The slope of the least squares regression is used to calculate the fractal dimension.
(example in Fig. 4D: two in the red, smallest box, an additional one in the blue box, three more in the yellow box, etc.).
The results are summed over an increasingly higher number of slices, generating counts inside 3D boxes corres-ponding to the associated volume of the aggregate inside each box (Fig. 5, bottom, 5 boxes in total). The slope of a natural log–log plot of these volumes corresponds to 3 − Df(Fig. 5B).66
The average fractal dimension was estimated as 1.35 (± 0.43, n = 47). In order to validate the stereological approach, the fractal dimension was also assessed using a scaling concept67 yielding an average Dfof 1.26 (± 0.19, n = 47). There was no
sig-nificant difference between the two approaches (p = 0.195, see Fig. SI-14 and ESI chapter 13†). One “aggregate” had to be dis-carded from the population because its particle count was one, hence n = 47. The fractal dimension obtained fits with the for-mation of fractal aggregates following a rapid, di ffusion-limited cluster–cluster aggregation mechanism.68
Discussion
We showed that stereological analysis accurately estimated the volume of isotropic nano-objects both real and simulated. Furthermore, we used the stereology toolbox to extract infor-mation from aggregates of spherical particles. Finally, we showed that model-based techniques fail to deliver bias-free data for anisotropic nanoparticles because of limitations in modeling. Stereology does not suffer from these limitations.
The choice of imaging mode, such as bright field, (high angle) angular dark field scanning TEM (HAADF-STEM and AFD-STEM), does not interfere with the stereological analysis. For example, in crystalline structures, such as Au nanostars, diffraction contrast is present in the projection images and the projection requirement may not be fulfilled: the intensities in the reconstruction may make automated segmentation unreli-able and prone to bias. The Z-contrast in HAADF-STEM or ADF-TEM tomography data may facilitate the interpretation of boundaries, and therefore the automated analysis, but does not interfere with the stereological analysis.
We compared our results with other commonly used methods such as BET and measurement of the ET 3D maps by software algorithms. Both methods could not accurately esti-mate the desired morphological parameters.
Our results indicate that, in principle, the characterization of anisotropic NPs or aggregates can benefit from the appli-cation of conventional stereological methods. This method is readily applicable to any stack of aligned parallel slices, includ-ing TEM tomographic data independent of the imaginclud-ing mode (i.e. brightfield, annular dark field, scanning transmission mode, etc.). However, with an outlook of applying this tool more widely, the limitations of conventional ET should be borne in mind. It is important to remember that surface area is a function of resolution, e.g. if one could measure the curva-ture of individual surface atoms on a nanoparticle then the estimated surface area would increase dramatically.
The axial pixel size (the thickness of each slice) was 0.305 nm for the nanostars and 0.341 for the aggregates, about 1/150 of the diameter of the objects itself. This has impli-cations for the Holmes effect, an overprojection issue resulting in bias introduced if the slices are too thick (ESI chapter 3†).69
It could be shown that using only every kthsection reduces the total Holmes effect by a factor k.70The very small axial pixel size in the tomographic datasets is therefore positive for two reasons: (1) it reduces the Holmes effect and (2) it allows using high k factors ( practically, a k value of 15 was used for the nanostars, 12 for the aggregates), greatly increasing the efficiency of the analysis. The resolution of the nanostars study, calculated via the Crowther criterion (see ESI chapter 3†), was determined at 2.06 nm, which means that surface roughness on scales less than 2.06 nm could not be probed. The Au NP aggregate study had a resolution of 2.60 nm.
Besides the lack of assumptions on sample geometry, design-based stereology also avoids assumptions on particle orientation. Since the nanostars and nanospheres extend in roughly the same distance in all three dimensions, random orientation on the TEM grid can be expected from the nano-particles used in this study. However, the fulfillment of this assumption is clearly depending on the type of nanoparticle. It can be assumed that the drying of the Au NP aggregates caused them to flatten somewhat, which may bias the fractal dimension estimate. A cryoTEM study could be conducted to confirm this hypothesis. Furthermore, extremely anisotropic particles, such as filamentous objects, present additional challenges.
A final consideration is the limited tilt angles of conven-tional TEM goniometers which mean that all particles are undersampled in the polar regions. This effect is known as the missing wedge problem18,29and it has animated scholars to a variety of creative solutions. Materials that are not prone to electron beam damage can profit from dual axis tomo-graphy71,72 which reduces the missing wedge to a missing pyramid. On-axis tomography of needle-shaped samples can be tilted 360°,73effectively eliminating all problems caused by random orientation and the missing wedge.74Additionally, the sample geometry may allow certain a priori information to be considered and incorporated in model-based reconstruction algorithms such as DART.75 Finally, improvements in smart image segmentation tools76may improve the segmentation of noisy data.
These developments are not universally applicable to all materials and sample types, nevertheless, we still believe that the stereological approach suffers less than alternative approaches, such as threshold segmentation. This is because, firstly, the stereological approach does not require the interpretation of every voxel of the dataset; the geometrical probes define which voxels must be included, which is typi-cally a very small portion of the total dataset. And secondly, information from surrounding voxels can flow into the decision. For these reasons, we believe that stereological ana-lysis will stand a better chance to correctly interpret noisy data and missing wedge artefacts than threshold-based algorithms.
From an experimenter point of view, the quantifications should be accurate, precise and efficient, in that order. Accuracy in stereological quantifications is provided through the design of stereological probes, which are defined a priori to be accurate independent of the size, shape, spatial orien-tation, and spatial distribution of the geometrical features to be investigated.37The precision is affected by the object, i.e. by the heterogeneity of the distribution of its features in the sample. This is evident from the Au aggregates volume (CE = 18.0%), an object much more heterogeneous than Au nano-stars (CE = 1.62%). Heterogeneity of the distribution cannot be altered, but precision can be controlled by sampling. The efficiency is managed by the sampling procedure, and systema-tic sampling schemes are superior to any other approach (ESI chapter 12†).70
In conclusion, the methods to assess key geometric pro-perties of anisotropic nanoparticles are commonly deficient, biased or flawed. Here, we provide an approach that allows us to estimate crucial morphometric parameters such as volume, surface area, integrated curvature and fractal dimension on a per particle basis, without any need for modeling. These are key parameters that will help us to develop a predicative under-standing of the structure–function relationship of anisotropic nanoparticles.
Materials & methods
Gold nanostar synthesis
Nanostars were prepared by adding PVP-coated gold seeds ([Au] = 0.025 mM) in ethanol to a mixture of HAuCl4(0.5 mM)
and PVP (Mw= 10 000 g mol−1; 10 mM) in dimethylformamide
(DMF) under rapid stirring at room temperature. Within 20 min, the color of the dispersion changed from pink to blue, indicating the formation of Au nanostars. The sample was washed by centrifugation six times at 3029g for 20 min to remove excess PVP and redispersed in ethanol.
Gold nanoparticle aggregate synthesis
Single and agglomerated spherical Au NPs were prepared fol-lowing this procedure77 with an adaptation of the polymer coating. The tiopronin coated Au NPs: to a solution of tetra-chloroauric acid (500 mL, 0.05 mM) in ultrapure water (MilliQ, Merck Millipore) heated at reflux was quickly added a warmed solution of sodium citrate (25 mL, 1% w/v) and stirred for 15 minutes. The reaction mixture was cooled to room tempera-ture and a solution of tiopronin (15.5 mL, 0.5 mM) was added and stirred overnight.
Agglomeration was induced by the addition of 1 M HCl to reach a pH of 3. Agglomerates were stabilized by the addition of a mixture of polymers composed of poly(vinyl alcohol) (PVA) and poly(allylamine) (PAAm) (11.8% and 0.2% w/v, respect-ively). The sample was washed by centrifugation two times at 5000g for 60 min to remove excess of polymers and redispersed in 0.5 M aqueous sodium chloride solution.
Reshaping process
For the thermal reshaping, the washed Au nanostars were dis-persed in DMF (20 mL), at a Au concentration of 2 mM. The reshaping process was carried out at 140 °C under magnetic stirring for 6 h, with a color change observed from blue to pink.
Synthesis of gold NPs (fiducial markers)
Small (∼5 nm) Au NPs were synthesized by addition of sodium borohydride (4 mM) to a stirred solution of HAuCl4(2.2 mM)
and sodium citrate (6.6 mM). PVP was then added at a concen-tration of 10 PVP per nm2of NP surface area under magnetic stirring to stabilize the fiducial markers against aggregation on the TEM grid when the dispersion of nanostars in ethanol was added.
Electron microscopy
The micrographs for the nanostars and nanospheres in that study were recorded on a Tecnai F20 TEM (FEI, USA) at 0.307 nm point resolution. Sample preparation started with the dropcasting of fiducial markers (5 μL of the suspension of 5 nm Au NPs) on the formvar film of a 200 mesh copper TEM grid (Plano, Germany). The excess fluid was removed with filter paper and the sample was air-dried for 3 h. Then, on the same side of the grid, a drop of Au nanostar suspension (5 μL) was placed and again the excess fluid was removed with a filter paper and the sample was allowed to air-dry for 1 h. Image sampling is explained in detail in ESI chapter 1.†
Sixteen series of angular tilts between −60° and 60° at 2° increment were recorded in an SURS fashion (4 × 4 grid, see ESI chapter 1†), each containing only one Au nanostar sur-rounded by several dozens of fiducial markers. The tilt series were aligned and reconstructed using the fiducial marker algorithm in IMOD.58
The micrographs for the nanosphere aggregates and single, non-aggregated nanospheres were recorded on a Tecnai spirit TEM (FEI, USA) at 0.3412 nm point resolution. 200 μL of sample at a concentration of 0.5 mg mL−1 was nebulized on the formvar film of a single slot copper TEM grid (Plano, Germany). The sample was air-dried for 3 h.
Forty eight series of angular tilts between −60° and 60° at 1° increment were recorded in an SURS fashion (see ESI chapter 1,† 7 × 7 grid, field of view was empty, hence 48), each containing only one aggregate. The particles themselves were used as fiducial markers. The recorded tilt series can be aligned and reconstructed as discussed above. Image sampling is explained in detail in ESI chapter 1.†
Automated size analysis
Automated size analysis of micrographs of spherical Au NPs was performed in ImageJ. For the first step, the thresholding, the default algorithm was used, without any change of the automatically suggested settings. The analysis proper was per-formed by the“analyze particles routine”. The Major Axis was used as the indicator for diameter.
Statistical analysis
All statistical analyses (Student’s t-test and Bland–Altman plot) were performed in R 3.3.2.
Image processing and 3D rendering
Histogram thresholding, volume computing and 3D particle rendering were performed in Amira 4.3. For the histogram ren-dering, the default settings were used. The virtual Fakir probe representations were made in Blender 2.69.
Stereology
The Grid plugin of ImageJ78 was used to place geometric probes (Fakir and Cavalieri probes) digitally and randomly on the tomographic slices. In the case of the Cavalieri estimator, the crossings of the test lines were used as crosses for the Cavalieri estimator (area per point = 21.2 nm2), and the vertical lines were used as the Fakir probe. The ImageJ Reslice routine was used to obtain slices in the XZ and YZ orthogonal dimen-sions. Counting was done manually in ImageJ. The PVP-shell was neglected in the quantification. For all calculations, the length density (spacing between the probes) was 4.61 nm (u) in all dimensions.
Acknowledgements
C. Kinnear, D. Vanhecke, L. Rodriguez-Lorenzo, B. Rothen-Rutishauser and A. Petri-Fink are grateful for the financial support of the Adolphe Merkle Foundation, the Swiss National Science Foundation (PP00P2_123373) and the Swiss National Science Foundation through the National Centre of Competence in Research “Bio-Inspired Materials”. L. Rodriguez-Lorenzo acknowledges the financial support from the L’Oreal Switzerland and UNESCO’s fellowship program “For Women in Science 2013”. The support of the Dr Alfred Bretscher Fund is gratefully acknowledged, and access to TEM was kindly provided by the Microscopy Imaging Centre of the University of Bern. The authors are thankful to Dr Sandor Balog for his input.
References
1 P. Knittel, O. Bibikova and C. Kranz, Challenges in nano-electrochemical and nanomechanical studies of individual anisotropic gold nanoparticles, Faraday Discuss., 2016, 193, 353–369.
2 C. L. Nehl, H. W. Liao and J. H. Hafner, Optical properties of star-shaped gold nanoparticles, Nano Lett., 2006, 6, 683– 688.
3 L. Rodriguez-Lorenzo, et al., Zeptomol Detection Through Controlled Ultrasensitive Surface-Enhanced Raman Scattering, J. Am. Chem. Soc., 2009, 131, 4616–4618. 4 A.-I. Henry, et al., Correlated Structure and Optical Property
Studies of Plasmonic Nanoparticles, J. Phys. Chem. C, 2011, 115, 9291–9305.
5 L. Rodriguez-Lorenzo, R. A. Alvarez-Puebla, F. Javier Garcia de Abajo and L. M. Liz-Marzan, Surface Enhanced Raman Scattering Using Star-Shaped Gold Colloidal Nanoparticles, J. Phys. Chem. C, 2010, 114, 7336–7340.
6 L. Rodriguez-Lorenzo, et al., Intracellular mapping with SERS-encoded gold nanostars, Integr. Biol., 2011, 3, 922–926. 7 L. Rodriguez-Lorenzo, R. de la Rica, R. A. Alvarez-Puebla, L. M. Liz-Marzan and M. M. Stevens, Plasmonic nano-sensors with inverse sensitivity by means of enzyme-guided crystal growth, Nat. Mater., 2012, 11, 604–607.
8 S. K. Dondapati, et al., Label-free Biosensing Based on Single Gold Nanostars as Plasmonic Transducers, ACS Nano, 2010, 4, 6318–6322.
9 M. Schuetz, D. Steinigeweg, M. Salehi, K. Koempe and S. Schluecker, Hydrophilically stabilized gold nanostars as SERS labels for tissue imaging of the tumor suppressor p63 by immuno-SERS microscopy, Chem. Commun., 2011, 47, 4216–4218.
10 T. Vo-Dinh, et al., Plasmonic nanoprobes: from chemical sensing to medical diagnostics and therapy, Nanoscale, 2013, 5, 10127.
11 J. Li, et al., Gold nanoparticle size and shape influence on osteogenesis of mesenchymal stem cells, Nanoscale, 2016, 8, 7992–8007.
12 G. Lu, T. Z. Forbes and A. J. Haes, SERS detection of uranyl using functionalized gold nanostars promoted by nano-particle shape and size, Analyst, 2016, 141, 5137–5143. 13 E. A. Kwizera, et al., Size- and Shape-Controlled Synthesis
and Properties of Magnetic–Plasmonic Core–Shell Nanoparticles, J. Phys. Chem. C, 2016, 120, 10530–10546. 14 Q. Zhang, N. Large and H. Wang, Gold Nanoparticles with
Tipped Surface Structures as Substrates for Single-Particle Surface-Enhanced Raman Spectroscopy: Concave Nanocubes, Nanotrisoctahedra, and Nanostars, ACS Appl. Mater. Interfaces, 2014, 6, 17255–17267.
15 S. Barbosa, et al., Tuning Size and Sensing Properties in Colloidal Gold Nanostars, Langmuir, 2010, 26, 14943–14950. 16 C. Hrelescu, T. K. Sau, A. L. Rogach, F. Jackel and
J. Feldmann, Single gold nanostars enhance Raman scat-tering, Appl. Phys. Lett., 2009, 94, 153113.
17 S. H. Chen, Z. L. Wang, J. Ballato, S. H. Foulger and D. L. Carroll, Monopod, bipod, tripod, and tetrapod gold nanocrystals, J. Am. Chem. Soc., 2003, 125, 16186–16187. 18 T. K. Sau and C. J. Murphy, Room temperature, high-yield
synthesis of multiple shapes of gold nanoparticles in aqueous solution, J. Am. Chem. Soc., 2004, 126, 8648–8649. 19 L. Guo, Y. Xu, A. R. Ferhan, G. Chen and D.-H. Kim,
Oriented Gold Nanoparticle Aggregation for Colorimetric Sensors with Surprisingly High Analytical Figures of Merit, J. Am. Chem. Soc., 2013, 135, 12338–12345.
20 P. K. Kundu, et al., Light-controlled self-assembly of non-photoresponsive nanoparticles, Nat. Chem., 2015, 7, 646–652.
21 L. Zhang, et al., Light-Triggered Reversible Self-Assembly of Gold Nanoparticle Oligomers for Tunable SERS, Langmuir, 2015, 31, 1164–1171.
22 T. Kim, C.-H. Lee, S.-W. Joo and K. Lee, Kinetics of gold nanoparticle aggregation: Experiments and modeling, J. Colloid Interface Sci., 2008, 318, 238–243.
23 S. Brunauer, P. H. Emmett and E. Teller, Adsorption of Gases in Multimolecular Layers, J. Am. Chem. Soc., 1938, 60, 309–319.
24 K. S. Walton and R. Q. Snurr, Applicability of the BET Method for Determining Surface Areas of Microporous Metal−Organic Frameworks, J. Am. Chem. Soc., 2007, 129, 8552–8556.
25 K. S. Sing, Adsorption methods for the characterization of porous materials, Adv. Colloid Interface Sci., 1998, 76–77, 3–11.
26 J. Frank, Electron tomography: Three-dimensional imaging with the transmission electron microscope, Plenum Press, 1992.
27 M. Bárcena and A. J. Koster, Electron tomography in life science, Semin. Cell Dev. Biol., 2009, 20, 920–930.
28 B. F. McEwen and M. Marko, The Emergence of Electron Tomography as an Important Tool for Investigating Cellular Ultrastructure, J. Histochem. Cytochem., 2001, 49, 553–563.
29 P. A. Midgley and M. Weyland, 3D electron microscopy in the physical sciences: the development of Z-contrast and EFTEM tomography, Ultramicroscopy, 2003, 96, 413–431. 30 H. Friedrich, P. E. de Jongh, A. J. Verkleij and K. P. de Jong,
Electron Tomography for Heterogeneous Catalysts and Related Nanostructured Materials, Chem. Rev., 2009, 109, 1613–1629.
31 H. Bender, O. Richard, A. Kalio and E. Sourty, 3D-analysis of semiconductor structures by electron tomography, Microelectron. Eng., 2007, 84, 2707–2713.
32 R. Krsmanović, S. Bals, G. Bertoni and G. Van Tendeloo, Structural characterization of Er-doped Li2O–Al2O3– SiO2 glass ceramics, Opt. Mater., 2008, 30, 1183–1188. 33 B. Goris, et al., Atomic-scale determination of surface
facets in gold nanorods, Nat. Mater., 2012, 11, 930– 935.
34 E. Biermans, L. Molina, K. J. Batenburg, S. Bals and G. Van Tendeloo, Measuring Porosity at the Nanoscale by Quantitative Electron Tomography, Nano Lett., 2010, 10, 5014–5019.
35 A. J. Koster, et al., Perspectives of Molecular and Cellular Electron Tomography, J. Struct. Biol., 1997, 120, 276–308. 36 M. J. West, Introduction to Stereology, Cold Spring Harb.
Protoc., 2012, 834–851.
37 V. Howard and M. Reed, Unbiased Stereology: Three-Dimensional Measurement in Microscopy, Garland Science, 2nd edn, 2005.
38 M. Ochs, The Closer we Look the more we See? Quantitative Microscopic Analysis of the Pulmonary Surfactant System, Cell. Physiol. Biochem., 2010, 25, 27–40. 39 T. M. Mayhew and H. J. G. Gundersen,‘If you assume, you
can make an ass out of u and me’: A decade of the disector for stereological counting of particles in 3D space, J. Anat., 1996, 188, 1–15.
40 A. Delesse, Procédé mécanique pour déterminer la compo-sition des roches, C. R. Hebd. Seances Acad. Sci., 1847, 25, 544–545.
41 J. R. Nyengaard and H. J. G. Gundersen, Direct and efficient stereological estimation of total cell quantities using electron microscopy, J. Microsc., 2006, 222, 182–187. 42 C. Brandenberger, et al., Quantitative evaluation of cellular
uptake and trafficking of plain and polyethylene glycol-coated gold nanoparticles, Small, 2010, 6, 1669–1678. 43 K. Madsen, The art of counting, J. Am. Soc. Nephrol., 1999,
10, 1124–1125.
44 C. Saber, Any way you cut it: a new journal policy for the use of unbiased counting methods, J. Comp. Neurol., 1996, 364, 5.
45 P. S. Kumar, i. Pastoriza-Santos, B. Rodríguez-González, F. J. García de Abajo and L. M. Liz-Marzán, High-yield syn-thesis and optical response of gold nanostars, Nanotechnology, 2008, 19, 015606.
46 L. Kubinova and J. Janacek, Estimating surface area by the isotropic fakir method from thick slices cut in an arbitrary direction, J. Microsc., 1998, 191, 201–211.
47 R. P. Michel and L. M. Cruz-Orive, Application of the cava-lieri principle and vertical sections method to lung - esti-mation of volume and pleural surface-area, J. Microsc., 1988, 150, 117–136.
48 M. A. Howard, N. Roberts, M. García-Fiñana and P. E. Cowell, Volume estimation of prefrontal cortical sub-fields using MRI and stereology, Brain Res. Protoc., 2003, 10, 125–138.
49 J. W. Cahn, Significance of average mean curvature and its determination by quantitative metallography, Trans. Metall. Soc. AIME, 1967, 239, 610.
50 L. Rodriguez-Lorenzo, J. M. Romo-Herrera, J. Perez-Juste, R. A. Alvarez-Puebla and L. M. Liz-Marzan, Reshaping and LSPR tuning of Au nanostars in the presence of CTAB, J. Mater. Chem., 2011, 21, 11544–11549.
51 C. M. Aguirre, T. R. Kaspar, C. Radloff and N. J. Halas, CTAB mediated reshaping of metallodielectric nano-particles, Nano Lett., 2003, 3, 1707–1711.
52 L. M. Liz-Marzan, Tailoring surface plasmons through the morphology and assembly of metal nanoparticles, Langmuir, 2006, 22, 32–41.
53 X. Miao, et al., A facile synthetic route for the preparation of gold nanostars with magnetic cores and their reusable nano-hybrid catalytic properties, Nanoscale, 2011, 3, 1189–1194. 54 B. R. Cuenya, Metal Nanoparticle Catalysts Beginning to
Shape-up, Acc. Chem. Res., 2013, 46, 1682–1691.
55 N. H. Jang, J. S. Suh and M. Moskovits, Effect of surface geometry on the photochemical reaction of 1,10-phenan-throline adsorbed on silver colloid surfaces, J. Phys. Chem. B, 1997, 101, 8279–8285.
56 D. Wang, et al., How and Why Nanoparticle’s Curvature Regulates the Apparent pK(a) of the Coating Ligands, J. Am. Chem. Soc., 2011, 133, 2192–2197.
57 S. Ahmed, Z. Nikolov and S. L. Wunder, Effect of Curvature on Nanoparticle Supported Lipid Bilayers Investigated by
Raman Spectroscopy, J. Phys. Chem. B, 2011, 115, 13181– 13190.
58 M. Lundqvist, I. Sethson and B. H. Jonsson, Protein adsorption onto silica nanoparticles: Conformational changes depend on the particles’ curvature and the protein stability, Langmuir, 2004, 20, 10639–10647.
59 P. Roach, D. Farrar and C. C. Perry, Surface tailoring for controlled protein adsorption: Effect of topography at the nanometer scale and chemistry, J. Am. Chem. Soc., 2006, 128, 3939–3945.
60 K. Rahme, et al., PEGylated gold nanoparticles: polymer quantification as a function of PEG lengths and nano-particle dimensions, RSC Adv., 2013, 3, 6085–6094.
61 R. Alvarez-Puebla, L. M. Liz-Marzán and F. J. García de Abajo, Light concentration at the nanometer scale, J. Phys. Chem. Lett., 2010, 1, 6.
62 E. A. F. Van Doren, P.-J. R. H. De Temmerman, M. A. D. Francisco and J. Mast, Determination of the volume-specific surface area by using transmission electron tomography for characterization and definition of nano-materials, J. Nanobiotechnol., 2011, 9, 17.
63 Y. Borodko, S. M. Humphrey, T. D. Tilley, H. Frei and G. A. Somorjai, Charge-transfer interaction of poly(vinylpyr-rolidone) with platinum and rhodium nanoparticles, J. Phys. Chem. C, 2007, 111, 6288–6295.
64 K. A. Carrado and L. Q. Xu, Materials with controlled meso-porosity derived from synthetic polyvinylpyrrolidone-clay composites, Microporous Mesoporous Mater., 1999, 27, 87–94. 65 S. R. Forrest and T. A. Witten, Long-range correlations in smoke-particle aggregates, J. Phys. A: Math. Gen., 1979, 12, L109–L117.
66 J. Y. H. Liao, C. Selomulya, G. Bushell, G. Bickert and R. Amal, On Different Approaches to Estimate the Mass Fractal Dimension of Coal Aggregates, Part. Part. Syst. Charact., 2005, 22, 299–309.
67 L. Rodriguez-Lorenzo, B. Rothen-Rutishauser, A. Petri-Fink and S. Balog, Nanoparticle Polydispersity Can Strongly Affect In Vitro Dose, Part. Part. Syst. Charact., 2015, 32, 321–333.
68 S. Y. Park, J. S. Lee, D. Georganopoulou, C. A. Mirkin and G. C. Schatz, Structures of DNA-Linked Nanoparticle Aggregates, J. Phys. Chem. B, 2006, 110, 12673–12681. 69 A. Holmes, 1927, Petrographic methods and calculations,
Murby, London.
70 H. J. G. Gundersen and E. B. Jensen, The efficiency of sys-tematic-sampling in stereology and its prediction, J. Microsc., 1987, 147, 229–263.
71 D. N. Mastronarde, Dual-Axis Tomography: An Approach with Alignment Methods That Preserve Resolution, J. Struct. Biol., 1997, 120, 343–352.
72 C. Messaoudi, N. G. Loubresse, T. Boudier, P. Dupuis-Williams and S. Marco, Multiple-axis tomography: appli-cations to basal bodies from Paramecium tetraurelia, Biol. Cell, 2006, 98, 415–425.
73 L. Molina, et al., Barrier efficiency of sponge-like La2Zr2O7 buffer layers for YBCO-coated conductors, Supercond. Sci. Technol., 2011, 24, 065019.
74 X. Ke, et al., Three-Dimensional Analysis of Carbon Nanotube Networks in Interconnects by Electron Tomography without Missing Wedge Artifacts, Microsc. Microanal., 2010, 16, 210–217.
75 K. J. Batenburg, et al., 3D imaging of nanomaterials by dis-crete tomography, Ultramicroscopy, 2009, 109, 730–740. 76 C. Page, D. Hanein and N. Volkmann, Accurate membrane
tracing in three-dimensional reconstructions from electron cryotomography data, Ultramicroscopy, 2015, 155, 20–26. 77 V. Hirsch, et al., In vitro dosimetry of agglomerates,
Nanoscale, 2014, 6, 7325.
78 T. J. Collins, ImageJ for microscopy, BioTechniques, 2007, 43, 25–30.