READ THESE TERMS AND CONDITIONS CAREFULLY BEFORE USING THIS WEBSITE. https://nrc-publications.canada.ca/eng/copyright
Vous avez des questions? Nous pouvons vous aider. Pour communiquer directement avec un auteur, consultez la
première page de la revue dans laquelle son article a été publié afin de trouver ses coordonnées. Si vous n’arrivez pas à les repérer, communiquez avec nous à PublicationsArchive-ArchivesPublications@nrc-cnrc.gc.ca.
Questions? Contact the NRC Publications Archive team at
PublicationsArchive-ArchivesPublications@nrc-cnrc.gc.ca. If you wish to email the authors directly, please see the first page of the publication for their contact information.
NRC Publications Archive
Archives des publications du CNRC
This publication could be one of several versions: author’s original, accepted manuscript or the publisher’s version. / La version de cette publication peut être l’une des suivantes : la version prépublication de l’auteur, la version acceptée du manuscrit ou la version de l’éditeur.
Access and use of this website and the material on it are subject to the Terms and Conditions set forth at
Process Parameters and Modeling Features Affecting Interfacial Heat
Transfer Coefficients in the Casting of a Semi-Solid 357 Aluminum Alloy
Sheehy, Claudia; Bouchard, Dominique; Charette, André
https://publications-cnrc.canada.ca/fra/droits
L’accès à ce site Web et l’utilisation de son contenu sont assujettis aux conditions présentées dans le site LISEZ CES CONDITIONS ATTENTIVEMENT AVANT D’UTILISER CE SITE WEB.
NRC Publications Record / Notice d'Archives des publications de CNRC:
https://nrc-publications.canada.ca/eng/view/object/?id=4102cd24-9c65-40e1-ae41-0e08b000154d https://publications-cnrc.canada.ca/fra/voir/objet/?id=4102cd24-9c65-40e1-ae41-0e08b000154dThis paper is subject to revision. Statements and opinions advanced in this paper or during presentation are the author’s and are his/her responsibility, not the Association’s. The paper has been edited by NADCA for uniform styling and format. For permission to publish this paper in full or in part, contact NADCA, 241 Holbrook, Wheeling, Illinois, 60090, and the author.
Process Parameters and Modeling Features Affecting Interfacial Heat
Transfer Coefficients in the Casting of a Semi-Solid 357 Aluminum Alloy
C. Sheehy and D. Bouchard
Aluminium Technology Center, National Research Council Canada, Chicoutimi, Québec
A. Charette
Université du Québec à Chicoutimi, Chicoutimi, Québec
ABSTRACT
A study was carried out to identify process parameters and modeling features affecting interfacial heat transfer coefficients in the casting of a semi-solid 357 aluminum alloy. A 2-level screening design was created to evaluate the effect of 5 process parameters on these coefficients. The varied parameters were the following: set die temperature, intensification pressure, plunger velocity, lubricant type and lubricant quantity. The interfacial heat transfer coefficients were calculated with an inverse heat conduction method using as inputs the measured die temperatures obtained from the various casting conditions in the screening design. The effects of these process parameters were quantified considering 2 response variables: the peak value of the coefficients and the time the coefficients decreased to 5 % of their peak value. The intensification pressure was found to be dominant for both response variables. It was also observed that features in the finite element model used to solve the inverse heat conduction problem affected the coefficients. The features investigated in the model were: the thermocouple cavity, its depth, its base angle and the presence of the thermocouple inside the cavity. The depth at which the thermocouple cavity was modeled was found to be the prevailing feature affecting the coefficients.
INTRODUCTION
Numerical modeling is an essential tool to optimize casting processes but the accuracy of the results is largely dependent on the boundary conditions that are specified. An important boundary condition in the modeling of high pressure die casting process is the interfacial heat transfer coefficient (IHTC) located between the casting and the die. This coefficient refers to the thermal conductance whose inverse is the thermal resistance. In high pressure die casting, the greatest thermal resistance in the entire process is at this location1 and it is thus fundamental to characterize it as accurately as possible. The evolutions of the casting-die contact and the corresponding heat transfer have been described in several studies2-10. Typically, the heat transfer at the casting-die interface is characterized in term of 3 physical mechanisms2, 4, 5: 1) the IHTC reaches a maximum value as the metal contacts the die, a consequence of a conforming contact that provides a large heat transfer, 2) solidification creates a nonconforming contact, impairing the heat transfer at the casting-die interface and decreasing the IHTC and 3) a gap develops between the casting and the die, leading to a poor heat transfer and low values in the IHTCs.
IHTCs have been reported to be sensitive to process parameters11, 12 and must be experimentally evaluated. Typically, temperatures measured in the die with thermocouples are used as input data to solve an inverse heat conduction problem and the calculated IHTCs are those reproducing the measured temperatures. This process parameter dependence can partially explain the large differences observed for example in the peak values reported for the various IHTCs listed in Table 1. Caution must thus prevail when simulations are carried out with IHTC values selected elsewhere. In addition, the calculations to solve the inverse heat conduction problem that yield the IHTCs call upon a computer model. Consequently, IHTC values are also affected by assumptions and features in the model.
A series of tests were carried out in this study to evaluate the impact of the main process parameters on the IHCTs in the high pressure die casting of a semi-solid 357 aluminum alloy. Set die temperature, intensification pressure, plunger velocity, lubricant type and lubricant quantity were the varied process parameters. A 2-level screening design was created to evaluate their effects on the evolution of the die temperature and the calculated IHTCs. The study also examined the effect of various features in the finite element (FE) model utilized to solve the inverse heat conduction problem. The FE model was modified to account for the effect of the cavity machined into the die to insert the thermocouple, its depth, its base angle and the presence of the thermocouple inside the cavity.
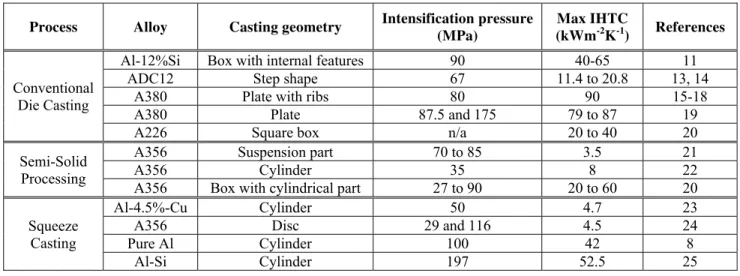
Table 1. IHTC values for different high pressure die casting processes using aluminum alloys.
Process Alloy Casting geometry Intensification pressure (MPa)
Max IHTC
(kWm-2K-1) References
Conventional Die Casting
Al-12%Si Box with internal features 90 40-65 11
ADC12 Step shape 67 11.4 to 20.8 13, 14
A380 Plate with ribs 80 90 15-18
A380 Plate 87.5 and 175 79 to 87 19
A226 Square box n/a 20 to 40 20
Semi-Solid Processing
A356 Suspension part 70 to 85 3.5 21
A356 Cylinder 35 8 22
A356 Box with cylindrical part 27 to 90 20 to 60 20
Squeeze Casting
Al-4.5%-Cu Cylinder 50 4.7 23
A356 Disc 29 and 116 4.5 24
Pure Al Cylinder 100 42 8
Al-Si Cylinder 197 52.5 25
EXPERIMENTAL PROCEDURES
CASTING GEOMETRY AND THERMOCOUPLE LOCATION
The castings produced in this study had a geometry having the shape of a wedge. One surface was flat while the other was slightly tilted with a 2° angle. A schematic representation of the casting and its dimensions is shown in Figure 1. The casting thickness varied from 15.8 mm near the gate to 9.1 mm at the tip, over a length of 191.8 mm. The thickness was 11.4 mm near the location where temperatures were measured with a K-type thermocouple (TC) inserted in the mobile platen of the die, 1.6 mm from the interface. That thermocouple was along the longitudinal center of the wedge and 222.1 mm from the center of the 80 mm diameter gate. Tests were also carried out with additional thermocouples (up to 5) with three of them located further from the interface (6 and 16 mm). However, the results with these additional thermocouples were not used in the present work.
Figure 1. Schematic representation of the wedge-shape casting. Dimensions are in mm.
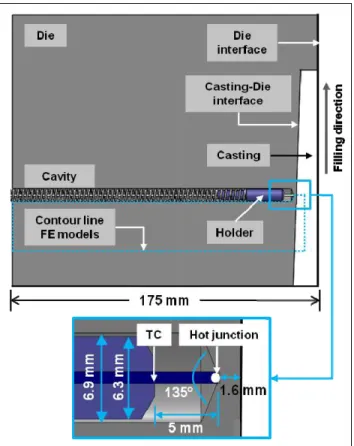
Figure 2 illustrates the thermocouple location inside the die. The thermocouple (TC) had a sheath diameter of 0.81 mm (wire diameter of 0.13 mm) and an exposed hot junction. It was placed perpendicular to the isotherms, as recommended26-28. A
spring was utilized to insure a good contact between the thermocouple hot junction and the cavity bottom. A steel holder was used to secure the thermocouple with a spring and was 5 mm from the thermocouple hot junction. The thermocouple, holder and spring were inserted inside a drilled cavity which had a diameter of 6.9 mm. The angle produced by the drill bit at the cavity base was 135°. The contour line that physically represents the geometry of the main FE model is shown by the dotted line in Figure 2 and is also illustrated in greater details in Figure 3.
Figure 2. Thermocouple (TC) location inside the die.
FEEDSTOCK PREPARATION
The castings were produced with 357 aluminum alloy and the chemical composition is shown in Table 2. The SEED technology was employed to produce the semi-solid slugs that were injected in the die casting press. The feedstock preparation has been described in details elsewhere29. The slugs had the following characteristics before the injection: 80 mm in diameter, 200 mm in length, a mass of 2.2 kg and a temperature of 591 °C, which corresponded to a solid fraction of approximately 36 %.
Table 2. Chemical composition of 357 aluminum alloy used to produce the slugs. Composition in wt%.
Elements Si Mg Ti Fe Cu
(%) 7.05 0.60 0.11 0.09 0.01
Elements Mn Zn Ni Cr Al
(%) 0.004 0.003 0.002 0.001 Bal.
CASTING CONDITIONS
A screening design was created to optimize the number of experiments to be realized and also to indentify which of the 5 process parameters investigated had the most significant influence on the IHTCs. This 2-level screening design was produced with the Statgraphics Centurion statistical analysis software30 and consisted of the half fraction (25-1) of a full factorial design which provided a capability to distinguish all the main effects and their interactions (resolution V). This screening design implied 16 experiments and was repeated 3 times for a total of 48 runs. Process parameters such as the type of lubricant (Lub), the set die temperature on the temperature control units (Tset), the second stage plunger velocity during die filling (Vp),
the intensification pressure (P) and the quantity of lubricant (Q) were varied for each experiment following the levels shown in Table 3.
Table 3. Levels of the 5 process parameters. Process parameters Lub* Tset (°C) Vp (ms-1) P (MPa) Q (layers) 2 levels (48 tests) A B 200 260 0.2 0.6 40 90 2 6
*A: oil-silicon mixture and B: oil emulsion
The slugs were injected in a cold chamber high pressure die casting press (Bühler, model SC N/53). The die was made of H13 steel. The arithmetic average roughness, Ra, at the surface of the die was 0.7 µm and measured with a portable meter
(Mitutoyo, model SJ-201). Two temperature control units (Regloplas, models 310DG and 315L) using Regloplas 300 oil were utilized to maintain the die and the shot sleeve at the set die temperature (Tset). Before each experiment, one of the
selected lubricants (Lub), 3 % dilution with water, was sprayed in layers (Q) at the die surface with an automated spraying system (Rimrock, model 414). The two lubricants studied were an oil-silicon mixture and an oil emulsion. The experiments were all carried out when the die was in thermal steady state and this was verified from the thermocouple readings in the die. Once this steady state was achieved, a semi-solid slug was produced, transferred to the shot sleeve and injected in the die. The plunger velocity (Vp) and the intensification pressure (P) were previously set in a program used by the die casting press.
During each experiment, the temperatures were recorded with a data acquisition system (Dataq, model DI-8B40) at a frequency of 600 Hz. The cold junction of the thermocouple was inserted in an ice/water mixture.
MODELING AND INVERSE HEAT CONDUCTION PROBLEMS
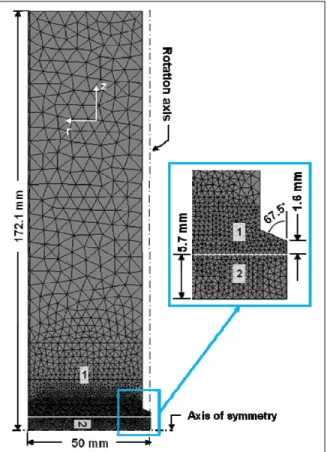
FE models representing the casting in contact with the die were built to evaluate by inverse calculation the IHTCs at the casting-die interface. The FE software ProCAST31 was utilized to create the models and solve the inverse heat conduction problems. Figure 3 shows the main FE model used to determine the IHTCs of this study. This model includes the cavity in which the thermocouple was inserted. Additional FE models were created to study the impact of other modeling features on the IHTCs. These features included the absence of the thermocouple cavity inside the die, the variation of the cavity depth, the modification of the angle at the cavity base and the presence of the thermocouple inside the cavity. The FE models representing these features are presented in the next section.
FE models were defined as axisymmetric considering the presence of the thermocouple cavity. The rotation axis is shown in Figure 3. An axis of symmetry was applied to the casting whose thickness considered in the FE models was 5.7 mm. A three dimensional (3-D) mesh for which the θ-direction was represented with only one element layer was created. The model assumed that heat transfer took place solely by conduction and the software computed the temperature evolution in the die and the casting by solving the transient heat conduction equation:
ߩሺܶሻడுሺ்ሻడ் డ்డ௧െ ሾ݇ሺܶሻܶሿ ൌ Ͳ Equation 1
Where,
ൌడడ ଵడఏడ డ௭డ Equation 2
And,
ܪሺܶሻ ൌ ்ܿ ݀ܶ ܮሾͳ െ ݂௦ሺܶሻሿ Equation 3
Cylindrical coordinates were utilized since the FE models were defined as axisymmetric. The IHTCs were estimated by applying Newton’s law of cooling at the interface between the die and the casting:
ݍሺݐሻ ൌ ݄ሺݐሻሺܶ௦ሺݐሻ െ ܶௗ௦ሺݐሻሻ Equation 4
The materials properties for the 357 aluminum alloy were determined with a software (Virtual Measurement System32) using the chemical composition of the alloy given in Table 2. The calculated liquidus and solidus temperatures of this alloy were respectively 614.5 and 557.5 °C. The materials properties for the H13 steel of the die were selected from the ProCAST databank. The initial die temperature used in the FE models was the one provided by the thermocouple inserted in the die near the interface. Die filling was assumed adiabatic and the initial casting temperature considered for all the calculations was the one measured just prior to the injection (591 °C). The boundaries of the FE models were all defined as adiabatic. The thickness of the die considered in the model, the presence of the rotation axis for the die and an axis of symmetry for the casting made this a reasonable assumption. Since the IHTCs were missing in this heat transfer model, they had to be calculated by solving an inverse heat conduction problem. This was accomplished using a Maximum a posteriori (MAP) algorithm from the ProCAST software. The algorithm iterated the IHTCs values until an agreement was found between the computed and measured temperatures according to a least squares error minimization. Thus, the estimated coefficients were those that best reproduced the experimentally measured temperatures. Greater details on the theoretical background of the MAP algorithm are given elsewhere33. To realize the first iteration, IHTC start values were provided for specified times. In addition, it was assumed that the IHTCs had the same evolution at each node of the interface. This implied, among other things, that the deformation between the casting and the die was uniform during solidification and that the air gap would possess the same physical properties along the interface. The last steps prior to performing the inverse calculation were to select the node in the FE model that corresponded to the location of the temperature measurements and to provide the software a file containing the experimentally measured temperatures. As mentioned earlier, the experimental design was repeated 3 times. In order to reduce the number of inverse calculations and the amount of computational time, only the average temperature evolution of the 3 repetitions was used.
RESULTS AND DISCUSSION
EFFECT OF PROCESS PARAMETERS ON IHTC
To indentify which of the 5 process parameters investigated had the most significant influence on the IHTCs, 2 response variables were analyzed: one being the peak value of the IHTCs (hpeak) and the other the time at which their values reached a
quasi steady state. The latter was arbitrarily defined as the time when the coefficient decreased to 5 % of its peak value (t5%)
and was used to discriminate between the highly transient regime that preceded the quasi steady state. Table 4 provides the details of the experimental design as well as the results for the 2 analyzed response variables. The peak values vary in a range between 9800 and 15500 Wm-2K-1. This is in fair agreement with the value of 8000 Wm-2K-1 reported in the thixocasting of an A356 alloy22. Table 4 also shows that the quasi steady state was produced after a time period from 9.4 to 13.1 s. Heat transfer into the die becomes relatively sluggish once this time is reached.
Table 4. Details of the 2-level screening design (25-1) and results for the response variables hpeak and t5%.
Run
n
o
.
Process parameters Response variables
Lub * Tset (°C) V p (ms -1 ) P (M Pa) Q (layers) h peak (W m -2 K -1 ) t5% (s) 1 A 200 0.2 90 2 11667.9 11.4 2 A 200 0.2 40 6 9895.9 13.0 3 A 200 0.6 40 2 12694.5 11.4 4 A 200 0.6 90 6 15516.8 9.7 5 A 260 0.2 40 2 13742.6 9.7 6 A 260 0.2 90 6 14613.2 9.4 7 A 260 0.6 90 2 14795.2 9.4 8 A 260 0.6 40 6 12868.4 11.2 9 B 200 0.2 40 2 12088.7 10.4 10 B 200 0.2 90 6 11690.9 11.0 11 B 200 0.6 90 2 14199.4 10.2 12 B 200 0.6 40 6 9817.0 13.1 13 B 260 0.2 90 2 13193.8 10.6 14 B 260 0.2 40 6 10045.8 12.2 15 B 260 0.6 40 2 12744.9 10.9 16 B 260 0.6 90 6 13985.9 10.0
*A: oil-silicon mixture and B: oil emulsion
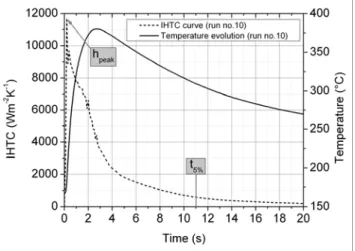
These response variables were provided by the IHTC curve, of which an example (taken from run no. 10 presented in Table 4) is given in Figure 4. The average measured temperature evolution, from which the IHTC curve was calculated, is also illustrated in the same figure. As the metal was injected, the die temperature rapidly increased to reach a maximum of 380 °C after approximately 2.5 s and slowly decreased thereafter. The IHTC values rose abruptly to a peak of 11690 Wm- 2K-1 and this was followed by a substantial decrease as solidification proceeded.
Figure 4. Temperature evolution (average of 3 trials) obtained from the thermocouple located in the die (1.6 mm from
the casting-die interface) and corresponding IHTC curve with the peak value (hpeak) and the selected time (t5%) for the
quasi steady state.
Statistical analysis
Table 5 illustrates the analysis of variance (ANOVA) using the hpeak values as the response variable for the screening design.
The letters A to E are associated to the 5 process parameters presented in the screening design (A: Lub, B: Tset, C: Vp, D: P
and E: Q). The quantities in the columns are standard and further discussed, for example in reference34. Also shown in the table are percent contributions that represent the ratio of the variability of the source (listed in the first column) to the total variability of the experimental results. It is seen that all the main parameters significantly affect the hpeak values and that many
considered too small (less than 0.5 %). The table shows that the most significant parameter is the intensification pressure, D, with a contribution close to 33 %. The interaction between pressure and lubricant quantity, denoted by D x E in the table, also contributes for approximately 15 % of the variability followed by plunger velocity at 12 %. An adjusted coefficient of regression ሺܴௗଶ ) of 94.7 % is obtained and represents the percentage of the variability in the response explained by the selected process parameters and interactions, after adjustments to account for the degrees of freedom (DOF). The effect of pressure on the results is different from that of Hamasaiid and al.18, 35 who reported no such effect on their IHTC peak values when casting liquid A380 aluminum between 70 and 95 MPa.
Table 5. ANOVA of the screening design with hpeak as the response variable.
Source of Vari ati o n DOF Sum of square s Vari ance
F-Ratio P-Value Percent
contributi o n A:Lub 1 4028140 4028140 24.23 0.0044 8.2 B:Tset 1 4429680 4429680 26.65 0.0036 9.1 C:Vp 1 5860290 5860290 35.25 0.0019 12.1 D:P 1 15533900 15533900 93.45 0.0002 32.8 E:Q 1 2799880 2799880 16.84 0.0093 5.6 A x B 1 1035260 1035260 6.23 0.0548 1.9 A x E 1 2790170 2790170 16.78 0.0094 5.6 B x C 1 1043020 1043020 6.27 0.0542 1.9 C x D 1 1549840 1549840 9.32 0.0283 2.9 D x E 1 7014790 7014790 42.2 0.0013 14.6 All other/error 5 831160 166232 5.3 Total 15 46916100 100.0 R2 = 98.2 % ܴௗଶ = 94.7 %
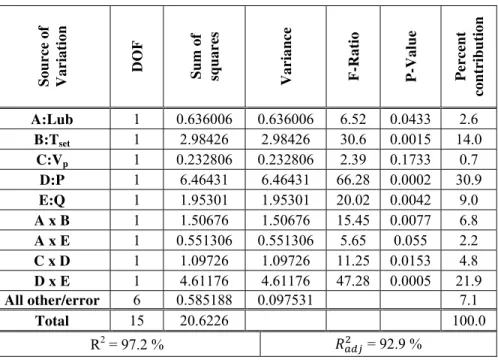
A similar analysis was performed for the t5% values and the results are shown in Table 6. The results show that pressure, D,
and its interaction with lubricant quantity, D x E, have again the predominant contributions. The plunger velocity is now negligible but the set die temperature replaces it with a contribution of 14 %.
Table 6. ANOVA of the screening design with t5% as the response variable.
Source of Vari ati o n DOF Sum of square s Vari ance
F-Ratio P-Value Percent
contributi o n A:Lub 1 0.636006 0.636006 6.52 0.0433 2.6 B:Tset 1 2.98426 2.98426 30.6 0.0015 14.0 C:Vp 1 0.232806 0.232806 2.39 0.1733 0.7 D:P 1 6.46431 6.46431 66.28 0.0002 30.9 E:Q 1 1.95301 1.95301 20.02 0.0042 9.0 A x B 1 1.50676 1.50676 15.45 0.0077 6.8 A x E 1 0.551306 0.551306 5.65 0.055 2.2 C x D 1 1.09726 1.09726 11.25 0.0153 4.8 D x E 1 4.61176 4.61176 47.28 0.0005 21.9 All other/error 6 0.585188 0.097531 7.1 Total 15 20.6226 100.0 R2 = 97.2 % ܴௗଶ = 92.9 %
EFFECT OF MODELING FEATURES ON IHTC
To complete the study, the FE model presented in Figure 3 was modified to observe the effect of some modeling features on the IHTCs. The calculations were all performed using experimental run no. 10 presented in Table 4.
Effect of the thermocouple cavity
The effect of a thermocouple cavity on the distortion of the thermal fields and the IHTCs calculated by inverse methods has been reported for various processes36-43. In addition, criteria have been devised to determine whether or not the thermocouple cavity should be accounted in the FE model38, 40, 41. In spite of this, the quantitative effect of the thermocouple cavity on the calculated IHTCs has received little attention in solidification processing. A straightforward method of quantifying this effect is by comparing the results obtained when the cavity is accounted in the FE model (as in Figure 3) and when it is not. The resulting IHTCs with these two models are shown in Figure 5 and it is seen that the impact of ignoring the cavity has a significant effect. The cavity acts as an insulator and disrupts the thermal field in the die producing a hot spot at its base. The temperatures measured at this location will thus yield the biased IHTC curve seen in Figure 5 if this is not accounted in the geometry of the FE model.
Figure 5. Effect of thermocouple cavity on the calculated IHTCs (1: die, 2: casting).
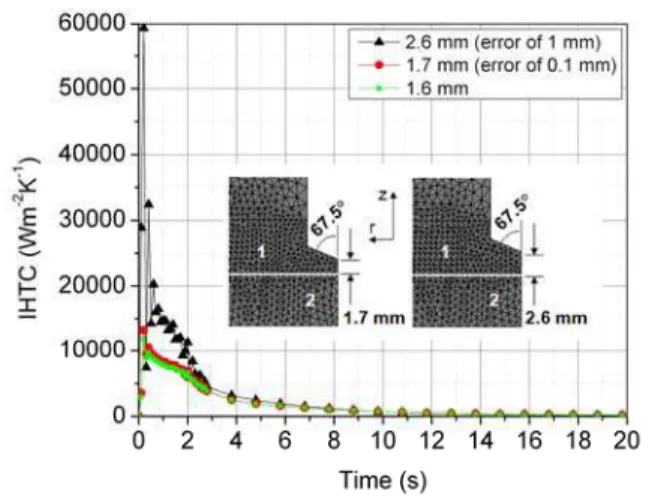
Effect of the cavity depth
The cavity depth is also an effect that has been discussed in the literature37, 41, 43 but has not received widespread attention in solidification processing. Since the thermocouple hot junction is at the cavity base, a measurement error of the cavity depth can have repercussions on the calculated IHTCs. The effect is illustrated in Figure 6 where the IHTCs were calculated with 3 identical FE models except for the depths of the cavities. In the first calculation, the depth is located at 1.6 mm from the interface as shown in Figure 2 and Figure 3. This value represented the experimentally measured depth of the thermocouple cavity. The second and third calculations were performed assuming measurement errors of 0.1 and 1 mm respectively. Thus, the base of the cavity was located respectively at 1.7 and 2.6 mm from the interface.
The results show that the effect is mainly in the IHTC peak value and that it is quite significant with an error of 1 mm with the peak value being increased up to 5 times. Dies used in high pressure die casting are usually massive and 1 mm can represent a small percentage error of the total thickness.
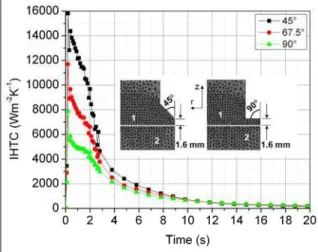
Effect of angle at the cavity base
Machining the thermocouple cavity with a drill bit normally produces a slope at its base. For example, in this study, a slope with an angle of 135° was produced and this is illustrated in Figure 2. It should be noted that due to symmetry, only half of the cavity is modeled and hence the angles correspond to half of the total (see Figure 3). Since the hot junction of the thermocouple is located at the cavity base, an incorrect representation of the slope in the FE model may influence the calculated IHTCs. Three base cavity angles were evaluated (45°, 67.5° and 90°) and the calculated IHTCs are illustrated in Figure 7. The results clearly show that due account must be given to this feature.
Figure 7. Effect of the base cavity angle on the calculated IHTCs (1: die, 2: casting).
Effect of the thermocouple inside the cavity
Figure 8 illustrates the effect of adding the thermocouple inside the cavity of the FE model. A perfect thermal contact between the thermocouple and the cavity base is assumed and no attempt is made to model the shape of the hot junction. Also, it is assumed that the entire thermocouple is made of stainless steel (SS304). The effect of the thermocouple is therefore exaggerated and further work will be required to model the contact between the thermocouple and the cavity base more accurately. It however appears that the IHTC curve is not significantly changed by the presence of the thermocouple in the cavity of the FE model.
Figure 8. Effect of adding the thermocouple inside the cavity. The effect is seen to be small in spite that it should be maximized by the assumptions in the model (1: die, 2: casting).
CONCLUSION
The main process parameters found to affect IHTCs peak values and time for quasi steady state in high pressure die casting of a semi-solid 357 aluminum alloy were identified using a screening design. Intensification pressure and its interaction with the quantity of lubricant were found to be the dominant source in the variation of these 2 response variables. The peak IHTC values varied between 9800 and 15500 Wm-2K-1 while the time for quasi steady state varied between 9.4 and 13.1 s. Features in the FE model utilized to calculate the IHTCs were also found to have a significant effect on their peak values but less so on the time for quasi steady state. The results showed that errors in the thermocouple cavity depth could severely increase the peak values. Other features were also found to affect the IHTCs and were, in decreasing order of importance: the cavity, its base angle and the presence of the thermocouple inside the cavity. The study brings out the importance to have a FE model that represents the physical system as accurately as possible.
ACKNOWLEDGMENTS
Technical assistance from Dany Drolet, Marie-Ève Larouche, Hugues Blanchette and Michel Perron, all with the Aluminum Technology Center, is acknowledged.
NOMENCLATURE
cp Specific heat, Jkg-1K-1
fs Solid fraction
h, IHTC Interfacial heat transfer coefficient, Wm-2K-1 H Enthalpy, J kg-1 k Thermal conductivity, Wm-1K-1 L Latent heat, J kg-1 q Heat flux, Wm-2 r, θ, z Cylindrical coordinates, m t Time, s T Temperature, °C
ܶ௦ Casting surface temperature, °C ܶௗ௦ Die surface temperature, °C
ρ Density, kg m-3
REFERENCES
1. Kou, S., “Transport Phenomena and Materials Processing”, J. Wiley & Sons inc., New York, NY, pp. 434-436 (1996). 2. Fortin, G., Louchez, P., and Samuel, F.H., “Factors Controlling Heat Transfer Coefficient at the Metal-Mold Interface
during Solidification of Aluminum Alloys”, AFS Transactions, Des Plaines, IL, vol. 100, pp. 863-871 (1992). 3. Griffiths, W.D., “Modelled Heat Transfer Coefficients for Al-7 wt.% Si Alloy Castings Unidirectionally Solidified
Horizontally and Vertically Downwards”, Materials Science and Technology, vol. 16, no. 3, pp. 255-260 (March 2000). 4. Ho, K. and Pehlke, R.D., “Mechanisms of Heat Transfer at a Metal/Mold Interface”, AFS Transactions, Des Plaines, IL,
vol. 92, pp. 587-598 (1984).
5. Ho, K. and Pehlke, R.D., “Metal/Mold Interfacial Heat Transfer”, Metallurgical Transactions B, vol. 16B, no. 3, pp. 585-594 (September 1985).
6. Lewis, R.W. and Ransing, R.S., “A Correlation to Describe Interfacial Heat Transfer during Solidification Simulation and Its Use in the Optimal Feeding Design of Castings”, Metallurgical and Materials Transactions B, vol. 29B, no. 2, pp. 437-448 (April 1998).
7. Nishida, Y., Droste, W., and Engler, S., “The Air-Gap Formation Process at the Casting/Mold Interface and the Heat Transfer Mechanism Through the Gap”, Metallurgical and Materials Transactions B, vol. 17B, no. 4, pp. 833-844 (December 1986).
8. Nishida, Y. and Matsubara, H., “Effect of Pressure on Heat Transfer at the Metal-Mould/Casting Interface”, British
Foundryman, vol. 69, no. 11, pp. 274-278 (November 1976).
9. Schmidt, P. and Svensson, I.L., “Heat Transfer and Air Gap Formation in Permanent Mould Casting of Aluminium Alloys”, Materials Research Center, The Royal Institute of Technology, Stockholm (1994).
10. Wang, H.S., Tseng, H.L., Hwang, W.S., Weng, R.J., and Yeh, J.L., “Measurements of Interfacial Heat Transfer Coefficients during the Casting of High Temperature Alloys in Sand Mold and Ceramics Mold”, Modeling of casting,
11. Dour, G., Dargusch, M., Davidson, C., and Nef, A., “Development of a Non-Intrusive Heat Transfer Coefficient Gauge and Its Application to High Pressure Die Casting: Effect of the Process Parameters”, Journal of Materials Processing
Technology, vol. 169, no. 2, pp. 223-233 (November 2005).
12. Hamasaiid, A., Dour, G., Dargusch, M.S., Loulou, T., Davidson, C., and Savage, G., “Heat-Transfer Coefficient and In-Cavity Pressure at the Casting-Die Interface during High-Pressure Die Casting of the Magnesium Alloy AZ91D”,
Metallurgical and Materials Transactions A, vol. 39A, no. 4, pp. 853-864 (April 2008).
13. Guo, Z.-P., Xiong, S.-M., Liu, B.-C., Li, M., and Allison, J., “Effect of Process Parameters, Casting Thickness, and Alloys on the Interfacial Heat-Transfer Coefficient in the High-Pressure Die-Casting Process”, Metallurgical and
Materials Transactions A, vol. 39A, no. 12, pp. 2896-2905 (December 2008).
14. Guo, Z.P., Xiong, S.M., Liu, B.C., Li, M., and Allison, J., “Determination of the Metal/Die Interfacial Heat Transfer Coefficient and Its Application in Evaluating the Pressure Distribution Inside the Casting During the High Pressure Die Casting Process”, International Journal of Cast Metals Research, vol. 22, no. 1-4, pp. 327-330 (August 2009).
15. Hamasaiid, A., Dour, G., Dargusch, M., Lou, T.L., Davidson, C., and Savage, G., “Heat Transfer At The Casting/Die Interface In High Pressure Die Casting - Experimental Results And Contribution To Modelling”, Modeling of Casting,
Welding and Advanced Solidification Processes - XI, Opio, France (28 May - 2 June 2006).
16. Dargusch, M.S., Hamasaiid, A., Dour, G., Loulou, T., Davidson, C.J., and Stjohn, D.H., “The Accurate Determination of Heat Transfer Coefficient and Its Evolution with Time During High Pressure Die Casting of Al-9%Si-3%Cu and Mg-9%Al-1%Zn Alloys”, Advanced Engineering Materials, vol. 9, no. 11, pp. 995-999 (November 2007).
17. Dargusch, M.S., Hamasaiid, A., and Dour, G., “An Inverse Model to Determine the Heat Transfer Coefficient and Its Evolution with Time During Solidification of Light Alloys”, International Journal of Nonlinear Sciences and Numerical
Simulation, vol. 9, no. 3, pp. 275-282 (2008).
18. Hamasaiid, A., Wang, G., Davidson, C., Dour, G., and Dargusch, M.S., “Interfacial Heat Transfer during Die Casting of an Al-Si-Cu Alloy”, Metallurgical and Materials Transactions A, vol. 40A, no. 13, pp. 3056-3058 (December 2009). 19. Hong, S., Backman, D.G., and Mehrabian, R., “Heat Transfer Coefficient in Aluminum Alloy Die Casting”,
Metallurgical Transactions B, vol. 10B, no. 2, pp. 299-301 (June 1979).
20. Schnorf, T., Gabathuler, J.P., and Imwinkelried, T., “Heat Transfer Coefficients for Pressure Diecasting and Semi-Solid-Forming”, Modeling of Casting, Welding and Advanced Solidification Processes - X, Destin, FL (25-30 May 2003). 21. Bouchard, D., Colbert, J., Pineau, F., Laplume, F., and Hamel, F.G., “Characterization of Contact Heat Transfer
Coefficients and Mathematical Modeling of a Semi-Solid Aluminium Die Casting”, Proceedings of the 8th International
Conference on Semi-Solid Processing of Alloys and Composites - S2P, Limassol, Chypre (21-23 September 2004).
22. Orgeas, L., Gabathuler, J.-P., Imwinkelried, T., Paradies, C.J., and Rappaz, M., “Modelling of Semi-Solid Processing Using a Modified Temperature-Dependant Power-Law Model”, Modelling and Simulation in Materials Science and
Engineering, vol. 11, no. 4, pp. 553-574 (2003).
23. Cho, I.S. and Hong, C.P., “Evaluation of Heat-Transfer Coefficients at the Casting/Die Interface in Squeeze Casting”,
Cast Metals, vol. 9, no. 4, pp. 227-232 (1996).
24. Krishna, P., Bilkey, K.T., and Pehlke, R.D., “Estimation of Interfacial Heat Transfer Coefficient in Indirect Squeeze Casting”, AFS Transactions, Des Plaines, IL, vol. 109 (2001).
25. Sekhar, J.A., Abbaschian, G.J., and Mehrabian, R., “Effect of Pressure on Metal-Die Heat Transfer Coefficient During Solidification”, Materials Science and Engineering, vol. 40, no. 1, pp. 105-110 (September 1979).
26. Luck, R., Berry, J.T., Pehlke, R., Johnson, A., and Weathers, J., “The Determination of Accurate Heat Transfer Coefficient Data for Permanent Mold Aluminum Alloy Casting - The Results of an AFS Research Project”, AFS Transactions, Des Plaines, IL, vol. 114 (2006).
27. Pehlke, R.D., Wan, X., Berry, J.T., Luck, R., Johnson, A., and Weathers, J., “Sensor Positioning And The Problems Of Solidification Model Validation”, Modeling of Casting, Welding and Advanced Solidification Processes - XI, Opio, France (28 May - 2 June 2006).
28. Weathers, J., Johnson, A., Luck, R., Walters, K., and Berry, J.T., “Effects of Thermocouple Placement on Highly Transient Temperature Measurements in Mold Media for Aluminum Castings”, AFS Transactions, Schaumburg, IL, vol. 113 (2005).
29. Langlais, J., Lemieux, A., Bouchard, D., and Sheehy, C., “Development of a Versatile Rheocasting Technology”, SAE
2006 World Congress & Exhibition, Detroit, MI (April 2006).
30. Statgraphics Centurion XV, version 15.0.04, StatPoint inc. (2005). 31. ProCAST, version 2009.0, Esi Group (2009).
32. Virtual Measurement System for Al alloys, version 1.03, National Physical Laboratory (2003).
33. Rappaz, M., Desbiolles, J.L., Drezet, J.M., Gandin, C.A., Jacot, A., and Thevoz, P., “Application of Inverse Methods to the Estimation of Boundary Conditions and Properties”, Modeling of Casting, Welding and Advanced Solidification
Processes VII, London, UK (10-15 Septembre 1995).
35. Hamasaiid, A., Dour, G., Dargusch, M., Loulou, T., Davidson, C., and Savage, G., “Heat Transfer at the Casting/Die Interface in High Pressure Die Casting - Experimental Results and Contribution to Modelling”, The Minerals, Metals &
Materials Society, pp. 1205-1212 (2006).
36. Beck, J.V. and Hurwicz, H., “Effect of Thermocouple Cavity on Heat Sink Temperature”, Journal of Heat Transfer, vol. 82, no. 1, pp. 27-36 (February 1960).
37. Berry, J., Luck, R., Pehlke, R., Johnson, A., and Weathers, J., “Temperature Measurements for Thermal Contact Calculations in Permanent Molding of Aluminum Alloys”, Simulation of Aluminum Shape Casting Processing: From
Alloy Design to Mechanical Properties, San Antonio, TX (12-16 March 2006).
38. Caron, E., Wells, M.A., and Li, D., “A Compensation Method for the Disturbance in the Temperature Field Caused by Subsurface Thermocouples”, Metallurgical and Materials Transactions B, vol. 37B, no. 3, pp. 475-483 (June 2006). 39. Dour, G., Dargusch, M., and Davidson, C., “Recommendations and Guidelines for the Performance of Accurate Heat
Transfer Measurements in Rapid Forming Processes”, International Journal of Heat and Mass Transfer, vol. 49, no. 11-12, pp. 1773-1789 (June 2006).
40. Franco, G.A., Caron, E., and Wells, M.A., “Quantification of the Surface Temperature Discrepancy Caused by
Subsurface Thermocouples and Methods for Compensation”, Metallurgical and Materials Transactions B, vol. 38B, no. 6, pp. 949-956 (December 2007).
41. Li, D. and Wells, M.A., “Effect of Subsurface Thermocouple Installation on the Discrepancy of the Measured Thermal History and Predicted Surface Heat Flux during a Quench Operation”, Metallurgical and Materials Transactions B, vol. 36B, no. 3, pp. 343-354 (June 2005).
42. Attia, M.H., Cameron, A., and Kops, L., “Distortion in Thermal Field Around Inserted Thermocouples in Experimental Interfacial Studies, Part 4: End Effect”, Journal of Manufacturing Science and Engineering, vol. 124, no. 1, pp. 135-145 (February 2002).
43. Badri, A.B. and Cramb, A.W., “Thermocouples - What Temperature Are They Measuring?”, 59th Electric Furnace