HAL Id: hal-03028985
https://hal.archives-ouvertes.fr/hal-03028985
Submitted on 27 Nov 2020HAL is a multi-disciplinary open access archive for the deposit and dissemination of sci-entific research documents, whether they are pub-lished or not. The documents may come from teaching and research institutions in France or abroad, or from public or private research centers.
L’archive ouverte pluridisciplinaire HAL, est destinée au dépôt et à la diffusion de documents scientifiques de niveau recherche, publiés ou non, émanant des établissements d’enseignement et de recherche français ou étrangers, des laboratoires publics ou privés.
Optical monitoring of the electrochemical nucleation and
growth of silver nanoparticles on electrode: from single
to ensemble nanoparticles inspection
Jean-François Lemineur, Jean-Marc Noël, Catherine Combellas, Frédéric
Kanoufi
To cite this version:
Jean-François Lemineur, Jean-Marc Noël, Catherine Combellas, Frédéric Kanoufi. Optical monitoring of the electrochemical nucleation and growth of silver nanoparticles on electrode: from single to ensem-ble nanoparticles inspection. Journal of Electroanalytical Chemistry, Elsevier 2020, 872, pp.114043. �10.1016/j.jelechem.2020.114043�. �hal-03028985�
Optical Monitoring of the Electrochemical Nucleation and
Growth of Silver Nanoparticles on Electrode: From Single
to Ensemble Nanoparticles Inspection
Jean-François Lemineur, Jean-Marc Noël, Catherine Combellas, Frédéric Kanoufi*
Université de Paris, ITODYS, CNRS-UMR 7086, 15 rue Jean-Antoine de Baïf, 75013 Paris, France.
*
correspondence to: frederic.kanoufi@univ-paris-diderot.fr
Abstract
The electrochemical nucleation and growth of nanoparticles (NPs) on an electrode surface at a constant potential is traditionally followed by recording the resulting current density during the experiment. The obtained chronoamperometric transients are average measurements, making it difficult to separate individual NP behaviors and to study their cross-talks. Herein, the recently developed Backside Absorbing Layer Microscopy (BALM) is employed to monitor optically in situ and operando the electrodeposition of silver NPs. This latter technique exploits a pseudo-antireflective and metallic contrast layer and allows both sub-nanometer vertical and sub-micrometer spatial resolutions. The information from the recorded movies is readily exploited to study the NP electrodeposition at the single entity level. The image sequences allow quantifying the local electrodeposition of nanomaterials onto the electrode surface, probing the NP dynamics through the extraction of single optical NP growth transients, and analyzing the effect of the neighboring nuclei on the growth of individual NPs.
Introduction
Metallic nanoparticles (NPs) are intensively studied,1,2 as they possess interesting physical and chemical properties that depend on their composition3 and surface chemistry,4 but also on their size and shape.3,5,6 Among the various fabrication methods, the electrochemical deposition offers several advantages to prepare substrate supported NPs, as the ability to finely tune the surface density and the NP size.7-10 Nanostructured electrodes have found applications in fuel cells,11 electrocatalysis12 and electroanalysis,13 to name but a few.
In most cases, the nucleation and the growth steps of the NPs onto the electrode are studied by recording the electrochemical (EC) current during the electrodeposition procedure. Since the early works of the 1960s,14-16 many works have elaborated upon models to apprehend the EC current response during NP electrodeposition or have confronted those models to experiments. Still under active discussions,17,18 these modeling aspects have been reviewed by Hyde and Compton.19 Unfortunately, the current is an average measurement corresponding to a distribution of many individual NP behaviors. Trying to get access to the distribution, which
monitor at the single NP level the electrodeposition of ensemble of them. This ultimate attainable limit of detection has been recently reached by several techniques based on two different strategies. The first approach extends to the nanoscale the early works of Sharifker group.20 It consists in monitoring the electrochemical formation of one single NP and in the capture of its growth dynamics through EC21-23 transients. Owing to low sub-nA current range associated to single NP growth, a complementary imaging of the grown NP, ideally in real time, is often required for assessing its growth or to confirm the charge to mass balance. For example, Mirkin’s group used in situ AFM imaging to study the electrochemical growth of single silver NPs at the surface of a nanometer-sized electrode.23 In a second approach, Schuhmann and Kanoufi have put nano-electrodes under optical (OPT) dark-field microscope observation in order to use OPT transients to assess the growth of individual NP.24-26 Indeed in such configuration, the variations of the size of the NP growing at the electrode apex is associated, in real time with <0.1 s time resolution, to variations of the scattering light intensity of a single NP or of the FWHM of its associated diffraction spot recorded in optical images.
Another pathway is to separate NPs in space by combining electrochemistry to high resolution visualization techniques, ideally operando,27-40 or ex situ for the ultimate tracking at the atomic scale.41 The local images of the resolved NPs can be further analyzed and provide insights into nanoscale electrochemistry. Complementary in situ visualization also offers the advantage of pointing neighboring effect or crosstalk among populations of NPs, important in electrodeposition or related phenomena. In this perspective, in situ scanning TEM27,28,31 and scanning probes microscopies (STM/AFM)29-34 were firstly proposed. The latter allow detecting ultra-small NPs with atomic resolution, ex situ,41 but are often limited to 100 nm NP size while imaged in solution and by their low temporal resolution. In addition, those techniques are also complicated to use on a regular basis.
As an alternative, OPT dark-field microscopy has been suggested to collect the electrochemical behaviors during the electrodeposition of NPs on transparent electrode surfaces.31,35-37,42 It possesses a high throughput and a wide-field assorted with sub-µm resolution imaging, but is often limited to >30nm plasmonic nano-objects. Dark-field microscopy is also frequently coupled to spectroscopy to obtain chemical information through changes in the localized surface plasmon resonance.43-45 Interferometric configuration allows increasing the OPT signal to background ratio, as in the interferometric scattering microscope (iSCAT), but it cannot apply to electrochemistry since it relies on reflections at an insulating interface.46,47 However, recent works have shown that ultrathin layer of absorbing and conducting materials deposited onto a glass substrate could be used in an interferometric observation mode named BALM for backside absorbing layer microscopy.48
Herein, an analytical methodology is depicted showing how to extract quantitative valuable mechanistic information regarding the nucleation and growth of single to large ensemble of NP during electrodeposition processes by using operando high resolution optical imaging strategies. The methodology is illustrated with the BALM technique through the real time OPT monitoring of silver NP electrodeposition under constant potential. The spatial resolution and the sensitivity of the microscope coupled to single OPT NP transients are then
exploited and compared to the nucleation growth theories14,49-51 developed to analyze the electrochemical response obtained for electrodeposition processes.
Going from single NP to an ensemble of them requires knowledge of their nucleation rate (A) and the density of nucleation sites (N0), which are readily obtained from the recorded image
sequences, both linked to the time dependent current. During the growth of multiple NPs the influence of other NPs in their neighboring environment allowing for diffusional cross-talk is a central question in electrochemical processes. This is monitored in real time since such OPT monitoring allows drawing Voronoi diagrams giving access to the spatial distribution of the NPs on the electrode surface. The spatial information associated with the OPT growth curves has revealed to be particularly useful to study and describe the formation of NP arrays. Finally, optically collected data are verified by introducing them in an analytical model capable of quantifying the nucleation and growth of a large ensemble of NPs, even under the overlap of NP diffusion layers.
Experimental section
Chemicals
All chemicals were purchased from Merck and used as received, without any further purification. Silver NPs employed as nano-gauges, purchased from Sigma-Aldrich, were spherical NPs, functionalized by sodium citrate and had an average size of 60 ± 8nm in diameter.
Opto-electrochemical set-up
The BALM technique is based on an ultrathin and highly absorbing layer (antireflective, AR) deposited on a glass slide. The resulting substrate is thus composed of two different interfaces, which are formed by the AR layer sandwiched between the glass and the medium of interest, here an electrolytic solution.
The background extinction condition of the AR layer is derived from the Fresnel equations and can be calculated along equations (1) and (2):
(1)
(2) where n1, k1 and e1 are respectively the real part of the refractive index, the extinction
coefficient and the thickness of the AR layer, n0 and n2 are the refractive indices of the
incident and emergent media, respectively. λ stands for the light wavelength. A complete mathematical description of this phenomenon has been already published elsewhere.48
In the present case, the AR conditions are approached by using gold as the material for the glass coating and a thickness layer of roughly 5 nm, which is adapted for visualization in water. Figure 1 schematizes the experimental set-up and the principle of the BALM technique
Figure 1. Experimental setup used for monitoring the NP electrodeposition. The right image schematizes the phenomenon whereby the OPT contrast is obtained.
For imaging nanostructures, the layer is illuminated from the glass thanks to an inverted OPT microscope (Zeiss axiovert). In this particular configuration, the substrate possesses a pseudo-AR property due to destructive interferences between beams partially reflected at the interfaces. If a NP lies at the contrast layer surface, it locally disturbs the interferences. The amount of reflected light is then locally modified, and can be collected by a camera for obtaining an image. Elsewhere on the substrate, the constant and low amount of reflected light (estimated to roughly 1% of the incident light) contributes to the background intensity.
This OPT microscopy technique is thus sensitive to local refractive index variations and is able to image a broad range of nanomaterials, from dielectric to noble metal NPs.48,52,53 Opto-electrochemical analyses are performed using the gold AR layer as a working electrode. Briefly, the homemade 3-electrode electrochemical cell, with a diameter of 300 µm, was machined in house from plastic and stuck onto the gold AR surface in order to host a drop of electrolytic solution. Gold and silver (0.5 and 1 mm, respectively) wires served as counter and quasi-reference electrode, respectively and were placed above the microscope as presented in Figure 1.
Electrodeposition conditions
Electrodepositions were performed either by chronoamperometry or by cyclic voltammetry at 100 mV.s-1 in a solution containing 0.1M NaNO3 and 100 µM or 500 µM of AgNO3
respectively. Sizing procedure
Recently,52,53 a systematic correlation between BALM and scanning electron microscope images showed that the BALM intensity (IBALM) in a NP region scales linearly with the NP
volume (VNP) though equation (3):
IBALM = αVNP (3)
The correlation factor, α, essential for absolute NP volume quantification, is estimated by ex
situ SEM analysis or in an equivalent way, by employing calibrated NPs as internal
AR surface from a diluted colloidal solution. Then, one can measure their corresponding average BALM intensity under precise illumination conditions. Following equation (1), the size of the other NPs generated at the electrode surface is calculated based on the mean intensity of the nano-gauges. This approach has been used herein.
Extraction of single NP transients
The amount of reflected light in a single NP region increases with the NP growth. The local variation of light intensity thus contains information about NP growth kinetics. From a BALM image sequence recorded at a selected frequency, the light fluctuation was extracted by data treatment using the ImageJ software. First, OPT spots of interest, corresponding to the presence of NPs at the electrode surface, were detected by comparing the first and the last images in the sequence. Once localized, the spots were defined by squares of 4x4 pixels. The BALM intensity in a NP region was then extracted by taking the average intensity of the 16 pixels as a function of time. The curves of the BALM intensity as a function of time or potential are named respectively OPT transients or OPT voltammograms.
Transforming OPT signal into OPT related current
As the OPT signal of a NP scales with the NP volume, it is also proportional to the charge (Qopt) passing through the electrode during the electrochemical experiment. From the size
correlation factor, , and the Faraday law, the charge (Q) can be directly inferred from the OPT signal though equation (4).
(4)
where F and Vm are the Faraday constant and the atomic volume, respectively.
Therefore, differentiating the optically deduced charge as a function of time results in a quantitative OPT current related to one single NP.
Neighboring NPs
The neighboring nuclei for a given NP can be taken into account by using the Voronoi diagrams, which are basically maps of the nearest neighbors for a given set of points. The presence of near neighbors is of high importance in the understanding of the electrochemical response of various situations: going from electrodeposition to nano-structured electrodes.54-56 The maps are obtained herein from the Delaunay triangulation which consists in a series of edges drawn from circles. Here, the set of points corresponds to the NPs present in an OPT image.
The X and Y coordinates of all the NPs in an image of a finite size are collected by finding the intensity maxima with the adequate noise tolerance, using the ImageJ software. The area of individual Voronoi cells surrounding each growing NP can then be estimated over time if the spatial coordinates are extracted for each image in a BALM image sequence. The Delaunay triangulation and the Voronoi diagrams are computed using a homemade Python
routine, which also estimates the size distribution of the Voronoi cells and fits the distribution with a generalized Gamma distribution function.
Results and discussion
Monitoring the NP electrodeposition
As explained in the experimental section, local intensity changes, IBALM, in OPT images are
attributed to the presence of NPs on the electrode surface. Bright spots can be observed in Figure 2a for calibrated silver NPs (60 nm in diameter), which were adsorbed at the pseudo-AR electrode substrate. They show a measured mean OPT intensity of IBALM = 75 ± 10. Small
deviations in the gauge intensity have been attributed to the size polydispersity of the colloidal solution and to different NP attachments to the electrode surface. Figure 2 also shows two BALM images taken before and after an electrodeposition of silver NPs. In that case, the newly formed spots do not always have the same OPT intensity, as the sizes of the NPs are more poly-disperse.
As BALM can image metallic NPs at the single NP level on a metallic substrate, this OPT technique is perfectly adapted to the dynamical study of the nucleation, growth and dissolution of NPs during EC experiments. As an example, Figure 2b shows the results of a cyclic voltammetry experiment conducted in a solution of Ag+ by using the contrast layer as the working electrode. The EC voltammogram (black curve) presents an increasing current when the potential reaches a sufficiently negative value and a sharp anodic peak during the reverse scan. These two features are characteristics of the deposition and successive stripping of silver NPs, respectively. The voltammogram also exhibits the usual hysteresis loop after the potential sweep reversal due to the continued growth of NPs until they can be oxidized. The cyclic voltammetry was monitored optically by BALM. As stated in the experimental section, from the movie recorded by the camera during the EC experiment, one can extract the variation of the OPT intensity, IBALM, as a function of time (or potential) for individual NPs.
The OPT signal related to NPs appears and increases during the cathodic potential sweep and finally decreases during the reverse potential scan, corroborating the EC results (not shown). Blank experiments have shown that the local OPT spots related to NPs cannot be observed when the electrode is biased in the absence of silver ions. The BALM intensity transients of NPs can then be transformed into OPT voltammograms by differentiating the OPT signal, related to the EC charge (see the experimental section). The red curve in Figure 2b is an OPT voltammogram constructed with the cumulated intensity of N=100 Ag NPs appearing at the electrode surface during the cyclic voltammetry. Note that the OPT curve can be perfectly superimposed to the classical EC one and can be interpreted in the exact same way.
Figure 2. (a) BALM images of silver NPs deposited on an AR electrode substrate. The top image corresponds to 60 nm silver NPs used as nano-gauges. The two bottom images were extracted before and after an electrodeposition of silver NPs conducted at constant potential. EC (black) voltammogram (b), EC chronoamperogram (c). OPT (red) voltammogram (b) and chronoamperogram (c) obtained during the deposition of silver NPs from aqueous solutions of AgNO3 and NaNO3 by using the AR substrate as a
working electrode as described in the experimental section. Chronoamperometry was conducted at -100 mV.
This general procedure also works very well with EC experiments conducted at constant potential, as shown in Figure 2C for a chronoamperogram (CA) at -100 mV in presence of Ag+. Therefore, we have taken advantage of the OPT transients of individual NPs to study the electrochemical nucleation and growth of single NPs at constant potential at the AR gold electrode surface.
Retardation time
Two opto-electrochemical experiments were conducted at constant potential, with two different overpotentials (-100 and -200 mV), which produce two arrays of well dispersed NPs. OPT transients related to the nucleation and growth of individual NPs were collected by the procedure described in the experimental section at the two overpotential values. Some of them are represented in Figure 3a and b for a potential value of -100 and -200 mV, respectively. During electrodeposition, different NP growth dynamics were observed. The NP transients (equivalent to the variation of VNP as a function of time) collected at -100 mV (Figure 3a)
show an inhibition behavior when the NPs are larger and thus exhibit a sigmoidal shape. The transients collected at -200 mV (Figure 3b) present a diffusion-controlled behavior and follow, as will be discussed later, an IBALM-t3/2 growth law.
Figure 3. Individual NPs OPT transients extracted from a BALM image sequence recorded during constant potential electrodeposition at (a and c) 100 mV, (b and d) -200 mV. (a and b) IBALM-t profiles (equivalent to VNP-t profiles) transformed (c and d) by
normalizing INP by its maximal value INP,Max and by a retardation time u’ (related to the
NP time of birth) taken at the half-maximum INP,M/2, as indicated in (a). NB=50 OPT
transients for (c) and (d).
In both experiments, the smallest NPs have the slowest growth rate and appear at longest times. This observation can be quantified through a retardation time, u’, related to the NP birth time, and through the NP final size. The procedure to define those parameters, namely u’ and IMax is given in Figure 3a. Interestingly, for both CA experiments, all individual OPT
transient curves can be recast into a single trace, by translating them along the time axis by the retardation time, u’, and by normalizing IBALM by IMax, the final NP intensity (related to
the final NP volume). The normalization procedure is illustrated in Figures 3c and d, where NB=50 OPT transients have been recast for CA at -100 and -200 mV, respectively. It suggests that over the whole CA experiment, all NPs show the same behaviors, but with a birth delayed by an arbitrary time, u’.
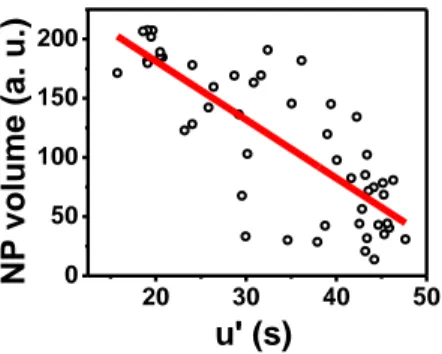
Figure 4 presents, for the CA at -100 mV, the evolution of the final NP size with the retardation time, showing that both quantities are correlated. It is consistent with models proposed for a progressive nucleation of NPs, largely proven from ensemble.14,49-51 It also consolidates our previous report suggesting that the potential shift detected during a CV experiment cannot be accounted for size-dependent thermodynamics, in opposition to the NP stripping.53
This suggests that the NP growth depicted herein is dictated by a same intrinsic growth mode, likely limited by Ag+ ion diffusion, while the NP birth is controlled by the NP nucleation dynamics. The independence of NP growth kinetics from the nucleation is indeed possible if the nucleation is progressive rather than instantaneous and with a characteristic time scale
slow enough compared to that for the buildup of the Ag+ ion diffusion regime. Indeed, as devised by Compton group,57,58 the diffusional mass transport towards an array of NPs working as nano-electrodes, can be characterized by 4 different transport regimes successively encountered as times goes on.
Case 1 corresponds to the linear diffusion towards individual isolated NPs. It is typically visited for times shorter than 1 = rNP2/D, which is for a diffusion coefficient (D) of 10-5cm2/s
and an upper limit of the NP radius (rNP) of 100 nm, 1-2 = 10 µs that is out of reach of our
present OPT time resolution (10 ms). Case 2 corresponds to the radial diffusion around each NP, which then behaves as an individual NP not interacting with its neighbors. This situation is observed for times comparable to 1-2 to times shorter than 2-3, the time needed for the
diffusion layer to reach the next neighboring NPs. If RNN is the inter-particle distance, 2-3 =
RNN2/D. For times of the same order of magnitude as 2-3, the NPs develop overlapped
diffusion layers propagating over the whole electrode (Case 3). The RNN evolves during the
electrodeposition (decreases with time until the surface is saturated). However, it can be estimated in real time through the OPT visualization. As it will be discussed later, the Voronoi cell decomposition of the OPT images allows estimating RNN<2-3µm. It then suggests that the
transition from Case 2 to Case 3 is detected for times of the order of 4-10ms, again which is not explored during the OPT monitoring. For the time scale of OPT monitoring, the diffusion regime corresponds to Case 4, which is a linear diffusion towards the entire electrode as a consequence of fully overlapped diffusion layers at neighboring NPs.
For the progressive nucleation observed herein, apart likely for the first few NPs, all further NPs grow progressively along the same linear macroscale diffusion regime, explaining that most NPs have a common intrinsic transient growth function (decoupled from the diffusional regime expansion). The overall NPs growth will then reflect the dynamics of the NP nucleation law rather than the exploration of the different diffusion regimes.
Figure 4. Correlation of the NP retardation time of each NP (u’) estimated as illustrated in Figure 3a, with the NP final intensity for CA at -100 mV.
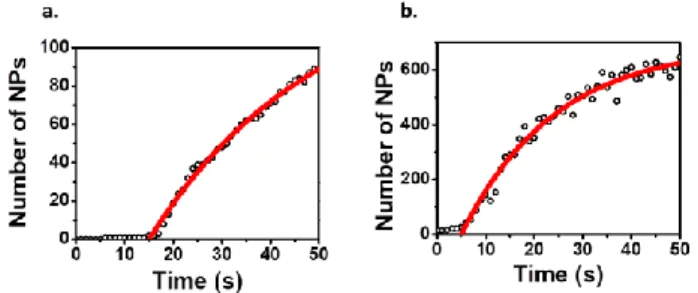
Nucleation rate and density of nucleation sites
The dynamics of the nucleation process is afforded by the OPT monitoring. Movies provide a
20 30 40 50 0 50 100 150 200 NP volu me (a. u.) u' (s)
evolution of the NP density (at -100 and -200 mV, respectively) during the time of the CAs, extracted from the OPT monitoring.
Figure 5. Time evolution of the number of NPs (symbols) electrodeposited on a region of a BALM substrate (13.2x13.2 µm2) during CA at -100 mV (a) and – 200 mV (b). The corresponding experimental NP densities are fitted (red lines) with the predicted evolution (starting at an arbitrary onset time) for a stationary nucleation process.
For an electrodeposition, the nucleation rate (A) is given by equation (5):
dN/dt=(N0-N)A (5)
which gives after integration, an expression for the density of nucleation sites (N) as a function of time:
N=N0(1-exp(-At)) (6)
N0, which stands for the saturation density of the surface by the nuclei (in NP.cm-2) is
supposed to be smaller than the atomic density and in the range of 104 to 1010 NP.cm-2.51 The fits of the experimental data give N0 values of 7.9x10⁷ and 3.9x10⁸ NP.cm-2 for CA at
-100 and -200 mV, respectively. N0 is found to be potential dependent and increases with the
overpotential, in agreement with the literature.51,59
From the fitting curves in Figure 5, one can also evaluate the nucleation rate constant (A). It reaches values of 0.03 and 0.05 s-1 for CA at -100 and -200 mV, respectively. As A is much smaller than 1, the nucleation process can be considered as progressive in both cases.
Spatial distribution of the NPs
Unlike in surface plasmon resonance microscopy,60,61 a similar technique (based on a contrast layer) in which the presence of NPs results in a >4µm2 diffraction pattern, the BALM technique possesses a high spatial resolution (sub-micron) in the x and y directions that allows studying the spatial distribution of each NP lying on the AR gold substrate surface. This was achieved though the Voronoi tessellation of each image stacked in a movie. The principle of this analysis is illustrated in Figures 6a and b for two images taken at two different times (20 and 50 s) during the CA conducted at -100 mV. The blue points are the original positions of the NPs in the image, while the orange points and black lines are the vertices and the ridges of the Voronoi cells, respectively.
Figure 6. Voronoi diagrams constructed around the xy positions of NPs (blue points in (a,b)) extracted from two images at different times (a and b at t= 20 and 50 s respectively) taken during the CA at -100 mV. Corresponding histograms of the Voronoi cell areas at (c) t = 20 seconds and (d) at t=50. The red curves are the normalized gamma function fits of the two distributions.
The evolutions of the Voronoi diagrams and of the Voronoi cell area were studied as a function of time during CAs. Figures 6c and d present the variation of the size distribution of the Voronoi cells at two selected times (t=20 and 50 s for Figures 6c and 6d respectively) for the CA at -100 mV. For a set of nuclei randomly distributed on a surface, the distribution of the Voronoi cell area follows a Gamma-distribution given by equation (7):62,63
(7)
where n is the parameter of the gamma function fit. , <> and stand for the bins and the mean value of the distribution and the Gamma function, respectively.
The red curves superimposed in Figures 6c and d correspond to the fits of the experimental distribution of the Voronoi cell area. At the early stages of the electrodeposition (Figure 6a and c for t=20 s), and thus at a low surface coverage by the NPs, the distributions are satisfactorily fitted by the probability density function of a random distribution (f(y, ~3.5)), which suggests that the NPs are randomly deposited at the beginning of the nucleation process. At higher surface coverage and longer deposition times (50 s), the probability density functions are narrower, as observed in Figure 6d. The distributions can also be fitted by a Gamma distribution, but with higher n values, suggesting a correlated growth of NPs. Such changes in the probability density function could be related to the overlap of the diffusion layers of consumption of the silver ions around each NP. It confirms that for these longer times each NP grows within the Case 4 diffusion regime owing to the overlapping NPs. Two types of Voronoi cells can be defined during the CAs. Those at the time of the NP birth
second one. The retardation time (u’), previously defined, correlates with the NP Voronoi cell area estimated at the NP time of birth. The correlation is plotted in Figure 7 for the CA at -100 mV. It is expected that both quantities correlate with such trend (the smaller the available area on the electrode and the longer the time need for the formation of a new nuclei) if the nucleation process is stochastic or not regioselective. Indeed the birth or retardation time reflects the probability of a new nucleus to form on the surface which should be proportional to the number of nucleation sites on the surface. If these nucleation sites are randomly distributed over the electrode surface, the smaller the available surface area and the lower the number of sites and therefore the lower the probability (the longer it takes) for a new nucleus to appear in that region. Figure 7 then suggests that over the optically monitored region the electrodeposition process is ruled by a stochastic process.
Figure 7. Correlation of the NP retardation time of each NP (u’) with the Vornoï cell area of the NPs at the time of birth. Data are extracted from the CA at – 100 mV.
Transient of isolated NPs
From the variations of IBALM as a function of time and the calibration procedure detailed in the
experimental section, single NP dynamic volume variations can be inferred. Figure 8a corresponds to the OPT transient of one of the first NPs grown from the surface. It thus possesses a large Voronoi cell area (>10 µm2) at its time of birth. The NP can thus be considered as isolated from the other growing nuclei at its time of birth. At the end of the CA (at 50 s and a potential of -100 mV), the NP reaches a final diameter of ~85 nm.
Figure 8. (a) Variation of the NP volume as a function of time during a CA at -100 mV for a single silver NP with a large Voronoi cell area (>10 µm²). The black and red curves are respectively the experimental BALM (optically inferred) volume transient and the theoretical volume variation calculated for an isolated growing nucleus. (b) BALM
images taken before (up, t=15s) and after (down, t=18s) the deviation observed in (a). Gray arrows highlight the presence of newly formed nuclei.
Such isolated nucleus can be considered as an individual nano-electrode and, in the absence of other NPs, its growing dynamics can be approached mathematically by combining the Faraday’s law with the time-independent part of the diffusion equation.51
It leads to expression (8) of the NP radius (r) as a function of time (t):
r = (2VmDc/ρ)1/2(t-u)1/2 (8)
where Vm, D and c stand for the atomic volume, the diffusion coefficient and the bulk
concentration of Ag+, respectively, and u, the NP time of birth.
If the experimental volume transient is fitted by this expression, a deviation is noted after few seconds of growth (~17 s for the transient in Figure 8, t-u ~ 5 s), which is concomitant with the apparition of other NPs at the electrode surface. The image of the newly formed NPs is presented in Figure 8b. The observed deviation could be explained by the overlap of the diffusion layers of silver ions that form around the newly grown nucleus.
Note that the fit of the experimental volume transients is done with an apparent concentration, which is smaller than the bulk concentration (ranging from 100 to 10 µM depending on the considered transient). Several arguments can be advanced to explain the need of considering a smaller apparent Ag+ concentration and are detailed in the next section.
Towards an ensemble response
By using many OPT transients together with the NP density extracted from a recorded BALM image sequence during a CA, it is then possible to compute the OPT CA of an electrode region under OPT monitoring. The idea here is to combine individual NP transients to reconstruct the ensemble OPT transient response and to analyze with the theories developed for the macroscopic electrochemical response recorded usually in electrodeposition studies. The OPT CA is trusted to be quantitative (thanks to the presence of the nano-gauges) and can be interpreted as a classical EC-CA curve. The interest of the approach is also that, as seen in Figure 2c, an EC CA contains background currents that may be difficult to subtract (because of double layer charging for example), particularly when electrodepostion from low concentrations is required. An example of OPT CA is presented in Figure 9 (black curve) for the CA conducted at -100 mV. It has been generated with the help of NB=50 single NP OPT transients from Figure 3a and c. As expected, the OPT CA presents the characteristics of a progressive nucleation process.
0 10 20 2 4 6 j (µA/cm²) Time (s)
Figure 9. OPT CA (black curve) constructed with NB=50 intensity transients during an EC experiment at an overpotential of -100 mV and calculated CA (red curve) obtained by integrating N0 and A in the analytical model of Scharifker and Mostany.
At the beginning, the current is increasing because of the nucleation and the increased number of nuclei that are growing, up to a maximum (at an arbitrary time of roughly 5 s in Figure 9), which is higher than the Cottrell current. After this maximum, the linear diffusion regime (case 4) dominates and the current drops, approaching the Cottrell stationary current.
Several analytical models describe the EC CA curves when the diffusion layers overlap. Among them, the model developed by Mostani and Scharifker integrates A and N0 to
calculate the current density through the Cottrell equation for a planar diffusion and the Avrami theorem.14,49,50
The analytical equation proposed by Heerman and Tarallo (equation 25 in reference 51) is used to model the ensemble OPT CA transient.51 As observed in Figure 9, the analytical model (red curve) correlates nicely with the experimental current density calculated from the OPT data with an apparent bulk concentration of ~60 µM. This value is in fairly good agreement with the real bulk concentration of silver ions (100 µM). This mismatch is however consistent with the observation made with the individual NP growth. The difference between the real and the apparent concentration can be explained by a combination of factors. Firstly, the shape of the electrodeposited NPs is probably not exactly hemispheric. Indeed, NPs of different shapes will appear as undifferentiated OPT spots, if the sizes of the NPs are below the diffraction limit. Small errors can also come from the size correlation factor extrapolated from the theoretical volume of the adsorbed nano-gauges and the intensity of the OPT spots. Secondly, in the current experimental conditions, the microscope cannot detect the presence of NPs with sizes below an estimated diameter of roughly 10 nm.53 Therefore, small NPs and clusters formed at the electrode surface during the CA reduce the Ag+ concentration but are not detected optically, leading to a lower apparent concentration. The undetectable growth of such cluster may explain both the single NP and ensemble NP behavior. Its contribution is further suggested through the comparison of the EC current density measured during CV and compared to an ensemble OPT CV (Figure 2b). If the overall CVs are very similar for the NP stripping, there is a clear mismatch in the cathodic peak associated to the NP growth. The larger onset of the OPT current and higher OPT peak current compared to the EC ones suggest also the prior formation of nanocluster invisible to the OPT monitoring.
Finally, it is likely that the electrolyte presents some traces of chloride ions, which may yield to the precipitation of a portion of the Ag+ ions. Owing to NaNO3 purity, a maximum of 20
µM of Cl- may be present in the 0.1 M NaNO3 solution, which, owing to the AgCl solubility
product (10-9.75) indeed suggests some precipitation of AgCl with a lower concentration of free Ag+ (and Cl-) in the solution. It would be about 80 µM for Ag+ (and 2 µM for Cl-), more consistent with the value obtained from the fits.
Conclusions
The OPT monitoring of an electrodeposition (herein using the BALM technique) represents a simple and unique toolbox to study nucleation and growth phenomena of individual NPs among a large set. Particularly, it has been employed to follow the formation of arrays of silver NPs, up to the point that we no longer need of recording the EC current density.
Image sequences give access to much information as the nucleation rate, the nucleation density and the spatial distribution of NPs at any time of the EC experiment. OPT images allow drawing Voronoi diagrams and estimating the Voronoi cell area of a NP, with particular interest in estimating the Voronoi cell area of a NP at its time of birth . Growth dynamics are obtained by extracting the variation of the NP spot intensity as a function of time and OPT CA can be constructed in specific electrode regions, which is extremely useful as the electrode behavior is frequently inhomogeneous.
Finally, data originating from the movies and showing collective behaviors of NPs were confirmed by comparing them to the analytical model that takes into account for the crosstalk between NPs.
Since BALM does not rely entirely on the ability of a NP to scatter light, we believe that the same strategy could be extended to the analysis of the nucleation and growth of a wide range of other nanomaterials.
Funding Sources
This work was financially supported by ANR NEOCASTIP ANR-15-CE09-0015-02 project, and through the CNRS and Paris Diderot University.
References
1
P. K. Jain, X. Huang, I. H. El-Sayed, M. A. El-Sayed, Noble metals on the nanoscale: optical and photothermal properties and some applications in imaging, sensing, biology, and medicine, Acc. Chem. Res. 41 (2008) 1578-1586. https://doi.org/10.1021/ar7002804.
2
S. Eustis, M. A. El-Sayed, Why gold nanoparticles are more precious than pretty gold: noble metal surface plasmon resonance and tis enhancement of the radiative and nonradiative properties of nanocrystals of different shapes, Chem. Soc. Rev. 35 (2006) 209-217. https://doi.org/10.1039/B514191E.
3K.-S. Lee, M. A. El-Sayed, Gold and silver nanoparticles in sensing and imaging: sensitivity
of plasmon response to size, shape, and metal composition, J. Phys. Chem. B 110 (2006) 19220-19225. https://doi.org/10.1021/jp062536y.
4
L. M. Rossi, J. L. Fiorio, M. A. S. Garcia, C. P. Ferraz, The role and fate of capping ligands in colloidally prepared metal nanoparticle catalysts, Dalton Trans. 47 (2018) 5889-5915. https://doi.org/10.1039/C7DT04728B.
5
K. L. Kelly, E. Coronado, L. L. Zhao, G. C. Schatz, The optical properties of metal nanoparticles: the influence of size, shape, and dielectric environment, J. Phys. Chem. B 107 (2003) 668-677. https://doi.org/10.1021/jp026731y.
6
S. Link, M. A. El-Sayed, Shape and size dependence of radiative, non-radiative and photothermal properties of gold nanocrystals, Int. Rev. Phys. Chem. 19 (2000) 409-453. https://doi.org/10.1080/01442350050034180.
7
Y. Takasu, N. Ohashi, X.-G. Zhang, Y. Murakami, H. Minagawa, S. Sato, K. Yahikozawa, Size effects of platinum particles on the electroreduction of oxygen, Electrochim. Acta 41 (1996) 2595-2600. https://doi.org/10.1016/0013-4686(96)00081-3.
8
T. R. Soreta, J. Strutwolf, O. Henry, C. K. O’Sullivan, Electrochemical surface structuring with palladium nanoparticles for signal enhancement, Langmuir 26 (2010) 12293-12299. https://doi.org/10.1021/la101398g.
9
R. M. Penner, Mesoscopic metal particles and wires by electrodeposition, J. Phys. Chem. B 106 (2002) 3339-3353. https://doi.org/10.1021/jp013219o.
10
S. Li, H. Chen, J. Liu, Y. Deng, X. Han, W. Hu, C. Zhong, Size- and density-controllable fabrication of the platinum nanoparticle/ITO electrode by pulse potential electrodeposition for ammonia oxidation, ACS Appl. Mater. Interfaces 9 (2017) 27765-27772.
https://doi.org/10.1021/acsami.7b08604.
11
M. K. Debe, Electrocatalyst approaches and challenges for automotive fuel cells, Nature 486 (2012) 43-51. https://doi.org/10.1038/nature11115.
12
M. T. M. Koper, Structure sensitivity and nanoscale effects in electrocatalysis, Nanoscale 3 (2011) 2054-2073. https://doi.org/10.1039/C0NR00857E.
13
F. W. Campbell, R. G. Compton, The use of nanoparticles in electroanalysis: an updated review, Anal. Bioanal. Chem. 396 (2010) 241-259. https://doi.org/10.1007/s00216-009-3063-7.
14
M. Fleischmann, H.R. Thirsk, An investigation of electrochemical kinetics at constant overvoltage. The behaviour of the lead dioxide electrode. Trans. Faraday Soc. 51 (1955) 71-95. https://doi.org/10.1039/TF9555100071.
15
D.J. Astley, J.A. Harrison, H.R. Thirsk, Electrocrystallization of mercrury, silver and palladium. Trans. Faraday Soc. 64 (1968) 192-201. https://doi.org/10.1039/TF9686400192
16
G.J. Hills, D.J. Schiffrin, J. Thompson, Electrochemical nucleation from molten salts – I. Diffusion controlled electrodepositionof silver from alkali molten nitrates. Electrochim. Acta 19 (1974) 657-670. https://doi.org/10.1016/0013-4686(74)80008-3.
17
M.Y. Abyaneh, M. Fleischmann, H.H. Mehrabi, Modelling the growth of a single centre. J. Electroanal. Chem. 834 (2019) 114-123. https://doi.org/10.1016/j.jelechem.2018.11.030.
18
S. Fletcher, Comments on the paper "Modelling the growth of a single centre",by M.Y. Abyanhe, M. Fleischmann, H.H. Mehrabi, published in the Journal of Electroanalytical
Chemistry, 834, 114-123 (2019). J. Electroanal. Chem. (2020) https://doi.org/10.1016/j.jelechem.2020.113858.
19
M. E. Hyde, R. G. Compton, A review of the analysis of multiple nucleation with diffusion controlled growth, J. Electroanal. Chem. 549 (2003) 1-12. https://doi.org/10.1016/S0022-0728(03)00250-X.
20
B. Scharifker, G. Hills, Electrochemical kinetics at microscopically small electrodes. J. Electroanal. Chem. 130 (1981) 81-97. https://doi.org/10.1016/S0022-0728(81)80378-6.
21
J. Kim, A. J. Bard, Electrodeposition of single nanometer-size Pt nanoparticles at tunneling ultramicroelectrode and determination of fast heterogeneous kinetics for Ru(NH3)63+
reduction, J. Am. Chem. Soc. 138 (2016) 975-979. https://doi.org/10.1021/jacs.5b11655.
22
J. Velmurugan, J.-M. Noël, M. V. Mirkin, Nucelation and growth of mercury on Pt nanoelectrodes at different overpotentials, Chem. Sci. 5 (2014) 189-194. https://doi.org/10.1039/C3SC52488D.
23
J. Velmurugan, J.-M. Noël, W. Nogala, M. V. Mirkin, Nucleation and growth of metal on nanoelectrodes. Chem. Sci. 3 (2012) 3307-3314. https://doi.org/10.1039/C2SC21005C.
24
Y. Wusimanjiang, Y. Ma, M. Lee, S. Pan, Single gold nanoparticle electrode for electrogenerated chemiluminescence and dark field scattering spectroelectrochemistry, Electrochim. Acta 269 (2018) 291-298. https://doi.org/10.1016/j.electacta.2018.02.154.
25
V. Brasiliense, J. Clausmeyer, A. L. Dauphin, J.-M. Noël, P. Berto, G. Tessier, W. Schuhmann, F. Kanoufi, Opto-electrochemical in situ monitoring of the cathodic formation of single cobalt nanoparticles. Angew. Chem. Int. Ed. 56 (2017) 10598-10601. https://doi.org/10.1002/anie.201704394.
26
V. Brasiliense, J. Clausmeyer, P. Berto, G. Tessier, C. Combellas, W. Schuhmann, F. Kanoufi, Monitoring cobalt-oxide single particle electrochemistry with subdiffraction accuracy, Anal. Chem. 90 (2018) 7341-7348. https://doi.org/10.1021/acs.analchem.8b00649.
27 A. Radisic, P. M. Vereecken, J. B. Hannon, P. C. Searson, F. M. Ross, Quantifying
electrochemical nucleation and growth of nanoscale clusters using real-time kinetic data. Nano Lett. 6 (2006) 238-242. https://doi.org/10.1021/nl052175i.
28
A. Radisic, P. M. Vereecken, P. C. Searson, F. M. Ross, The morphology and nucleation kinetics of copper islands during electrodeposition, Surf. Sci. 600 (2006) 1817-1826. http://dx.doi.org/10.1016/j.susc.2006.02.025.
29
R. L. Harniman, D. Plana, G. H. Carter, K. A. Bradley, M. J. Miles, D. J. Fermin, Real-time tracking of metal nucleation via local perturbation of hydration layers, Nat. Commun. 8 (2017) 1-8. https://doi.org/10.1021/acsnano.8b04089.
30
M. E. Hyde, R. Jacobs, R. G. Compton, In situ AFM studies of metal deposition, J. Phys. Chem. B 106 (2002) 11075-11080. https://doi.org/10.1021/jp0213607.
31
Y. Wang, X. Shan, N. Tao, Emerging tools for studying single entity electrochemistry, Faraday Discuss. 193 (2016) 9-39. https://doi.org/10.1039/C6FD00180G.
32
M. Dietterle, T. Will, D. M. Kolb, The initial stages of Cu electrodeposition on Ag(100): an in situ STM study, Surf. Sci. 396 (1998) 189-197. https://doi.org/10.1016/S0039-6028(97)00668-7.
33
S. Manne, P. K. Hansma, J. Massie, V. B. Elings, A. A. Gewirth, Atomic-resolution electrochemistry with the atomic force microscope: copper deposition on gold, Science 251
34T. T. Pötzschke, C. A. Gervasi, S. Vinzelberg, G. Staikov, W. J. Lorenz, Nanoscale studies
of Ag electrodeposition on HOPG (0001), Electrochim. Acta. 40 (1995) 1469-1474. https://doi.org/10.1016/0013-4686(95)00049-K.
35
C. M. Hill, S. Pan, A dark-field scattering spectroelectrochemical technique for tracking the electrodeposition of single silver nanoparticles, J. Am. Chem. Soc. 135 (2013) 17250-17253. https://doi.org/10.1021/ja4075387.
36
C. M. Hill, R. Bennett, C. Zhou, S. Street, J. Zheng, S. Pan, Single Ag nanoparticle spectroelectrochemistry via dark-field scattering and fluorescence microscopies, J. Phys. Chem. C 119 (2015) 6760-6768. https://doi.org/10.1021/jp511637a.
37
C. M. Hill, D. A. Clayton, S. Pan, Combined optical and electrochemical methods for studying electrochemistry at the single molecule and single particle level: recent progress and perspectives, Phys. Chem. Chem. Phys. 15 (2013) 20797-20807.
https://doi.org/10.1039/C3CP52756E.
38
V. Brasiliense, J.-M. Noël, K. Wonner, K. Tschulik, C. Combellas, F. Kanoufi, Single nanoparticle growth from nanoparticle tracking analysis: from Monte Carlo simulations to nanoparticle electrogeneration, ChemElectroChem, 5 (2018) 3036-3043. https://doi.org/10.1002/celc.201800742.
39
J.-F. Lemineur, T.J. Stockmann, J. Médard, C. Smadja, C. Combellas, F. Kanoufi, Optical nanoimpacts of dielectric and metallic nanoparticles on gold surface by reflectance microscopy: adsorption or bouncing?, J. Anal. Test. 3 (2019) 175-188. https://doi.org/10.1007/s41664-019-00099-8.
40
J.-M. Noël, M. Miranda Vieira, V. Brasiliense, J.-F. Lemineur, C. Combellas, F. Kanoufi,
Effect of the driving force on nanoparticles growth and shape: an opto-electrochemical study,
Nanoscale (2020). https://doi.org/10.1039/C9NR09419A.
41
H. E. M. Hussein, R. J. Maurer, H. Amari, J.J.P. Peters, L. Meng, R. Beanland, M. E. Neton, J. V. Macpherson, Tracking Metal Electrodeposition Dynamics from Nucleation and Growth of a Single Atom to a Crystalline Nanoparticle. ACS Nano 12 (2018) 7388-7396. https://doi.org/10.1021/acsnano.8b04089.
42
V. Sundaresan, J. W. Monaghan, K. A. Willets. Monitoring Simultaneous Electrochemical Reactions with Single Particle Imaging. ChemElectroChem. 5 (2018) 3052-3058. https://doi.org/10.1002/celc.201800715.
43
V. Brasiliense, P. Berto, C. Combellas, R. Kuszelewicz, G. Tessier, F. Kanoufi. Electro-chemical transformation of individual nanoparticles revealed by coupling microscopy and spectroscopy. Faraday Discuss. 193 (2016) 339-352. https://doi.org/10.1039/C6FD00098C.
44
K. Wonner, C. Rurainsky, K. Tschulik. Operando Studies of the Electrochemical Dissolution of Silver Nanoparticles in Nitrate Solutions Observed With Hyperspectral Dark-Field Microscopy. Front. Chem. 7 (2020) 1-12. doi: 10.3389/fchem.2019.00912
45
K. Wonner, M. V. Evers, K. Tschulik. Simultaneous Opto- and Spectro-Electrochemistry: Reactions of Individual Nanoparticles Uncovered by Dark-Field Microscopy. J. Am. Chem. Soc. 140 (2018) 12658-12661. https://doi.org/10.1021/jacs.8b02367.
46
J. Ortega-Arroyo, P. Kukura, Interferometric scattering microscopy (iSCAT): new frontiers in ultrafast and ultrasensitive optical microscopy, Phys. Chem. Chem. Phys. 14 (2012) 15625-15636. https://doi.org/10.1039/C2CP41013C.
47 G. G. Daaboul, A. Yurt, X. Zhang, G. M. Hwang, B. B. Goldberg, M. S. Ünlü,
High-throughput detection and sizing of individual low-index nanoparticles and viruses for pathogen identification, Nano Lett. 10 (2010) 4727-4731. https://doi.org/10.1021/nl103210p.
48
S. Campidelli, R. A. Khachfe, K. Jaouen, J. Monteiller, C. Amra, M. Zerrad, R. Cornut, V. Derycke, D. Ausserré, Backside absorbing layer microscopy: watching graphene chemistry, Sci. Adv. 3 (2017) e1601724. https://doi.org/10.1126/sciadv.1601724.
49
B. Scharifker, G. hills, Theoretical and experimental studies of multiple nucleation, Electrochim. Acta 28 (1983) 879-889. https://doi.org/10.1016/0013-4686(83)85163-9.
50
B. R. Scharifker, J. Mostany, Three-dimentional nucleation with diffusion controlled growth: Part I. Number density of active sites and nucleation rates per site, J. Electroanal. Chem. 177 (1984) 13-23. https://doi.org/10.1016/0022-0728(84)80207-7.
51
L. Heerman, A. Tarallo, Theory of the chronoamperometric transient for electrochemical nucleation with diffusion-controlled growth, J. Electroanal. Chem. 470 (1999) 70-76. https://doi.org/10.1016/S0022-0728(99)00221-1.
52
J.-F. Lemineur, J.-M. Noël, C. Combellas, D. Ausserré, F. Kanoufi, The promise of antireflective gold electrodes for optically monitoring the electro-deposition of silver nanoparticles, Faraday Discuss. 210 (2018) 381-395. https://doi.org/10.1039/C8FD00037A.
53
J.-F. Lemineur, J.-M. Noël, C. Combellas, D. Ausserré, F. Kanoufi, Combining electrodeposition and optical microscopy for probing size-dependent single-nanoparticle electrochemistry, Angew. Chem. Int. Ed. 57 (2018) 11998-12002. https://doi.org/10.1002/anie.201807003.
54
C. Amatore, J.-M. Savéant, D. Tessier, Charge transfer at partially blocked surfaces: A model for the case of microscopic active and inactive sites, J. Electroanal. Chem. 147 (1983) 39-51. https://doi.org/10.1016/S0022-0728(83)80055-2.
55
S. R. Belding, R. G. Compton. Transient voltammetry at electrodes modified with a random array of spherical nanoparticles: theory, J. Phys. Chem. C 114 (2010) 8309-8319. https://dio.org/10.1021/jp1015388.
56
O. Sliusarenko, A. Oleinick, I. Svir, C. Amatore, Development and validation of an analytical model for predicting chronoamperometric responses of random arrays of micro‐
and nanodisk electrodes, Chemelectrochem 2 (2015) 1279-1291.
https://doi.org/10.1002/celc.201500222.
57
N. Godino, X. Borrisé, F. X. Munoz, F. J. del Campo, R. G. Compton, Mass transport to nanoelectrode arrays and limitations of the diffusion domain approach: theory and experiment, J. Phys. Chem. C 113 (2009) 11119-11125.
https://doi.org/10.1021/jp9031354.
58
M. C. Henstridge, R. G. Compton, Mass transport to micro- and nanoelectrodes and their arrays: a review, Chem Record 12 (2012) 63-71. https://doi.org/10.1002/tcr.201100032.
59
E. Michailova, A. Milchev, Influence of potassium sodium tartrate on the initial stage of silver electrodeposition, J. Appl. Electrochem. 21 (1991) 170-174. https://doi.org/10.1007/BF01464299.
60Y. Fang, W. Wang, X. Wo, Y. Luo, S. Yin, Y. Wang, X. Shan, N. Tao, Plasmonic imaging
of electrochemical oxidation of single nanoparticles, J. Am. Chem. Soc. 136 (2014) 12584-12587.https://doi.org/10.1021/ja507097y.
61
Y. Fang, H. Wang, H. Yu, X. Liu, W. Wang, H.-Y. Chen, N. J. Tao, Plasmonic imaging of electrochemical reactions of single nanoparticles, Acc. Chem. Res. 49 (2016) 2614-2624. https://doi.org/10.1021/acs.accounts.6b00348.
62
J.-S. Ferenc, Z. Néda, On the size distribution of Poisson Voronoi cells, Physica A 385 (2007) 518-526.https://doi.org/10.1016/j.physa.2007.07.063.
63
S. B. DiCenzo, G. K. Wertheim, Monte Carlo calculation of the size distribution of supported clusters, Phys. Rev. B 39 (1989) 6792-6796. https://doi.org/10.1103/PhysRevB.39.6792.