HAL Id: inserm-00550232
https://www.hal.inserm.fr/inserm-00550232
Submitted on 24 Dec 2010
HAL is a multi-disciplinary open access archive for the deposit and dissemination of sci-entific research documents, whether they are pub-lished or not. The documents may come from teaching and research institutions in France or abroad, or from public or private research centers.
L’archive ouverte pluridisciplinaire HAL, est destinée au dépôt et à la diffusion de documents scientifiques de niveau recherche, publiés ou non, émanant des établissements d’enseignement et de recherche français ou étrangers, des laboratoires publics ou privés.
A high-risk signature for patients with multiple
myeloma established from the molecular classification of
human myeloma cell lines.
Jérôme Moreaux, Bernard Klein, Régis Bataille, Géraldine Descamps, Sophie
Maïga, Dirk Hose, Hartmut Goldschmidt, Anna Jauch, Thierry Rème, Michel
Jourdan, et al.
To cite this version:
Jérôme Moreaux, Bernard Klein, Régis Bataille, Géraldine Descamps, Sophie Maïga, et al.. A high-risk signature for patients with multiple myeloma established from the molecular classification of human myeloma cell lines.. Haematologica -Pavia then Roma-, 2011, 96 (4), pp.574-82. �10.3324/haema-tol.2010.033456�. �inserm-00550232�
A high-risk signature for patients with multiple myeloma
established from human myeloma cell lines molecular
classification
Jérôme Moreaux1, Bernard Klein1,2,3, Régis Bataille4, Géraldine Descamps4, Sophie Maïga4, Dirk Hose5,6, Hartmut Goldschmidt5,6, Anna Jauch5,6, Thierry Rème1,3, Michel
Jourdan1, Martine Amiot4, and Catherine Pellat-Deceunynck4
1. INSERM, U847, Montpellier, F-34197 France;
2. Université MONTPELLIER1, UFR Médecine, Montpellier, France; 3. CHU Montpellier, Institute of Research in Biotherapy, F-34285 France;
4. INSERM UMR_S892, IRT-UN, Université de Nantes, Nantes, F-44007 France 5. Medizinische Klinik V, Universitätsklinikum Heidelberg, INF410, Germany; 6. Nationales Centrum für Tumorerkrankungen, INF350, D-69115 Heidelberg, Germany
Correspondence
Catherine Pellat-Deceunynck, PhD, INSERM UMR_S892, Centre de Recherches en Cancérologie Nantes/Angers, IRT-UN, 8 quai Moncousu Nantes, BP70721 F-44007 France. Phone: international +33.228.080298. Fax: international +33.228.080329. E-mail: catherine.pellat-deceunynck@inserm.fr
Bernard Klein, INSERM U847, Institute for Research In Biotherapy, CHU Montpellier, Hospital St Eloi, Av Augustin Fliche, 34295 Montpellier, France.
Phone: international +330.467330455. E-mail: bernard.klein@inserm.fr Acknowledgments
We thank the Plate-Forme de Séquençage-Génotypage OUEST Génopole ® for performing cDNA sequencing. Microarrays experiments were done by the Microarray Core Facility of the Institute of Research in Biotherapy (Montpellier, France)
(http://irb.montp.inserm.fr/en/index.php?page=Plateau&IdEquipe=6). Funding
This work was supported by grants from INCa (PL06_070) and Ligue Nationale Contre le Cancer, Equipes labellisées 2008 (MA) and 2009 (BK).
Abstract
Background
Multiple Myeloma is a plasma-cell tumor with heterogeneity in molecular abnormalities and treatment response.
Design and Methods
We have assessed whether human myeloma cell lines have kept patients’ heterogeneity using Affymetrix gene expression profiling of 40 myeloma cell lines obtained with or without IL6 addition and could provide a signature for stratification of patient’s risk.
Results
Myeloma cell lines, especially those derived in the presence of IL6, displayed a heterogeneity that overlaps the one of the patients with MM. Myeloma cell lines segregated into 6 groups marked by overexpression of MAF, MMSET, CCND1,
FRZB with or without overexpression of cancer testis antigens. Cell lines of
CTA/MAF and MAF groups have a translocation involving C-MAF or MAFB, cell lines of groups CCND1-1 and CCND1-2like have a t(11;14) and cell lines of group MMSET have a t(4;14). CTA/FRZB group gathers cell lines that had none or no recurrent 14q32 translocation. Expression of 248 genes accounted for myeloma cell lines molecular heterogeneity. Myeloma cell lines heterogeneity genes comprise genes with prognostic value for survival of patients making it possible to build powerful prognostic scores.
Conclusion
Myeloma cell lines derived in the presence of IL6 recapitulate the molecular diversity of MM that made it possible the design, using myeloma cell lines heterogeneity genes, of a high-risk signature for patients at diagnosis. We propose this classification to be used when addressing physiopathology of MM with myeloma cell lines.
Introduction
Multiple Myeloma (MM) is a plasma-cell malignancy with a high degree of biological and genetic heterogeneity at presentation and a great variability with regards to the clinical outcome of the patients in response to chemotherapy(1). During the last 15 years, numerous studies have pointed out the heterogeneity of both the phenotype (CD20, CD28, CD56, CD117) and chromosomal abnormalities of multiple myeloma cells (MMC) in association with patient outcome (2-4). Chromosomal abnormalities include full or partial deletion of chromosomes 13 or 17, 1q21 amplifications, recurrent 14q32 translocations (in 40% of the patients involving either CCND1,
MMSET and FGFR3, CCND3, c-MAF or MAFB) and hyperdiploidy (in 45% of
patients with MM). The combined analysis of phenotype, chromosomal abnormalities and morphology has brought up the concept of “many and multiple myelomas”(5). Bergsagel et al. have proposed a GEP-based molecular classification of MM taking into account the ubiquitous expression of D-type cyclins (6). They pointed out an expression of one of the three cyclin D genes as a general feature of MM and proposed a classification of patients within eight TC (translocation/cyclin D) groups(6, 7). Using GEP of 414 newly diagnosed patients, Zhan et al. have proposed a molecular classification of MM into 7 groups(8). These groups are characterized by an overexpression of genes involved in cell cycle and proliferation (PR group for proliferation), a lower expression of genes involved in bone disease (LB group for ‘‘low bone disease’’), an aberrant expression of FGFR3 and MMSET genes (MS group for MMSET), a hyperdiploid signature (HY group); an overexpression of cyclin
D1 or cyclin D3 genes (CD-1 and CD-2 groups), or an overexpression of MAF and
MAFB genes (MF group) (8). HY, CD-1, CD-2, and LB groups had a longer
GEP classification is a significant predictor for survival in MM. Using the same series of Affymetrix GEP data, Shaughnessy’s group identified 70 genes whose up-regulation or down-up-regulation was linked with bad prognosis. A high-risk score was built delineating a subset of 13% of newly-diagnosed patients with adverse prognosis(9). This high-risk score has a strong prognostic value. The Intergroupe Français du Myélome (IFM) group reported another gene signature - IFM score - for high-risk patients(10). Finally, hyperdiploid MM were also subclassified into 4 groups with different clinical outcomes or drug sensitivity(11).
The obtainment of human myeloma cell lines (HMCLs) is an important tool for promoting our understanding myeloma pathogenesis and finding novel therapies. In particular, the biological studies of MM disease are often done with a limited set of HMCLs. General conclusions are then being drawn for explaining MM disease, without really knowing the relevance of a limited set of HMCLs to MM disease in vivo. The immortalization of primary MMC into HMCL remains a rare event occurring only once primary MMC do highly proliferate in vivo and have likely escaped their bone marrow environment dependence with extramedullary proliferation. One mechanism could be the high frequency of Myc gene deregulation in 93% of these HMCLs(12). Since the identification of IL-6 as a main growth factor for MMC 20 years ago (13-15), we have obtained a large cohort of HMCLs, culturing primary MMC from patients with extramedullary proliferation with IL-6(16). These HMCLs are heterogeneous based on phenotype, chromosomal abnormalities and growth factor responses(17-20). Previous evaluation on limited number of HMCLs lacking IL6-type HMCLs showed that HMCLs were not a reflect of MM diversity(21, 22)
Analyzing the gene expression profile (GEP) of 40 HMCLs including a majority of IL6-type HMCLs with Affymetrix U133 2.0 plus microarrays, we show here that HMCLs
have kept the molecular heterogeneity of primary MMC of newly diagnosed patients. A list of 248 genes makes it possible to document HMCL biological and genetic heterogeneity. Of major interest, this HMCL heterogeneity gene list comprises genes that allow the design of powerful gene based risk scores according to patients’ treatment. This classification should be used when addressing physiopathology of MM with HMCLs.
Design and Methods
Human Myeloma Cell Line (HMCLs)
XGs, NANs, BCN, MDN and SBN HMCLs were derived in our laboratories from primary myeloma cells cultured in RPMI1640 medium in the presence of 10% fetal calf serum (FCS) and 3 ng/ml recombinant IL-6 as previously described(16, 23-25). ANBL-6 was kindly provided by Dr Jelinek (Rochester,USA), KMS-11, KMS12-BM, KMS12-PE and KMM1 by Dr Otsuki (Okayama, Japan), JJN3 by Dr Van Riet (Bruxelles, Belgium), JIM3 by Dr MacLennan (Birmingham, UK), Karpas620 by Dr Karpas (Cambridge UK) and MM1S by Dr S. Rosen (Chicago, USA). AMO-1, LP1, L363, NCI-H929, U266, OPM2, and SKMM2 were from DSMZ (Germany), and RPMI8226 from ATTC (USA). All HMCLs derived in our laboratories and ANBL-6 were cultured in the presence of r-IL-6. Identification of each HMCL was assessed by HLA Class I typing. Interphase FISH was performed according to our previously reported standard protocol(26). Metaphase spreads and interphase cells were evaluated using a DM RXA2 fluorescence microscope (Leica, Bensheim, Germany). Ras and TP53 mutations were identified by direct sequencing of RT-PCR products (Supplementary TableS2). HMCL microarray data have been deposited in the
ArrayExpress public database under accession numbers 937 and E-TABM-1088.
Primary myeloma cells
Multiple Myeloma cells (MMC) were purified from 206 patients with newly-diagnosed MM after written informed consent was given at the University hospitals of Heidelberg (Germany) or Montpellier (France). The study was approved by the ethics boards of Heidelberg University and Montpellier University.
These 206 patients were treated with Vincristine, Adriamicyne and Dexamethasone (VAD), high dose Melphalan (HDM) and autologous stem cell transplantation (ASCT) (27) and were termed in the following Heidelberg-Montpellier (HM) series. The .CEL files and MAS5 files have been deposited in the ArrayExpress public database, under accession number E-MTAB-362. We also used Affymetrix data of a cohort of 345 purified MMC from previously untreated patients from the Arkansas Cancer Research Center (ACRC, Little Rock, AR). The patients were treated with total therapy 2 including HDM and ASCT (28) and termed in the following ACRC-TT2 series. These data are publicly available via the online Gene Expression Omnibus (Gene Expression Profile of Multiple Myeloma, accession number GSE2658. http://www.ncbi.nlm.nih.gov/geo/). After Ficoll-density gradient centrifugation, plasma cells were purified using anti-CD138 MACS microbeads (Miltenyi Biotech, Bergisch Gladbach, Germany).
Preparation of complementary RNA (cRNA) and microarray hybridization
HMCLs were cultured with or without IL-6 (as described above) and RNA were prepared from exponentially growing cells. RNA was extracted using the RNeasy Kit (Qiagen, Hilden, Germany) as previously described(29, 30). Biotinylated cRNA was amplified with a double in vitro transcription and hybridized to the human U133 2.0
plus GeneChips, according to the manufacturer’s instructions (Affymetrix, Santa Clara, CA)(31). Fluorescence intensities were quantified and analyzed using the GECOS software (Affymetrix).
Real-time RT-PCR
Total RNA was converted to cDNA using the Superscript II reverse transcriptase (Invitrogen, Cergy Pontoise, France). The assays-on-demand primers and probes and the TaqMan Universal Master Mix were used according to the manufacturer’s instructions (Applied Biosystems, Courtaboeuf, France). The measurement of gene expression was performed using the ABI Prism 7000 Sequence Detection System and analyzed using the ABI PRISM 7000 SDS Software. For each primer, serial dilutions of a standard cDNA were amplified to create a standard curve to assess the PCR efficiency of each assay, only assays showing linearity across the dilution series were used for deltaCT analysis. CT values were obtained for GAPDH and the respective genes of interest during log phase of the cycle. Gene of interest levels were normalized to GAPDH for each sample (!CT = CT gene of interest – CT GAPDH) and compared with the values obtained for a known positive control using the following formula 100/2!!CT where !!CT = !CT unknown – !CT positive control.
Spiked MMSET expression surrogating t(4;14)
The t(4;14) translocation results in aberrant FGFR3 expression in 70% of patients and MMSET spiked expression in 100% of patients(32), and spiked MMSET expression has been taken as surrogate for the presence of t(4;14) as previously described(19).
Gene expression profiling and statistical analyses
Gene expression data were normalized with the MAS5 algorithm and analyzed with our bioinformatics platforms: RAGE (http://rage.montp.inserm.fr/)(33) and Amazonia
(http://amazonia.montp.inserm.fr/)(34). Probe sets with a present call in less then 3 out of 40 HMCLs and a variation coefficient ! 100 were excluded from the analysis. When several probe sets interrogated a same gene, the probe set with the highest variance among HMCLs was used, yielding to 4163 unique genes. A hierarchical clustering using average linkage and centered correlation metric was used to identify subgroups. The genes that were significantly overexpressed or underexpressed in specific subgroups were identified using multiclass supervised analysis with the significance analysis of microarray software (SAM)(35) with a 1000-permutation adjustment. The event free or overall survival of subgroups of patients was compared with the log-rank test and survival curves computed with the Kaplan-Meier method. The prognostic values of parameters were compared with univariate or multivariate Cox analysis. Statistical comparisons were done with Mann-Whitney, Chi-square, or Student t-tests. Statistical tests were performed with the software package SPSS 12.0 (SPSS, Chicago, IL).
Results
Characteristics of HMCL cohort
Our cohort of 40 HMCLs comprises 24 HMCLs reproducible obtained adding exogenous IL-6 and FCS (23 from Montpellier/Nantes teams) and 16 HMCLs (collected from other laboratories and commonly used worldwide) that were obtained with FCS without adding exogenous IL-6. These HMCLs will be termed in the following HMCLsserum+IL-6 and HMCLsserum (Table 1). A major difference between HMCLsserum+IL-6 and HMCLsserum is their dependence on addition of exogenous IL-6 to grow in vitro. The growth of 16 of the 24 HMCLsserum+IL-6 and that of 0 out of the 16 HMCLsserum was strictly dependent on addition of exogenous IL-6 in vitro (IL-6
dependence ++, P = 6E-5). A simple explanation is that adding exogenous IL-6 made it possible to expand both exogenous IL-6 dependent and independent primary MMC. CD45 expression was associated with IL-6 dependence as 62.5% (15/24) of HMCLsserum+IL-6 did express CD45 as compared to 25% (4/16) of HMCLsserum (P = .027). All HMCLs but one expressed CD138, 36/40 expressed highly CD38, 38/40 did not express CD20 and 39/40 did not express CD19 (Supplementary Table S1). Cytogenetics was done in 39 HMCLs. 90% of the HMCLs had a 14q32 translocation involving MAF (31%), CCND1 (28%) or MMSET (23%) genes (Tables 1A and 1B). Of note, HMCLs with t(4;14) translocation rarely expressed CD45 (2/9) and when it is the case at a low level (Table 1A), as reported for primary MMC(36). TP53 abnormalities (point mutation, deletion, insertion, lack of expression, see details in Supplementary Table S2) were found in 65% of HMCLs (Table 1A & B). HMCLsserum+IL-6 had a trend to have less TP53 abnormalities than HMCLsserum, 58% versus 81% (P=0.1). Ras mutations (N-ras and K-ras) were found in 45% of HMCLs (Table 1B). Six HMCLs, five from HMCLsserum+IL-6 cohort, had neither N- or K-Ras mutation nor TP53 abnormality (Tables 1, Supplementary Table S2). There was a 4-fold increase in the frequency of translocations involving c-MAF or MAFB genes compared with those published for primary MMC of newly diagnosed patients (P < .0001) (1). Thus, HMCLs are heterogeneous in term of the method of obtainment, IL-6 dependence, phenotype and gene abnormalities. The greatest heterogeneity is found for HMCLsserum+IL-6 with 25% of HMCLsserum+IL-6 with no myeloma specific recurrent translocation or no translocation versus 6% for HMCLsserum (P = .0002). In order to look further for HMCL heterogeneity, whole genome transcriptome analysis was performed using Affymetrix U133 2.0 plus microarrays.
Comparing the gene expression profile of HMCLsserum+IL-6 andHMCLsserum, 23 genes were upregulated in HMCLsserum+IL-6, but none in HMCLsserum (1000 permutations, ratio " 2 and FDR = 0%, Supplementary Table S3A). Among these 23 genes, three - CD45 (PTPRC), SOCS3, and BCL6 - have been reported to be induced by IL-6 in MMC or other cell lineages (37-39)(Supplementary Table S3A). The NF-#B gene index reported by Anunziata et al. (40) and adapted to HMCLs (41) ranged from 4.2 to 8.6 without significant difference between HMCLsserum+IL-6 and HMCLsserum (Supplementary Table S4). Only 2 genes (MDM2 and CDKN1A), 2 well known TP53 targets (42) were differentially expressed between HMCLs without and with TP53 mutations (data not shown). No significant differential gene expression was found between HMCLs with or without N-ras or K-ras mutations (results not shown).
Identification of 6 groups in human myeloma cell lines based on gene expression profiles and identification of 248 genes documenting the heterogeneity of HMCLs.
The 40 HMCLs could be clustered into six groups using unsupervised hierarchical clustering and 4163 probe sets with the highest variance. Within each group, the GEP of the HMCLs were significantly correlated each other (P $ .05) but none of the six groups was significantly correlated to another one. Each of the 6 groups could be identified by genes known to be important markers of MM disease such as c-MAF,
CCND1, FRZB, MMSET, FGFR3 and cancer testis antigens (CTA) (Supplementary
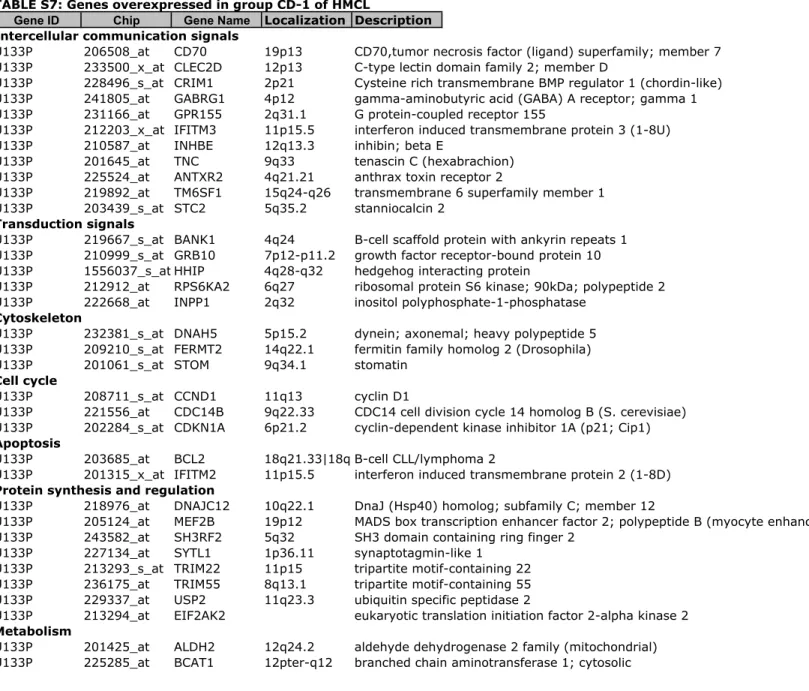
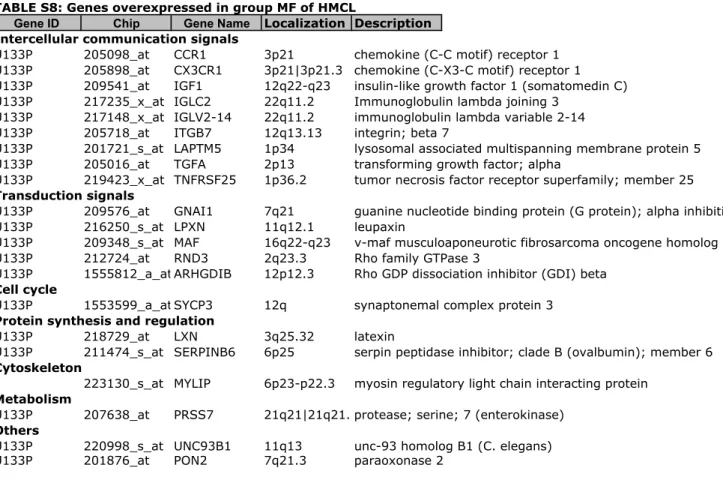
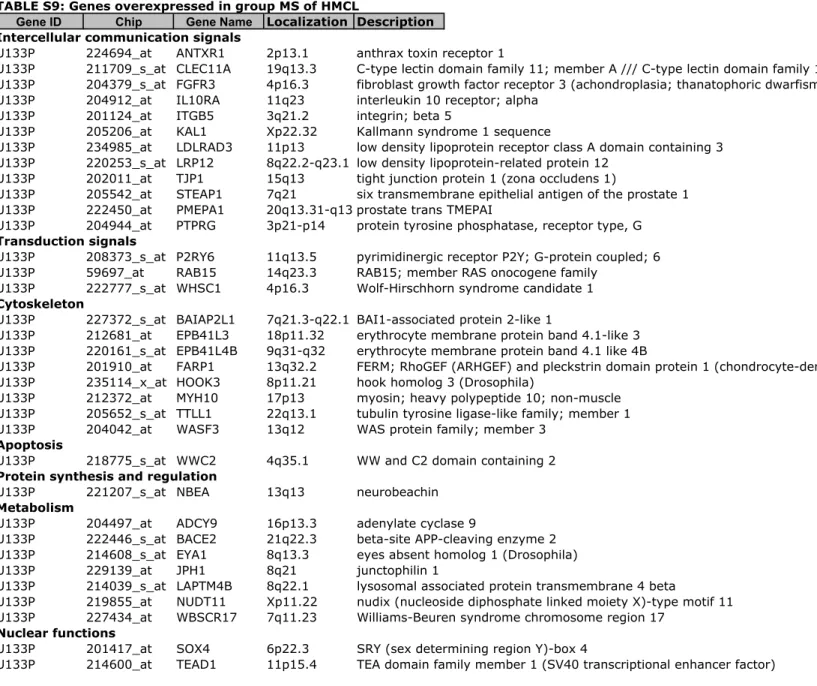
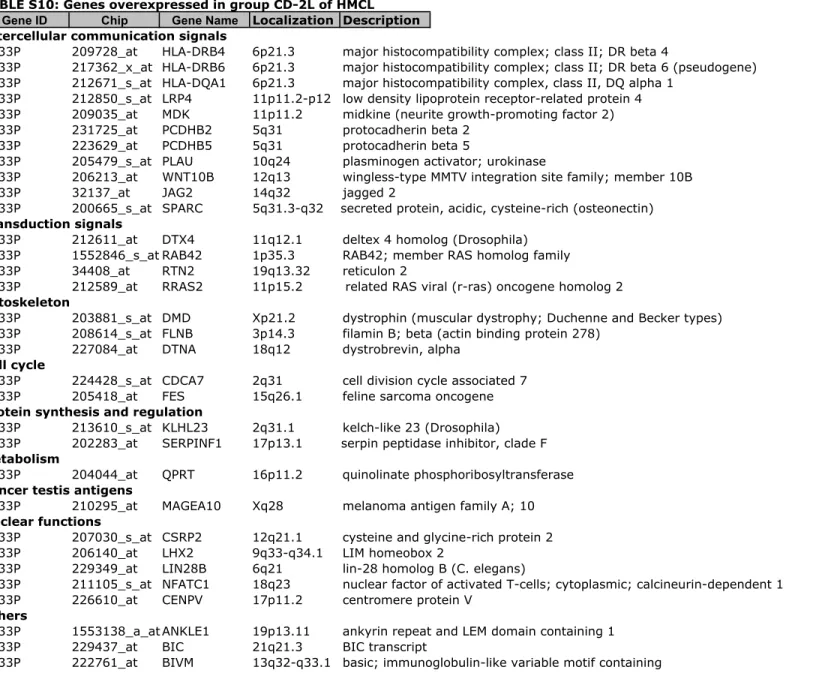
Figure S1). To further delineate the gene signature of these 6 groups, a SAM multiclass analysis was ran identifying 248 HMCL heterogeneity genes differentially expressed between the 6 groups (1000 permutations, FDR ! 5%) (Supplementary Tables S5 to S10). Using these 248 genes, an unsupervised hierarchical clustering grouped HMCLs into 2 major clusters and for each cluster, into 3 groups. In the first
cluster, the 2 groups are characterized by translocations involving MMSET/FGFR3, or MAF loci and were termed MS, and MF groups by analogy with ACRC molecular classification(8, 43) (Figures 1 A&B). In the second cluster, 2 groups overexpress CTA genes : one is also characterized by MAF translocations (termed CTA/MF) and a second one by a lack of recurrent translocations and an overexpression of FRZB (termed CTA/FRZB). This later comprises 5 HMCLs without 14q32 translocation or MM specific recurrent translocations, with an increase in odd chromosomes, and shows overexpression of CTA and FRZB genes. As 5 out of 7 HMCLs from CTA/FRZB group are of male origin, we have checked that CTA/FRZB group was not built due to Y chromosome gene expression since deleting Y chromosome genes did not change the CTA/FRZB clustering (data not shown). CTA/MF and CTA/FRZB groups comprise exogenous IL-6 dependent HMCLs only except the U266 HMCL that can grow without adding IL-6. But U266 cells produce autocrine IL-6 that drives their growth(44). 5 out of 6 HMCLs of CTA/MF group had translocations involving
c-MAF or c-MAFB as HMCLs of MF group and SAM analysis between CTA/MF and MF
groups indicated that mostly CTA genes were differentially expressed (Table S3B & C).
The two last groups gather HMCLs with cyclin D1 or D3 translocations. One group had a typical CCND1 signature and was termed CD-1. The other one had also a CCND1 signature with expression of genes that were found in CD-2 group (RRAS2,
ZDHHC14, MDK, DMD). However, because this group didn’t overexpress anchoring
genes of CD-2 group like MS41 or PAX5, it was termed CD-2like (CD-2L). SAM analysis between CD-1 and CD-2L groups indicated that among genes differentially expressed between the 2 groups, 6 (WARS, DNAJC12, TM6SF1, ATF5, STOM,
ERN1) belong to the genes differentially expressed between CD-1 and CD-2 groups
of patients.
Of note, a homologous classification of HMCLs was obtained using the 700 genes of the Arkansas group(8) allowing molecular classification of patients (Supplementary Figure S2) (P = NS).
Expression of 4 genes - LRP12, TEAD1, MAF and ITGB7 - was validated by real time RT-PCR (Supplementary Figure S3).
HMCLs have kept some of the molecular heterogeneity of newly diagnosed patients
Using the 248 genes discriminating the 6 HMCL groups, an unsupervised clustering was ran with the GEP of primary MMC of 345 newly-diagnosed patients of ACRC TT2 cohort (Figure 2). Six clusters were identified with a significant correlation between samples within a given cluster (P $ .05). This clustering of primary MMC based on HMCL heterogeneity gene signature partially overlapped the ACRC 7 group molecular classification (P = .01)(8). Cluster 1 comprised 93% of patients of the MS (spiked MMSET expression) group, cluster 2: 71% of patients of LB (low bone disease) group, cluster 3: 100% of patients of MF (c-MAF or MAF-B overexpression) group, cluster 4: 46% of patients of PR (proliferation) group and 29% of patients of HY (hyperdiploid) group, cluster 5: 92% of patients of HY group and cluster 6: 89% of patients of CD-1 or CD-2 (cyclin D1 expression) groups (Figure 2). These data demonstrate that HMCLs have kept the molecular heterogeneity MMC of newly-diagnosed patients. Of note, 25 genes were shared between the 248 HMCL heterogeneity genes and the 350 top 50 genes making it possible to define the ACRC 7 group molecular classification (8).
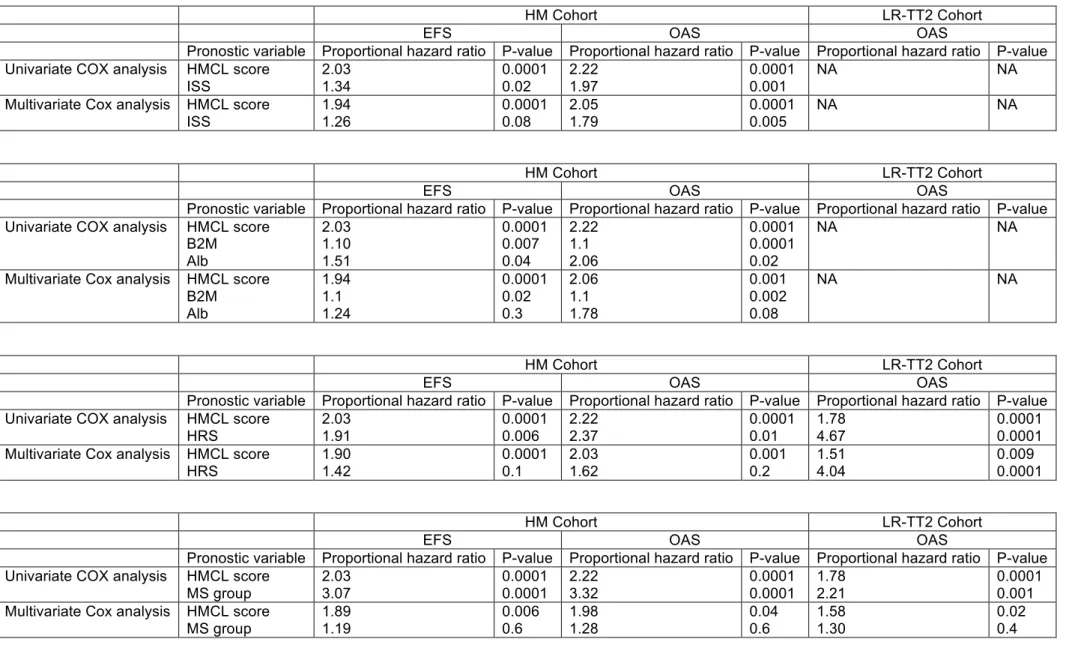
Given that the 248 HMCL heterogeneity genes could be indicators of primary MMC heterogeneity, we looked for whether some of these genes could predict for patient’s survival. We used the Heidelberg-Montpellier (HM) cohort of 206 patients treated within or in analogy to GMMG-HD3 trial (27) and the ACRC-TT2 cohort of 345 patients treated with total therapy 2 (Supplementary Table S11) (28). Seven out of the 248 HMCL heterogeneity genes - TEAD1, CLEC11A, LRP12, MMSET, FGFR3,
NUDT11 and KIAA1671 - had bad prognostic value for both EFS and OAS in the HM
cohort and for OAS in the ACRC-TT2 cohort (Figure 3A & B). All 7 genes were overexpressed in the MS group – t(4;14) – and 3/7 - LRP12, TEAD1, NUDT11 - were significantly overexpressed in the PR group of patients (Figure S4). To combine the prognostic information of these 7 genes, a simple staging was built scoring patients from 0 to 7 (patients with 0/7 genes present, 1/7, 2/7, ", 7/7), running Kaplan-Meier analyses with the 8 patients groups, grouping together groups with no prognostic difference, and thus obtaining 3 major patient groups with different EFS in HM cohort and in OAS in both HM and ACRC-TT2 series. Group 1 comprises patients whose MMC expressed none or 1 bad prognosis gene, group 2 patients expressing 2 to 4 bad prognosis genes and group 3 at least 5 (Figure 4A). Group 1 represented 71% of the HM patients and 73% of the ACRC-TT2 patients, group 2 21% and 22% of HM or ACRC-TT2 patients respectively and group 3, 8% and 5% of HM and ACRC-TT2 patients (Figure 4A and Figure S5). Group 3 was associated with the worst prognosis in the HM and the ACRC-TT2 cohorts (30.5 months and 41 months in the HM and the ACRC-TT2 cohorts respectively)(Figure 4B and 4C).
At least 2 gene scores based on microarray GEP were predictive for patients’ event free or overall survival, the high risk score (HRS) with 70 genes (9) and the Intergroupe Francais du Myelome (IFM) score with 15 genes (10). The HMCL score
gene list shares no gene with HRS or IFM score gene lists. When compared together in multivariate Cox analysis, only the HMCL score was significant unlike HRS and/or IFM scores in the HM cohort. In ACRC-TT2, HMCL score and HRS were significant in multivariate Cox analysis, IFM score being no more significant (Supplementary Table S12). The prognostic value of the HMCL score is not hardly surprising since it identified 2 groups of patients which are already known to have poor prognosis for patients treated with VAD and then HDM and ASCT: patients with t(4;14) and patients with a proliferation gene signature.
To go on concerning the interest of using HMCL gene list to define prognostic patients’ group, patients with t(4;14) who are already known to have a poor prognosis according to this treatment protocol were deleted and the same methodology was ran. A list of 6 prognostic genes was obtained - FSTL5, GAGE1, GAGE12, BCHE,
HOOK3 and LOC283352 – (different from the previous 7 prognostic genes) making it
possible to separate patients without t(4;14) in 2 groups with a different prognosis (Figure 5A&B and Figure S6). Compared to these 2 groups, patients with t(4;14) had a worst prognosis (Supplementary Figure S6). GAGE1 and GAGE12 were overexpressed in the PR group, BCHE in the CD-1 group, LOC283352 in the HY and the PR groups and FSTL5 in the HY group. HOOK3 was not significantly overexpressed by one of the 7 groups of patients (data not shown). This second HMCL gene score strengthens the interest of using HMCL gene list to define prognostic patients’ group in MM.
Discussion
In this study, we have investigated the molecular heterogeneity of a large cohort of HMCLs and it reflects part of the molecular heterogeneity of primary MMC of newly-diagnosed patients. This heterogeneity of MM is evidenced by various genetic
abnormalities, in particular 5 MM specific recurrent translocations, and the finding of 7 molecular groups using unsupervised classification of high-throughput gene expression data by the ACRC group(8). This HMCL heterogeneity is in full contrast with previous finding showing that HMCLs were not representative of MM diversity (21, 22) but both previous studies used a limited number of HMCLs mainly of serum-type only. Using only HMCL information, a 248-HMCL heterogeneity gene list was found allowing to classify MMC of newly-diagnosed patients with a significant overlap with previously-reported ACRC molecular MMC classification(8). Given this overlapping, the ACRC nomenclature was mainly used to term HMCL groups. In addition, this 248 HMCL heterogeneity gene list comprises genes that can identify patients poorly responding to a given treatment. Several simple and logical conclusions can be drawn. First, the method of obtaining HMCLs greatly influences their molecular heterogeneity. The greatest heterogeneity was found within HMCLsserum+IL-6, i.e. obtained with IL-6 and serum. In the presence of IL-6 and serum, MMC with or without myeloma-specific recurrent translocations have been immortalized, whereas, in the presence of serum, mostly MMC with recurrent translocations (involving cyclin D1, MAF or MMSET/FGR3 genes) (14/16 HMCLserum) have been immortalized. This suggests that addition of exogenous IL-6 has made it possible to expand both exogenous IL-6 dependent and independent primary MMC. An immediate conclusion is to go on obtaining HMCLs culturing primary MMC with all known myeloma growth factors (at least IGF-1, IL-6, APRIL, IL-21, HGF) to avoid selection of primary MMC responsive to one specific growth factor only(19, 20, 45, 46).
HMCLsserum were mostly CD45- (12/16 HMCLsserum) and respond to IGF-1 or IL-21(20, 47). In contrast, HMCLsserum+IL-6 were CD45+ or CD45- (with a proportion close
to that reported in newly-diagnosed patients, 2/3 and 1/3, respectively(48) and CD45+ HMCLs are not stimulated by IGF-1 or IL21 alone. C-MAF or MAF-B translocated HMCLs were highly represented within the HMCLsserum+IL-6 cohort (8/24 HMCLsserum+IL-6) suggesting that MMC overexpressing MAF genes are highly sensitive to paracrine IL-6. Besides the heterogeneity due to culture method of parental primary MMC, the molecular heterogeneity of HMCLs is built on Ig translocation occurring in parental primary MMC and on CTA gene expression. Myeloma cells frequently express CTA although the mechanisms deregulating CTA expression remain pending(49). CTA gene expression is epigenetically regulated in various cancers(50, 51). More recently, Walker et al. have shown that the transition of normal PC and MGUS stage to MM is associated with DNA hypomethylation, but the transition of intramedullary stage to PCL or HMCL stage is associated with DNA hypermethylation(52). The CTA signature in CTApos HMCLs could be an indicator of higher hypomethylation status than in CTAneg HMCLs(51).
All HMCLs with t(4;14) translocation underexpress CTA. One possible explanation is that the deregulation induced by t(4;14) yields to a drug resistance and poor prognosis, making CTA deregulation not necessary. Noteworthy, primary MMC with t(4;14) overexpress IGF1R and IGF1 (19, 53), making likely easier their immortalization without IL-6. On the other hand, 4 of 7 HMCLs of the CTA/FRZB group have no myeloma-specific recurrent translocations. This CTA/FRZB group expresses CTA genes and FRZB that could fit with one of the four reported hyperdiploid groups of patients overexpressing CTA genes(11). Of note, all these HMCLs overexpress EDNRB which is also overexpress by hyperdiploid group of patients(43). However, they have numerous genetic abnormalities, eventually
induced secondarily at relapses or in vitro, making not possible to ascertain they originate from hyperdiploid MMCs.
Regarding cyclin D or MAF translocations, HMCLs belong both to two groups. HMCLs of CD-2L group were mostly IL-6 independent HMCLs (6 out of 7) and expressed some CTA in contrast to those of CD-1 group (1 out of 5 HMCLsIL-6). Ingenuity analysis of genes differentially expressed between CD-1 and CD-2L groups shown an upregulation of genes related to the lipid metabolism (data not shown). CTA/MAF HMCLs are all IL-6 dependent. An explanation was that adding IL-6 could be critical to immortalize primary MMC from these patients. In agreement, we found that primary MMC from MF patients underexpressed IL-6 gene but overexpressed both chains of IL-6R complex suggesting that MMC from MF patients are more dependent on paracrine IL-6(19).
Using the 248 HMCL heterogeneity genes, we have found 7 genes - CLEC11A,
FGFR3, KIAA1671, LRP12, MMSET, NUDT11, TEAD1 – that make it possible to
build an HMCL score predicting survival in newly-diagnosed patients with MM treated with high-dose chemotherapy. This HMCL score segregates MM patients into 3 groups with low, intermediate and high risk. These 7 HMCL genes share no gene with those of 2 previously reported gene-based risk scores, HRS and IFM scores(9, 10). This HMCL score was shown to be more potent than IFM score in the 2 independent patient cohorts, more potent than HRS in our patient cohort and remains independent of HRS in ACRC-TT2 series (Supplementary Table S12). This is remarkable because this list of 248 HMCL heterogeneity genes has been obtained with cells cultured for many years in vitro, from a minor subset of patients with extramedullary proliferation. Not surprisingly, the 2 patient groups with poor prognosis comprise mainly patients with t(4;14) and patients with a proliferation gene
signature, 2 groups already identified with poor prognosis in patients treated with HDM and ASCT. To further investigate the interest of using HMCL gene list to define prognostic patients’ group, the same methodology was applied to patient cohorts deleted of patients with t(4;14) already known to have a poor prognosis, making it possible to separate patients without t(4;14) in 2 different prognosis groups (Figure 5A & B). Thus, this 248 HMCL heterogeneity gene list – defined independently of primary MMC information - comprises genes that could help to define patients poorly responding to a given treatment.
Another important conclusion regarding the current data is the interest but also the danger of using HMCLs to study MM biology. Primary MMC are uneasy to obtain in sufficient amounts and poorly survive in culture in vitro(16, 25). This is the reason why the majority of the studies of MM disease physiopathology used a limited set of cell lines and a final validation with 1-5 samples of primary MMC, often from patients with extramedullary proliferation. Given the 6 group molecular heterogeneity of HMCLs we reported here using 248 genes, it should be important to recommend the investigators to classify the HMCLs they used in one of the groups and to indicate that the extension of HMCL-derived concepts to MM disease should be limited to patients’ subgroups at least. In this study, the role and influence of microenvironment on HMCL gene expression profile was not addressed. It was demonstrated that stromal interactions could influence expression patterns of MMC(54-56). Further analysis of GEP modification by coculture should be of major interest to identify pathways activated by the microenvironment in relation to MM diversity.
In conclusion, this study has shown that HMCLs obtained with IL-6 and serum cover a large part of the molecular heterogeneity primary MMC. A 248-gene list defining HMCLs heterogeneity contains new prognostic genes. This representative cohort
could be helpful to identify common critical pathways and new therapeutic targets for molecular and chromosome based myeloma subgroups.
AUTHORSHIP AND DISCLOSURES
The authors have nothing to disclose.
Author contributions:
MJ performed research and participated in the writing of the paper.
KB participated in the design of the research and the writing of the paper. RB participated in the design of the research and the writing of the paper.
HD, and GH collected bone marrow samples and clinical data and participated in the writing of the paper.
RT participated in the bioinformatic studies and participated in the writing of the paper.
JA provided cytogenetics analysis.
JM participated in the writing of the paper. DG provided cytogenetics analysis
MS performed research
AM participated in the design of the research and the writing of the paper.
PDC performed research, participated in the design of the research and the writing of the paper.
References :
1. Fonseca R, Bergsagel PL, Drach J, Shaughnessy J, Gutierrez N, Stewart AK, et al. International Myeloma Working Group molecular classification of multiple myeloma: spotlight review. Leukemia. 2009;23(12):2210-21.
2. Fonseca R, Barlogie B, Bataille R, Bastard C, Bergsagel PL, Chesi M, et al. Genetics and cytogenetics of multiple myeloma: a workshop report. Cancer Res. 2004;64(4):1546-58.
3. Mateo G, Montalban MA, Vidriales MB, Lahuerta JJ, Mateos MV, Gutierrez N, et al. Prognostic value of immunophenotyping in multiple myeloma: a study by the PETHEMA/GEM cooperative study groups on patients uniformly treated with high-dose therapy. J Clin Oncol. 2008;26(16):2737-44.
4. Avet-Loiseau H, Attal M, Moreau P, Charbonnel C, Garban F, Hulin C, et al. Genetic abnormalities and survival in multiple myeloma: the experience of the Intergroupe Francophone du Myelome. Blood. 2007;109(8):3489-95.
5. Garand R, Avet-Loiseau H, Accard F, Moreau P, Harousseau JL, Bataille R. t(11;14) and t(4;14) translocations correlated with mature lymphoplasmacytoid and immature morphology, respectively, in multiple myeloma. Leukemia.
2003;17(10):2032-5.
6. Bergsagel PL, Kuehl WM, Zhan F, Sawyer J, Barlogie B, Shaughnessy J, Jr. Cyclin D dysregulation: an early and unifying pathogenic event in multiple myeloma. Blood. 2005;106(1):296-303.
7. Hideshima T, Bergsagel PL, Kuehl WM, Anderson KC. Advances in biology of multiple myeloma: clinical applications. Blood. 2004;104(3):607-18.
8. Zhan F, Huang Y, Colla S, Stewart JP, Hanamura I, Gupta S, et al. The molecular classification of multiple myeloma. Blood. 2006;108(6):2020-8.
9. Shaughnessy JD, Jr., Zhan F, Burington BE, Huang Y, Colla S, Hanamura I, et al. A validated gene expression model of high-risk multiple myeloma is defined by deregulated expression of genes mapping to chromosome 1. Blood.
2007;109(6):2276-84.
10. Decaux O, Lode L, Magrangeas F, Charbonnel C, Gouraud W, Jezequel P, et al. Prediction of survival in multiple myeloma based on gene expression profiles reveals cell cycle and chromosomal instability signatures in high-risk patients and hyperdiploid signatures in low-risk patients: a study of the Intergroupe Francophone du Myelome. J Clin Oncol. 2008;26(29):4798-805.
11. Chng WJ, Kumar S, Vanwier S, Ahmann G, Price-Troska T, Henderson K, et al. Molecular dissection of hyperdiploid multiple myeloma by gene expression profiling. Cancer Res. 2007;67(7):2982-9.
12. Dib A, Gabrea A, Glebov OK, Bergsagel PL, Kuehl WM. Characterization of MYC translocations in multiple myeloma cell lines. J Natl Cancer Inst Monogr. 2008;(39):25-31.
13. Klein B, Zhang XG, Jourdan M, Content J, Houssiau F, Aarden L, et al.
Paracrine rather than autocrine regulation of myeloma-cell growth and differentiation by interleukin-6. Blood. 1989;73(2):517-26.
14. Kawano M, Hirano T, Matsuda T, Taga T, Horii Y, Iwato K, et al. Autocrine generation and requirement of BSF-2/IL-6 for human multiple myelomas. Nature. 1988;332(6159):83-5.
15. Zhang XG, Bataille R, Widjenes J, Klein B. Interleukin-6 dependence of advanced malignant plasma cell dyscrasias. Cancer. 1992;69(6):1373-6. 16. Zhang XG, Gaillard JP, Robillard N, Lu ZY, Gu ZJ, Jourdan M, et al.
Reproducible obtaining of human myeloma cell lines as a model for tumor stem cell study in human multiple myeloma. Blood. 1994;83(12):3654-63.
17. Bataille R, Jego G, Robillard N, Barille-Nion S, Harousseau JL, Moreau P, et al. The phenotype of normal, reactive and malignant plasma cells. Identification of "many and multiple myelomas" and of new targets for myeloma therapy.
Haematologica. 2006;91(9):1234-40.
18. Moreaux J, Hose D, Jourdan M, Reme T, Hundemer M, Moos M, et al. TACI expression is associated with a mature bone marrow plasma cell signature and C-MAF overexpression in human myeloma cell lines. Haematologica. 2007;92(6):803-11.
19. Sprynski AC, Hose D, Caillot L, Reme T, Shaughnessy JD, Jr., Barlogie B, et al. The role of IGF-1 as a major growth factor for myeloma cell lines and the
prognostic relevance of the expression of its receptor. Blood. 2009;113(19):4614-26. 20. Collette M, Descamps G, Pellat-Deceunynck C, Bataille R, Amiot M. Crucial role of phosphatase CD45 in determining signaling and proliferation of human myeloma cells. Eur Cytokine Netw. 2007;18(3):120-6.
21. Zhan F, Hardin J, Kordsmeier B, Bumm K, Zheng M, Tian E, et al. Global gene expression profiling of multiple myeloma, monoclonal gammopathy of undetermined significance, and normal bone marrow plasma cells. Blood. 2002;99(5):1745-57. 22. Fabris S, Agnelli L, Mattioli M, Baldini L, Ronchetti D, Morabito F, et al. Characterization of oncogene dysregulation in multiple myeloma by combined FISH and DNA microarray analyses. Genes Chromosomes Cancer. 2005;42(2):117-27. 23. Rebouissou C, Wijdenes J, Autissier P, Tarte K, Costes V, Liautard J, et al. A gp130 interleukin-6 transducer-dependent SCID model of human multiple myeloma. Blood. 1998;91(12):4727-37.
24. Tarte K, Zhang XG, Legouffe E, Hertog C, Mehtali M, Rossi JF, et al. Induced expression of B7-1 on myeloma cells following retroviral gene transfer results in tumor-specific recognition by cytotoxic T cells. J Immunol. 1999;163(1):514-24. 25. Gu ZJ, Vos JD, Rebouissou C, Jourdan M, Zhang XG, Rossi JF, et al. Agonist anti-gp130 transducer monoclonal antibodies are human myeloma cell survival and growth factors. Leukemia. 2000;14(1):188-97.
26. Popp S, Jauch A, Schindler D, Speicher MR, Lengauer C, Donis-Keller H, et al. A strategy for the characterization of minute chromosome rearrangements using multiple color fluorescence in situ hybridization with chromosome-specific DNA libraries and YAC clones. Hum Genet. 1993;92(6):527-32.
27. Goldschmidt H, Sonneveld P, Cremer FW, van der Holt B, Westveer P, Breitkreutz I, et al. Joint HOVON-50/GMMG-HD3 randomized trial on the effect of thalidomide as part of a high-dose therapy regimen and as maintenance treatment for newly diagnosed myeloma patients. Ann Hematol. 2003;82(10):654-9.
28. Barlogie B, Tricot G, Rasmussen E, Anaissie E, van Rhee F, Zangari M, et al. Total therapy 2 without thalidomide in comparison with total therapy 1: role of
intensified induction and posttransplantation consolidation therapies. Blood. 2006;107(7):2633-8.
29. Hose D, Reme T, Meissner T, Moreaux J, Seckinger A, Lewis J, et al.
Inhibition of aurora kinases for tailored risk-adapted treatment of multiple myeloma. Blood. 2009;113(18):4331-40.
30. Moreaux J, Cremer FW, Reme T, Raab M, Mahtouk K, Kaukel P, et al. The level of TACI gene expression in myeloma cells is associated with a signature of microenvironment dependence versus a plasmablastic signature. Blood.
2005;106(3):1021-30.
31. De Vos J, Thykjaer T, Tarte K, Ensslen M, Raynaud P, Requirand G, et al. Comparison of gene expression profiling between malignant and normal plasma cells with oligonucleotide arrays. Oncogene. 2002;21(44):6848-57.
32. Santra M, Zhan F, Tian E, Barlogie B, Shaughnessy J, Jr. A subset of multiple myeloma harboring the t(4;14)(p16;q32) translocation lacks FGFR3 expression but maintains an IGH/MMSET fusion transcript. Blood. 2003;101(6):2374-6.
33. Reme T, Hose D, De Vos J, Vassal A, Poulain PO, Pantesco V, et al. A new method for class prediction based on signed-rank algorithms applied to Affymetrix microarray experiments. BMC bioinformatics. 2008;9:16.
34. Assou S, Le Carrour T, Tondeur S, Strom S, Gabelle A, Marty S, et al. A meta-analysis of human embryonic stem cells transcriptome integrated into a web-based expression atlas. Stem Cells. 2007;25(4):961-73.
35. Cui X, Churchill GA. Statistical tests for differential expression in cDNA microarray experiments. Genome Biol. 2003;4(4):210.
36. Descamps G, Gomez-Bougie P, Venot C, Moreau P, Bataille R, Amiot M. A humanised anti-IGF-1R monoclonal antibody (AVE1642) enhances Bortezomib-induced apoptosis in myeloma cells lacking CD45. Br J Cancer. 2009;100(2):366-9. 37. Mahmoud MS, Ishikawa H, Fujii R, Kawano MM. Induction of CD45
expression and proliferation in U-266 myeloma cell line by interleukin-6. Blood. 1998;92(10):3887-97.
38. Yasukawa H, Ohishi M, Mori H, Murakami M, Chinen T, Aki D, et al. IL-6 induces an anti-inflammatory response in the absence of SOCS3 in macrophages. Nat Immunol. 2003;4(6):551-6.
39. Tsuyama N, Danjoh I, Otsuyama K, Obata M, Tahara H, Ohta T, et al. IL-6-induced Bcl6 variant 2 supports IL-6-dependent myeloma cell proliferation and survival through STAT3. Biochem Biophys Res Commun. 2005;337(1):201-8. 40. Annunziata CM, Davis RE, Demchenko Y, Bellamy W, Gabrea A, Zhan F, et al. Frequent engagement of the classical and alternative NF-kappaB pathways by diverse genetic abnormalities in multiple myeloma. Cancer Cell. 2007;12(2):115-30. 41. Demchenko YN, Glebov OK, Zingone A, Keats JJ, Bergsagel PL, Kuehl WM. Classical and/or alternative NF{kappa}B pathway activation in multiple myeloma. Blood. 2010;115(17):3541-52.
42. Pichiorri F, Suh SS, Rocci A, De Luca L, Taccioli C, Santhanam R, et al. Downregulation of p53-inducible microRNAs 192, 194, and 215 impairs the p53/MDM2 autoregulatory loop in multiple myeloma development. Cancer Cell. 2010;18(4):367-81.
43. Zhou Y, Barlogie B, Shaughnessy JD, Jr. The molecular characterization and clinical management of multiple myeloma in the post-genome era. Leukemia.
2009;23(11):1941-56.
44. Liu S, Otsuyama K, Ma Z, Abroun S, Shamsasenjan K, Amin J, et al. Induction of multilineage markers in human myeloma cells and their down-regulation by
interleukin 6. Int J Hematol. 2007;85(1):49-58.
45. Moreaux J, Sprynski AC, Dillon SR, Mahtouk K, Jourdan M, Ythier A, et al. APRIL and TACI interact with syndecan-1 on the surface of multiple myeloma cells to form an essential survival loop. Eur J Haematol. 2009;83(2):119-29.
46. De Vos J, Hose D, Reme T, Tarte K, Moreaux J, Mahtouk K, et al. Microarray-based understanding of normal and malignant plasma cells. Immunol Rev.
2006;210:86-104.
47. Menoret E, Maiga S, Descamps G, Pellat-Deceunynck C, Fraslon C, Cappellano M, et al. IL-21 stimulates human myeloma cell growth through an autocrine IGF-1 loop. J Immunol. 2008;181(10):6837-42.
48. Moreau P, Robillard N, Avet-Loiseau H, Pineau D, Morineau N, Milpied N, et al. Patients with CD45 negative multiple myeloma receiving high-dose therapy have a shorter survival than those with CD45 positive multiple myeloma. Haematologica. 2004;89(5):547-51.
49. Pellat-Deceunynck C. Tumour-associated antigens in multiple myeloma. Br J Haematol. 2003;120(1):3-9.
50. Simpson AJ, Caballero OL, Jungbluth A, Chen YT, Old LJ. Cancer/testis antigens, gametogenesis and cancer. Nat Rev Cancer. 2005;5(8):615-25. 51. Meklat F, Li Z, Wang Z, Zhang Y, Zhang J, Jewell A, et al. Cancer-testis antigens in haematological malignancies. Br J Haematol. 2007;136(6):769-76. 52. Walker BA, Wardell CP, Chiecchio L, Smith EM, Boyd KD, Neri A, et al. Aberrant global methylation patterns affect the molecular pathogenesis and prognosis of multiple myeloma. Blood. 2010.
53. Bataille R, Robillard N, Avet-Loiseau H, Harousseau JL, Moreau P. CD221 (IGF-1R) is aberrantly expressed in multiple myeloma, in relation to disease severity. Haematologica. 2005;90(5):706-7.
54. Anderson KC. Moving disease biology from the lab to the clinic. Cancer. 2003;97(3 Suppl):796-801.
55. Cheung WC, Van Ness B. The bone marrow stromal microenvironment influences myeloma therapeutic response in vitro. Leukemia. 2001;15(2):264-71. 56. Landowski TH, Olashaw NE, Agrawal D, Dalton WS. Cell adhesion-mediated drug resistance (CAM-DR) is associated with activation of NF-kappa B (RelB/p50) in myeloma cells. Oncogene. 2003;22(16):2417-21.
Table 1A Characteristics of the HMCL cohort
HMCL Name
IL-6
dependence1 Origin2 Disease3
Patient
sample4 Gender Isotype
t(14q32 or
22q11 ;) Target genes Ras TP53 CD45
HMCL classification HMCLserum+IL-6
ANBL6 + CO MM PB F l t(14;16) c-Maf wt abn - MF
BCN + MN MM PB F Gk t(14;16) c-Maf wt wt - CD-1
MDN + MN PCL PB M Gk t(11;14) CCND1 mut wt + CD-1
NAN1 + MN MM PE M Ak t(14;16) c-Maf wt abn - CTA/MF
NAN3 + MN MM PE F Ak t(4;14) MMSET mut abn - MS
NAN6 + MN MM PB F Ak t(14;20) MafB wt abn + CTA/MF
SBN + MN PCT PE M Al t(14 ;?) unknown wt wt - CTA/FRZB
XG1 ++ MN MM PB M Ak t(11;14) CCND1 mut abn + CTA/FRZB
XG2 ++ MN MM PE F Gl t(12;14) unknown mut abn + CTA/FRZB
XG3 ++ MN PCL PE F l t(14 ;?) unknown mut wt + CTA/FRZB
XG4 ++ MN MM PB M Gk t(14 ;?) unknown wt abn - CTA/FRZB
XG5 ++ MN MM PB F l t(11;14) CCND1 wt abn - CD-1
XG6 ++ MN MM PB F Gl t(16;22) c-Maf wt wt + CTA/MF
XG7 + MN MM PB F Ak t(4;14) MMSET mut wt +/ MS
XG10 ++ MN PCT AF F Ak t(14 ;?) unknown mut wt + CTA/MF
XG11 ++ MN PCL PB F l t(11;14) CCND1 wt abn + CD-2L
XG12 ++ MN PCL PB F l t(14;16) c-Maf mut wt + CTA/MF
XG13 ++ MN PCL PB M Gl t(14;16) c-Maf wt abn + MF
XG14 ++ MN PCL PB M k t(11;14) CCND1 mut abn + MF
XG16 ++ MN PCL PB M k none none mut abn + CTA/FRZB
XG19 ++ MN PCL PB F Al t(14;16) c-Maf wt wt + CTA/MF XG20 ++ MN PCL PB M l t(4;14) MMSET wt abn - MS XG21 ++ MN MM PE M l t(11;14) CCND1 wt wt + CD-1 XG24 ++ MN PCL PB F Al t(4;14) MMSET/FGFR3 mut wt - MS HMCLserum AMO1 - CO PCT AF F Ak t(12;14) unknown wt wt + CD-2L
JIM3 - CO MM PE F A t(4;14) MMSET/FGFR3 wt abn - MS
JJN3 - CO MM PE F Ak t(14;16) c-Maf mut abn +/- MF
Karpas620 - CO PCL PB F Gk t(11;14) CCND1 mut abn - CD-2L
KMM1 - CO MM SC M l t(6;14) CCND3 mut abn - CD-2L
KMS11 - CO MM PE F Gk t(4;14) MMSET/FGFR3 wt abn - MS
KMS12BM - CO MM BM F NS t(11;14) CCND1 wt abn - CD-2L
KMS12PE - CO MM PE F NS t(11;14) CCND1 wt abn - CD-2L
L363 - CO PCL PE F NS t(20;22) MafB mut abn - CD-2L
LP1 - CO MM PB F Gl t(4;14) MMSET/FGFR3 wt abn - MS
MM1S - CO PCL PB F Al t(14;16) c-Maf mut wt - MF
NCI-H929 - CO MM PE F Ak t(4;14) MMSET/FGFR3 mut wt +/- MS
OPM2 - CO MM PB F Gl t(4;14) MMSET/FGFR3 wt abn - MS
RPMI8226 - CO MM PB M Gl t(14;16) c-Maf mut abn - MF
SKMM2 - CO PCL PB M Gk t(11;14) CCND1 wt abn - CD-1
Table 1B. Characteristics of HMCLsserum+IL6 and HMCLsserum
Characteristics HMCLs HMCLsserum+IL6 HMCLsserum
n % n % n %
40 24 57 16 43
Chromosomal abnormalities
t(4;14) 9 22.5% 4 17% 5 31%
t(14/16)(q32/q23) and other c-MAF/MAFB translocations 12 30% 8 33% 4 25%
t(11;14) 11 27.5% 6 25% 5 31%
t(6;14) 1 2.5% 0 0% 1 6%
t(14;other) 6 15% 5 21% 1 6%
no t(14;) 1 2.5% 1 4% 0 0%
CD45+ expression (including partial expression) 19 47.5% 15 62.5% 4 25%
TP53 abnormalities 26 62% 13 54% 13 81%
Table 2
A. Differential probe set expression between HMCLsserum+IL-6 andHMCLsserum
Affymetrix Probe Set Gene Name/ Probe Set Chromosome Map Position Fold change
Probe sets upregulated in HMCLsserum+IL-6 versusHMCLsserum
203854_at CFI 4q25 29.36 207238_s_at PTPRC 1q31.3 21.56 208451_s_at C4A 6p21.32 16.99 204529_s_at TOX 9q12.1 8.75 235856_at 235856_at 6p21.32 8.24 1559316_at 1559316_at 5p14.3 8.22 219944_at CLIP4 2p23.2 8.11 223220_s_at PARP9 3q21.1 7.73 209109_s_at TSPAN6 Xq22.1 6.84 219667_s_at BANK1 4q24 6.18 203140_at BCL6 3q27.3 5.71 227697_at SOCS3 17q25.3 5.59 220603_s_at MCTP2 15q26.2 5.59 203052_at C2 6p21.32 4.97 232027_at SYNE1 6q25.2 4.89 205903_s_at KCNN3 1q21.3 3.78 225929_s_at RNF213 17q25.3 3.71 206574_s_at PTP4A3 8q24.3 3.47 228461_at SH3RF3 2q13 3.39 225415_at DTX3L 3q21.1 3.35 227792_at ITPRIPL2 16p12.3 2.91 207777_s_at SP140 2q37.1 2.72 238914_at 238914_at 18q21.2 2.55
Probe sets upregulated in HMCLsserum versusHMCLsserum+IL-6
None
List of genes differentially expressed between HMCLsIL-6+serum andHMCLsserum (SAM analysis, 1000 permutations, FDR=0%)
B. Differential probe set expression between Groups CT/MAF and MAF Affymetrix Probe Set Gene Name/ Probe Set Chromosome Map Position Fold change
Probe sets upregulated in CT/MAF HMCLsversus MAFHMCLs
227952_at ZNF595 4p11 219.26 207493_x_at SSX2 Xp11.22-23 209.93 207666_x_at SSX3 SSX3 131.81 206626_x_at SSX1 Xp11.23-p11.22 114.56 242334_at NALP4 19q13.43 113.84 211425_x_at SSX4 SSX3 109.58 220057_at XAGE1 Xp11.22-21 93.45 207281_x_at VCX2 Xp22.32 75.17 216462_at --- Xp11.22-23 64.86 207534_at MAGEB1 Xp21.2 58.41 232010_at FSTL5 4q32.3 56.82 210603_at ARD1B 4q21.21 55.51 209616_s_at CES1 16q13-q22.1 54.56 221690_s_at NALP2 19q13.43 45.36 221185_s_at IQCG 3q29 28.93 1568933_at LOC646627 1q44 27.56 241224_x_at DSCR8 21q22.2 27.54 208528_x_at SSX5 Xp11.22-23 23.69 1559316_at --- 5p14.3 23.53 229349_at LIN28B 6q21 21.72 209550_at NDN 15q11.2 20.76 211737_x_at PTN 7q33-q34 20.50 231131_at FAM133A Xq21.32 20.37 207712_at BAGE 21p11.1 19.35 236840_at C12orf56 12q14.2 16.82 203921_at CHST2 3q23 13.18 204749_at NAP1L3 Xq21.32 11.34 223977_s_at C18orf2 18p11.32 8.29 242276_at --- 18p11.32 8.26 211382_s_at TACC2 10q26.13 8.06 209993_at ABCB1 7q21.12 8.06 241074_at C12orf32 14q32.33 7.24 230959_at --- --- 5.72 1561433_at LOC285103 2q21.1 5.13 1562216_at --- 2p12 4.78 1557765_at LOC340109 5p14.1 4.73 217388_s_at KYNU 2q22.2 4.72 241675_s_at --- 14q12 4.18
206922_at VCY /// VCY1B --- 4.03 239250_at ZNF542 19q13.43 3.71 205656_at PCDH17 13q21.1 2.91
List of genes differentially expressed between CT/MAF and MAF Groups (SAM analysis. 1000 permutations, FDR=0%)
C. Differential probe set expression between Groups CD-2L and CD-1 Affymetrix Probe Set Gene Name/ Probe Set Chromosome Map Position Fold change
Probe sets upregulated CD-1 HMCLsversus CD-2LHMCLs
213293_s_at TRIM22 11p15.4 504.31 1569040_s_at --- 2p11.2 378.00 209524_at HDGFRP3 15q25.2 108.27 206403_at ZNF536 19q12 51.78 1563721_at --- 2p12 39.2 1556183_at --- 2p11.2 38.81 202820_at AHR 7p21.1 38.55 244413_at CLECL1 12p13.1 32.96 219667_s_at BANK1 4q24 29.29 201645_at TNC 9q33.1 26.56 1552943_at GABRG1 4p12 22.99 204998_s_at ATF5 19q13.3 18.95 206584_at LY96 8q21.11 17.72 214428_x_at C4A 6p21.32 14.42 203595_s_at IFIT5 10q23.31 13.77 210997_at HGF 7q21.11 12.25 227279_at TCEAL3 Xq22.2 11.95 205433_at BCHE 3q26.1 11.03 208022_s_at CDC14B 9q22.33 11.00 239045_at ERN1 17q24.2 10.70 232226_at LRRC4C 11p12 10.54 231956_at KIAA1618 17q25.3 10.00 214719_at SLC46A3 13q12.3 9.74 211709_s_at CLEC11A 19q13.33 8.61 220448_at KCNK12 2p16.3 8.16 219892_at TM6SF1 15q25.2 8.13 222272_x_at SCIN 7p21.3 8.00 223721_s_at DNAJC12 10q22.1 7.88 239331_at --- 7q32.3 7.53 205934_at PLCL1 2q33.1 7.20 235201_at FOXP2 7q31.1 7.13 201060_x_at STOM 9q34.1 7.02 236451_at --- 2q24.2 6.92 235308_at ZBTB20 3q13.31 6.68 243963_at SDCCAG8 1q43 6.32 225931_s_at RNF213 17q25.3 6.22 218400_at OAS3 12q24.13 6.19 203641_s_at COBLL1 2q24.3 5.85 238619_at --- 7q32.3 5.85 243278_at --- 11q22.1 5.80 243846_x_at --- 11q22.1 3.80 207057_at SLC16A7 12q14.1 5.73 200628_s_at WARS 14q32.2 5.01 1557987_at LOC641298 16p11/12 4.88 243808_at --- 7q21.2 3.73 204469_at PTPRZ1 7q31.32 3.35 227443_at C9orf150 9p23 3.33 231954_at DKFZP434I0714 4q31.3 3.09
List of genes differentially expressed between CT/CD-1 and CD-1 Groups (SAM analysis, 1000 permutations, FDR<5%)
Figure and Table legends:
Table 1. HMCL cohort
A Characteristics of the HMCL cohort
HMCLs were obtained culturing primary myeloma cells with culture medium supplemented with FCS alone or recombinant IL-6 and FCS as indicated by the laboratory of origin.
1. ++ if growth is strictly dependent on adding exogenous IL-6, + if dependent on adding exogenous IL-6, - if not.
2. Origin of the HMCL, MN Montpellier or Nantes, CO collected
3. Disease at diagnosis: MM multiple myeloma, PCL plasma cell leukemia, PCT plasmacytoma
4. Origin of the sample: AF ascitic fluid, BM bone marrow, PE pleural effusion, PB peripheral blood, SC subcutaneous
SBN, XG3 and XG4 have a not recurrent translocation of the 14q32 locus, XG16 has a wild-type 14q32 locus
Target genes: target genes of the translocation
Ras: mutation (codons 12 or 13 or 61) of N or K-Ras, see details in supplementary Table S2
TP53: abn abnormal (point mutations, deletion, insertion), abn$ lack of mRNA expression, see details in supplementary Table S2
Phenotype was analyzed by flow cytometry (see Supplementary Table S1) B Compared frequencies of chromosomal abnormalities, CD45 expression, TP53 abnormalities and Ras mutations in HMCLsserum+IL6 and HMCLsserum
Figure 1. Hierarchical clustering of the 40 HMCLs using the 248 HMCL heterogeneity genes.
A. The 248 genes were identified using SAM multiclass supervised analysis of the 6 molecular groups identified in Figure 1 (1000 permutations, P $ .05). Red and green indicate overexpressed and underexpressed genes, respectively. The expression of some genes is indicated on the right of the dendrogram. HMCLs were clustered into 2 major clusters. One cluster is split into 2 clusters and 4 groups named CTA/MF, CTA/FRZB, CD-1 and CD-2L. The other one is split into 2 groups termed as MF and MS. Name of groups was chosen by analogy with the ACRC molecular classification(8).
B. The Affymetrix signal for each gene is proportional to the height of each bar (representing a single HMCL). Note that spiked expression of CCND1, MAF and
MAFB, and FGFR3 and MMSET is strongly correlated with specific subgroup
designations.
Figure 2. Unsupervised clustering of the gene expression profiling of primary myeloma cells of newly-diagnosed patients using the 248 HMCL heterogeneity genes.
The Affymetrix gene expression profiles of purified myeloma cells from 345 newly-diagnosed patients were publicly available from the ACRC (Gene Expression Profile of Multiple Myeloma, accession number GSE2658. http://www.ncbi.nlm.nih.gov/geo/). An unsupervised clustering of the 345 samples (columns) using the 248 HMCL heterogeneity genes (lines) makes it possible to cluster samples into 6 major groups defined by the different grey color scale horizontal histograms and arrows. The percentages above the horizontal histograms indicate the overlap of this clustering with the previously published ACRC 7 molecular group classification(8).
Figure 3. Kaplan-Meier estimates of event-free survival (A) and overall survival (B) of patients with absent (green) or present (red) Affymetrix call for CLEC11A, LRP12, TEAD1, MMSET, FGFR3, NUDT11 and KIAA1671 in the HM cohort (206 patients) and the ACRC-TT2 cohort (345 patients).
Figure 4. Seven-gene prognostic score.
A. Distribution of the patients from the HM and ACRC-TT2 cohorts according to the 7-gene HMCL score. B. Kaplan-Meier estimates of overall survival and event-free survival (C) of low risk patients (blue), intermediate risk patients (green) and high risk patients (red) according to our 7-gene HMCL score.
Figure 5. Kaplan-Meier estimates of overall survival and event-free survival of patients without t(4;14) according to a 6-HMCLgene score in the HM (A) or ACRC-TT2 cohort (B).
!"#$% !"#&% !"#'(% !"#'% !"#)% *+,% -$((% !"#'.% !"#'$% !"#'/% ,0,'% ,0,(% !"#(% +1,% 23,% !"#4% !"#$'% *522$% !"#')% 66,&% !"#'&%0,+7(% 22'*% 892:;$$(% !"#<% !"#$.% !"#$)% ,0,&% ,1:=/$/% 52*''% 79'% 6:2&% >92$% 7&(&% !"#''% 522'% 02>'% 52*'$9?% 52*'$+2% 50890*($.% " 0 " ? @%20 " ? 0@ %* 5 :8@ %, 0 79 % A , B ' . + @%6 0 " $ % 23 5 % C" C8& % A = * 1 ' % 1 1 , 3 ' % + 1 7$ % C8D+ @%* > 1 * & % :B " + < @%20 C% 1 B 0 E2C% 1 B 0 EC8D+ % 1 3 #$ 7% 1 3 #' % 2C% 2* %
!
"#
$
%&
'(
)
'
MAF!
MAFB!
FGFR3!
MMSET!
CCND1!
CCND2!
CCND3!
FRZB!
SSX1!
!"#$%&' !"#$&()*'
!+,-.'
!+,/'
%&'
%0'
Supplementary Table S1. HMCL phenotype. HMCL Name CD19 CD20 CD38 CD45 CD138 HMCLserum+IL-6 ANBL6 0% 0% 100%, r=155 0% 100% r=381 BCN 0% 0% 100%, r=84 0% 100%, r=200 MDN 0% 0% 100%, r=120 100%, r=6 100%, r=239 NAN1 0% 16%, r=12 100%, r=282 0% 100%, r=362 NAN3 0% 0% 100%, r=96 0% 100%, r=399 NAN6 0% 0% 18%, r=10 70%, r=18 100%, r= 272 SBN 0% 0% 100%, r=9 0% 100%,r= 489 XG1 0% 0% 100%, r=169 100% r=20 100% r= 180 XG2 0% 0% 100%, r=108 100% r=5 100% r=515 XG3 0% 0% 100%, r=119 100% r=60 100% r=427 XG4 0% 0% 100%, r=98 0% 100% r=158 XG5 0% 0% 100%, r=55 0% 100% r=5 XG6 0% 0% 0% 100% r=109 100% r=401 XG7 0% 0% 100%, r=154 100% r=2 100% r=100 XG10 0% 0% 100%, r=86 100% r=95 0% XG11 0% 0% 100%, r=53 100% r=30 100% r=53 XG12 0% 0% 100%, r=208 100% r=384 100% r=120 XG13 0% 0% 100%, r=31 100% r=2 100% r=89 XG14 0% 0% 100%, r=89 100% r=5 100% r=71 XG16 0% 0% 100%, r=159 100% r=27 100% r=131 XG19 0% 0% 100%, r=42 100% r=121 100% r=272 XG20 0% 0% 100%, r=81 0% 100% r=243 XG21 0% 0% 100%, r=27 100% r= 28 100% r=306 XG24 0% 0% 100%, r=1050 0% 100% r=281 HMCLserum AMO1 0% 0% 100%, r=37 100%, r=12 100%, r=569 JIM3 0% 0% 100%, r=270 0% 100%, r=174 JJN3 0% 0% 100%, r=32 65%, r=4 100%, r= Karpas620 40%, r=13 50%, r=17 0% 0% 100%, r=300 KMM1 0% 0% 30%, r=12 0% 100%, r=76 KMS11 0% 0% 100%, r=116 0% 100%, r= KMS12BM 0% 0% 100%, r=200 0% 100%, r=49 KMS12PE 0% 0% 100%, r=459 0% 100%, r=142 L363 0% 0% 100%, r=50 0% 100%, r=221 LP1 0% 0% 100%, r=179 0% 100, r=250 MM1S 0% 0% 100%, r=126 0% 100%, r=557 NCI-H929 0% 0% 100%, r=97 18%, r=4 100%, r=150 OPM2 0% 0% 100%, r=30 0% 100%, r=681 RPMI8226 0% 0% 100%, r=200 0% 100%, r=118 SKMM2 0% 0% 100%, r=22 0% 100% r=194 U266 0% 0% 12%, r=16 80%, r=8 100%, r=137
Cells were stained with controlPE or CD19PE, or CD20-PE or CD38PE, or anti-CD45PE or anti-CD138PE then analyzed on FAcsCalibur. Ratio of fluorescence was defined as MFI of specific CD divided by MFI of control staining.
Supplementary Table S2: Ras and TP53 mutations in HMCLs
N, K-ras cd nt Change P53 cd nt Change exon HMCLserum+I
L-6
ANBL-6 wt 331 Q>STOP CAG>TAG 9
BCN wt wt
MDN N13 G>D GGT>GAT wt
NAN1 wt 180 E>STOP GAG>TAG 5
NAN3 N61 Q>H CAA>AAA 248 R>R+Q CGG>CGG+CAG 7
NAN6 wt Deletion exons 7-9
SBN wt wt
XG1 N12 G>R GGT>CGT 126 Y>N TAC>AAC 5 XG2 K12 G>A GGT>GCT 176 C>Y TGC>TAC 5 XG3 N61 Q>L CAA>AAA wt XG4 wt 181 R>R+C CGC>CGC+TGC 5 XG5 wt 282 R>W CGG>TGG 8 XG6 wt wt XG7 K12 G>C GGT>TGT wt XG10 K13 S>S+C GGC>GGC+TGC wt XG11 wt 135 C>Y TGC>TAC 5 XG12 N61 Q>L CAA>AAA wt XG13 wt 248 R>Q CGG>CAG 7
XG14 N61 Q>Q+L CAA>CAA+AAA 266 G>E GGA>GAA 8 XG16 N 61Q>H CAA>CAC 220 Y>C TAT>TGT 6
XG19 wt wt XG20 wt Deletion (exons 7-?) XG21 wt wt XG24 K12 G>G+V GGT>GGT+GTC Wt HMCLserum AMO1 wt wt JIM3 wt 273 R>S CGT>TGT 8 JJN3 N12 G>D GGT>GAT No PCR product
Karpas 620 K12 G>D GGT>GAT 135 C>Y TGC>TAC 5 KMM1 N13 G>D GGT>GAT 135 C>C+F TGC>TGC+TTC 5
KMS11 wt No PCR product
KMS12BM Wt 337 R>L CGC>CTC 10
KMS12PE Wt 337 R>L CGC>CTC 10
L363 N61 Q>H CAA>CAC Insertion intron 7-8
LP1 wt 286 E>K GAA>AAA 8
MM1S K12 G>A GGT>GCT wt NCI-H929 N13 G>D GGT>GAT wt
OPM2 wt 175 R>H CGC>CAC 5
RPMI 8226 K12 G>A GGT>GCT 285 E>K GAG>AAG 8
SKMM2 wt 132 K>N AAG>AAT 5
Supplementary Table S3
A. Differential probe set expression between HMCLsserum+IL-6 andHMCLsserum
Affymetrix Probe Set Gene Name/ Probe Set Chromosome Map Position Fold change
Probe sets upregulated in HMCLsserum+IL-6 versusHMCLsserum
203854_at CFI 4q25 29.36 207238_s_at PTPRC 1q31.3 21.56 208451_s_at C4A 6p21.32 16.99 204529_s_at TOX 9q12.1 8.75 235856_at 235856_at 6p21.32 8.24 1559316_at 1559316_at 5p14.3 8.22 219944_at CLIP4 2p23.2 8.11 223220_s_at PARP9 3q21.1 7.73 209109_s_at TSPAN6 Xq22.1 6.84 219667_s_at BANK1 4q24 6.18 203140_at BCL6 3q27.3 5.71 227697_at SOCS3 17q25.3 5.59 220603_s_at MCTP2 15q26.2 5.59 203052_at C2 6p21.32 4.97 232027_at SYNE1 6q25.2 4.89 205903_s_at KCNN3 1q21.3 3.78 225929_s_at RNF213 17q25.3 3.71 206574_s_at PTP4A3 8q24.3 3.47 228461_at SH3RF3 2q13 3.39 225415_at DTX3L 3q21.1 3.35 227792_at ITPRIPL2 16p12.3 2.91 207777_s_at SP140 2q37.1 2.72 238914_at 238914_at 18q21.2 2.55
Probe sets upregulated in HMCLsserum versusHMCLsserum+IL-6
None
List of genes differentially expressed between HMCLsIL-6+serum andHMCLsserum (SAM analysis, 1000 permutations, FDR=0%)