1 Supplementary data
Figure S1. Gene structure and phylogenetic tree of OsAUX1/LAX family.
(A) Analysis of gene structure of OsAUX1/LAX family. White box represents non-translation area, black box represents exon, and black line represents intron. (B) Analysis of phylogenetic tree of AUX1/LAX family between rice and Arabidopsis thaliana. Use MEGA 5 software to construct phylogenetic tree. Bootstrap test using 1000 repetitions. Os, Oryza sativa; At, Arabidopsis thaliana.
3 Figure S2. Protein structure of OsAUX3.
(A) Similarity analysis of OsAUX1/LAX family protein. Clustalw2 software was used to analyze the similarity of OsAUX1/LAX proteins.
(B) Prediction of transmembrane regions of OsAUX3 protein. The red rectangle represents transmembrane, the blue line represents inside, and the pink line represents outside.
(C) Protein alignment analysis of AUX1/LAX family in the rice and Arabidopsis. The red box indicates the specific amino sequence of OsAUX3 different to the other member.
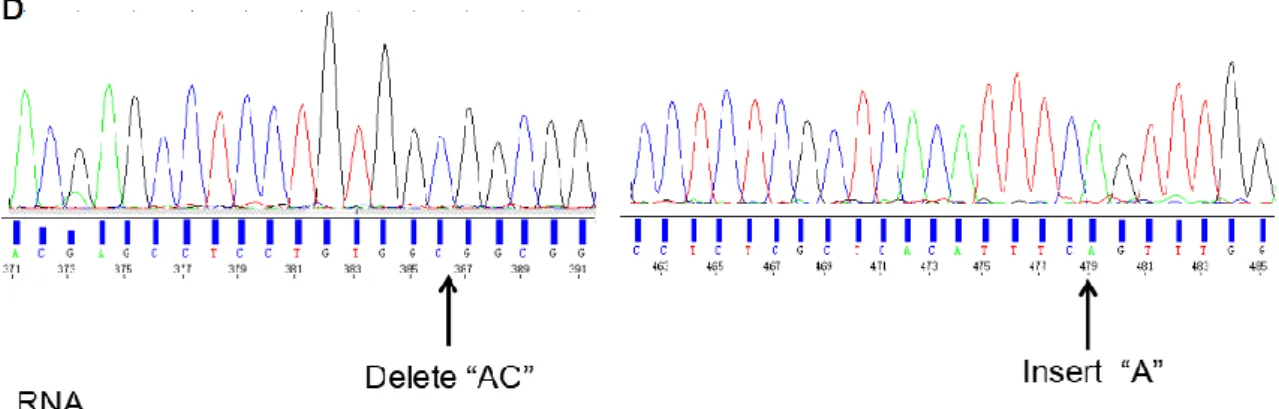
5 Figure S3. Analysis of the targeted mutation of OsAUX3 gene in transgenic rice by CRISPR/CAS9.
(A) Schematic depiction of OsAUX3 locus,black box represents exon. The targeting sites of gRNA3 and gRNA4, and the location of primers (F and R) for genotyping are indicated with blue line and arrow.
(B) Targeting sequences of gRNA3 and gRNA4 are highlighted with red color and gene architecture of PTG3 was drawn with three-line table.
(C) The positions of gene editing in osaux3-1. On DNA sequence, for targeting sequences of gRNA3, one adenine (A) located at 128bp of open reading frame of OsAUX3 was deleted, and for targeting sequences of gRNA4, one A was inserted within 221bp and 222bp, which was shown with black arrow. On protein sequence, the sequence of amino acids was changed in the special peptide sequence of OsAUX3 from 43-75 amino acids.
(D) The positions of gene editing in osaux3-2. On the DNA sequence, for targeting sequences of gRNA3, A and C located 128-129bp of open reading frame of OsAUX3 was deleted, and for targeting sequences of gRNA4, one A was inserted within 221bp and 222bp, which was shown with black arrow. On protein sequence, the open reading frame of OsAUX3 was terminated in advance.
Figure S4: qRT-PCR analysis of OsAUX3 expression
(A) qRT-PCR analysis of OsAUX3 expression. qRT-PCR experiments were analyzed using three independent biological replicas. OsACTIN and OsUBI were used as internal control. ** indicate significant differences compared with WT/HY (P < 0.01) in Student’s t-tests.
(B)Relative mRNA level of OsAUX3 in WT/DJ, osaux3-2 and OsAUX3-overexpress- ion lines. qRT-PCR experiments were analyzed using three independent biological replicas. OsACTIN and OsUBI were used as internal control. Asterisks indicate
significant differences compared with WT/DJ, respectively(**P < 0.01; *P < 0.05;t-
7 Figure S5. Expression pattern of the OsAUX3 gene.
(A-H)The expression pattern of OsAUX3. β-glucuronidase (GUS) staining was examined in ProOsAUX3-GUS transgenic rice seedlings. Primary root (A), stem node (B), stem base (C), stem (D), leaf(E), seed (F), flower(G), glume (H), bar=500μm. (I) Quantitative reverse transcription PCR of OsAUX3 in various tissues. Total RNA was extracted from the root, stem base, stem, mature leaf and panicle of WT/DJ. Experiments were analyzed using three independent biological replicas. OsACTIN and OsUBI were used as internal control. Columns with different letters indicate significant differences (Duncan’s test, p < 0.05).
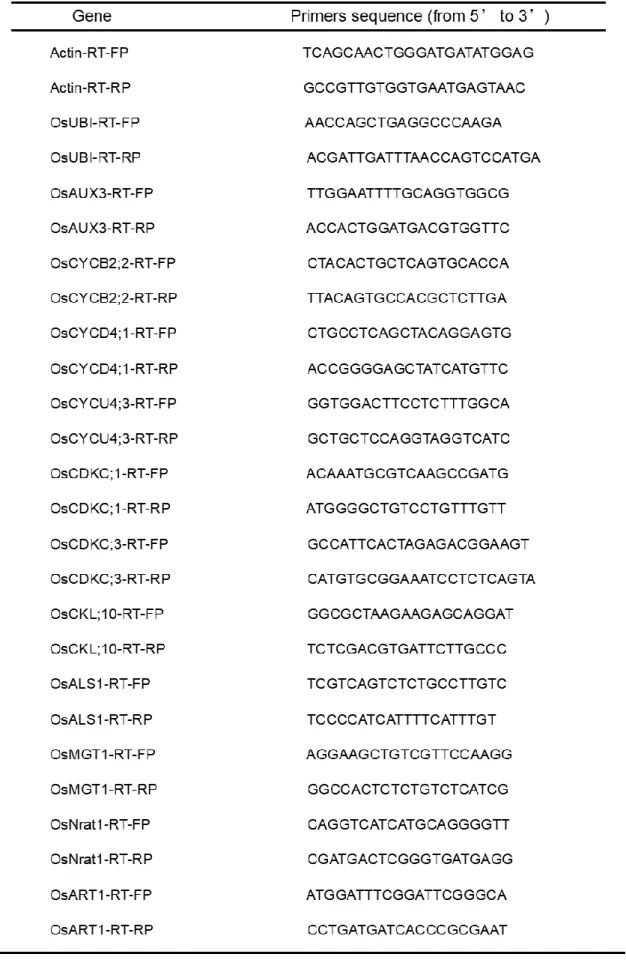
9 Table S2. qRT-PCR Primers used in this study.