HAL Id: hal-00297744
https://hal.archives-ouvertes.fr/hal-00297744
Submitted on 4 May 2005HAL is a multi-disciplinary open access
archive for the deposit and dissemination of sci-entific research documents, whether they are pub-lished or not. The documents may come from teaching and research institutions in France or abroad, or from public or private research centers.
L’archive ouverte pluridisciplinaire HAL, est destinée au dépôt et à la diffusion de documents scientifiques de niveau recherche, publiés ou non, émanant des établissements d’enseignement et de recherche français ou étrangers, des laboratoires publics ou privés.
Nitrous oxide fluxes and nitrogen cycling along a
pasture chronosequence in Central Amazonia, Brazil
B. Wick, E. Veldkamp, W. Z. de Mello, M. Keller, P. Crill
To cite this version:
B. Wick, E. Veldkamp, W. Z. de Mello, M. Keller, P. Crill. Nitrous oxide fluxes and nitrogen cycling along a pasture chronosequence in Central Amazonia, Brazil. Biogeosciences Discussions, European Geosciences Union, 2005, 2 (3), pp.499-535. �hal-00297744�
BGD
2, 499–535, 2005
Nitrous oxide fluxes and nitrogen cycling
B. Wick et al. Title Page Abstract Introduction Conclusions References Tables Figures J I J I Back Close Full Screen / Esc
Print Version Interactive Discussion EGU Biogeosciences Discussions, 2, 499–535, 2005 www.biogeosciences.net/bgd/2/499/ SRef-ID: 1810-6285/bgd/2005-2-499 European Geosciences Union
Biogeosciences Discussions
Biogeosciences Discussions is the access reviewed discussion forum of Biogeosciences
Nitrous oxide fluxes and nitrogen cycling
along a pasture chronosequence in
Central Amazonia, Brazil
B. Wick1, E. Veldkamp2, W. Z. de Mello3, M. Keller4, and P. Crill5
1
Humboldt University Berlin, Department of Soil Science and Site Science, Invalidenstr. 42, D-10115 Berlin, Germany
2
Institute of Soil Science and Forest Nutrition, Georg August University G ¨ottingen, B ¨usgenweg 2, D-37077 G ¨ottingen, Germany
3
Universidade Federal Fluminense, Instituto de Qu´ımica, Departamento de Geoqu´ımica, Centro, Niter ´oi, RJ, Brasil
4
USDA Forest Service, International Institute of Tropical Forestry, Jardin Botanico Sur, 1201 Calle Ceiba, San Juan, PR 00926-1119, USA
5
Department of Geology and Geochemistry, University of Stockholm, 106 91 Stockholm, Sweden
Received: 4 March 2005 – Accepted: 23 March 2005 – Published: 4 May 2005 Correspondence to: B. Wick (barbara.wick@agrar.hu-berlin.de)
BGD
2, 499–535, 2005
Nitrous oxide fluxes and nitrogen cycling
B. Wick et al. Title Page Abstract Introduction Conclusions References Tables Figures J I J I Back Close Full Screen / Esc
Print Version Interactive Discussion
EGU
Abstract
We studied nitrous oxide (N2O) fluxes and soil nitrogen (N) cycling following forest con-version to pasture in the central Amazon near Santar ´em, Par ´a, Brazil. Two undisturbed forest sites and 27 pasture sites of 0.5 to 60 years were sampled once each during wet and dry seasons. In addition to soil-atmosphere fluxes of N2O we measured 27 soil
5
chemical, soil microbiological and soil physical variables.
Soil N2O fluxes were higher in the wet season than in the dry season. Fluxes of N2O from forest soils always exceeded fluxes from pasture soils and showed no consistent trend with pasture age. At our forest sites, nitrate was the dominant form of inorganic N both during wet and dry season. At our pasture sites nitrate generally dominated
10
the inorganic N pools during the wet season and ammonium dominated during the dry season. Net mineralization and nitrification rates displayed large variations. During the dry season net immobilization of N was observed in some pastures. Compared to forest sites, young pasture sites (≤2 years) had low microbial biomass N and protease activities. Protease activity and microbial biomass N peaked in pastures of intermediate
15
age (4 to 8 years) followed by consistently lower values in older pasture (10 to 60 years). The C/N ratio of litter was low at the forest sites (∼25) and rapidly increased with pasture age reaching values of 60–70 at pastures of 15 years and older.
Nitrous oxide emissions at our sites were controlled by C and N availability and soil aeration. Fluxes of N2O were negatively correlated to leaf litter C/N ratio, NH+4-N
20
and the ratio of NO−3-N to the sum of NO−3-N + NH+4-N (indicators of N availability), and methane fluxes and bulk density (indicators of soil aeration status) during the wet season. During the dry season fluxes of N2O were positively correlated to microbial biomass N, β-glucosidase activity, total inorganic N stocks and NH+4-N. In our study region, pastures of all age emitted less N2O than old-growth forests, because of a
25
progressive decline in N availability with pasture age combined with strongly anaerobic conditions in some pastures during the wet season.
BGD
2, 499–535, 2005
Nitrous oxide fluxes and nitrogen cycling
B. Wick et al. Title Page Abstract Introduction Conclusions References Tables Figures J I J I Back Close Full Screen / Esc
Print Version Interactive Discussion
EGU
1. Introduction
Over the past two decades deforestation rates in the Brazilian Legal Amazon have averaged nearly 20 000 km2 per year (Houghton et al., 2000). The majority of the cleared area has been converted into cattle pastures (Nepstad et al., 1997). Clearing of tropical forests for pastures is thought to be an important source of greenhouse
5
gas emissions, such as nitrous oxide (N2O), methane (CH4) and carbon dioxide (CO2) (IPCC, 2001). Studies in tropical America so far have revealed contrasting patterns of N2O fluxes following forest clearing and pasture establishment. Most studies in Amazonia have shown that (-unfertilized-) pastures emit less N2O and NO than old growth forest sites (Goreau and de Mello, 1985, 1988; Verchot et al., 1999; Melillo et
10
al., 2001; Garcia-Montiel et al., 2001). Most exceptions to this general finding were measured either on sites which had been fertilized (Luiz ˜ao et al., 1989; Matson et al., 1990) or were short-term studies measured once during the rainy season (Luiz ˜ao et al., 1989). The only year-round study where elevated N2O fluxes were reported from a pasture was the study by Melillo et al. (2001) who measured elevated N2O fluxes from
15
a newly created pasture in central Rond ˆonia during the first 2 years after establishment. Pastures older than 3 years emitted less N2O than the forest.
Studies outside Amazonia have shown that compared to original forest, elevated N2O and NO fluxes may occur in young pastures (Keller et al., 1993; Veldkamp et al., 1999). Pastures older than 10 years all have low to very low emissions (Keller
20
et al., 1993; Veldkamp et al., 1999; Erickson et al., 2001) unless they are fertilized (Veldkamp et al., 1998; Mosier and Delgado, 1997). Davidson et al. (2000) showed that the wide variations in observed N2O and NO emissions across a range of tropical forest and (-unfertilized-) pasture sites (in Brazil, Costa Rica, and Puerto Rico) were primarily controlled by N availability and soil water conditions. Where N availability
25
was low, N2O fluxes were also always limited. Where N availability was high, N2O fluxes were elevated under high soil moisture conditions. How land use change affects N2O and NO budgets at landscape scale was studied by Plant (2000) and Reiners
BGD
2, 499–535, 2005
Nitrous oxide fluxes and nitrogen cycling
B. Wick et al. Title Page Abstract Introduction Conclusions References Tables Figures J I J I Back Close Full Screen / Esc
Print Version Interactive Discussion
EGU
et al. (2002) for NE Costa Rica. Using data-intensive models they showed that the integrated landscape responses depended on both edaphic factors and management. In the Amazon basin, studies on N2O emissions together with indices of N cycling have been published so far only from Paragominas, eastern Amazonia (Verchot et al., 1999) and from Rond ˆonia in the south-western Brazilian Amazon (Melillo et al., 2001;
5
Garcia-Montiel et al., 2001). A comprehensive study comparing N2O fluxes and indices of C and N cycling in pastures of contrasting age has not yet been published for the central Amazon. But we need this additional research to refine our understanding of the magnitude of the changes and the controls on key biogeochemical processes to develop predictions of the consequences of changes in land cover and land use across
10
the Amazon basin. The objective of the present study was to determine the effects of forest-to-pasture conversion and pasture age (time following deforestation) on soil N cycling and related N2O fluxes near Santar ´em, Par ´a in the central Amazon. In our study we used a space-for-time substitution which is a common approach to study the effects of forest clearing and pasture age on trace gas fluxes (e.g. Keller et al., 1993;
15
Veldkamp et al., 1999; Verchot et al., 1999; Melillo et al., 2001; Garcia-Montiel et al., 2001). Space-for-time replications can be an efficient way to generalize qualitative trends and create hypotheses (Pickett, 1989; Fleming, 1999). The main disadvantages of this method involving forest-to-pasture chronosequences have been discussed by Veldkamp et al. (1999): (1) spatial variability is included in the experimental design
20
and may appear as variability caused by time (see also Pickett, 1989); (2) short-term measurements may not be sufficient to derive a good estimate of a parameter; (3) site history is uncertain, i.e. unrecognized effects in the past of a system may be of large magnitude (Pickett, 1989). Because of these problems, Veldkamp et al. (1999) recommended temporal and spatial replication. In the present study we selected a
25
chronosequence of forest (n=2) and pasture sites of contrasting age (n=27). We sam-pled once during the wet season and once during the dry season at a large number of sites. Our goal was not to provide an accurate estimate of average annual N2O fluxes from these sites but rather to look for changes in N2O flux and N availability (and
BGD
2, 499–535, 2005
Nitrous oxide fluxes and nitrogen cycling
B. Wick et al. Title Page Abstract Introduction Conclusions References Tables Figures J I J I Back Close Full Screen / Esc
Print Version Interactive Discussion
EGU
their relation to one another). The large number of sites in this chronosequence study would, in part, compensate for the limited temporal sampling.
2. Methods
2.1. Site description
The study was conducted near Santar ´em (2◦250S, 54◦470W) in the state of Par ´a, Brazil.
5
The landscape consists of a mosaic of old growth forests, pasture land, agricultural fields and secondary forests. The region has a mean annual temperature of 25◦C and a mean relative humidity of 86%. Annual rainfall is highly variable and averages about 2000 mm with a dry season lasting usually from August to October (Parrotta et al., 1995). The sites we selected for our study were mainly situated on deep,
well-10
drained clayey Oxisols (kaolinitic yellow latosols in the Brazilian classification system, Embrapa, 1999) with some soils transitional to Ultisols (red-yellow podzolic soils in the Brazilian classification system, Embrapa 1999) also present in the region (Silver et al., 2000).
We conducted a regional survey between 50 and 100 km south of Santar ´em at the
15
beginning of the rainy season in 1999/2000 on a chronosequence of pasture sites (n=27) of contrasting ages (between 6 month to 60 years following deforestation). Two undisturbed old-growth forest sites served as reference plots. Pastures younger than 10 years were established by manual clearing during the dry season. On pastures older than 10 years, bulldozers were also used for removal of trees. Typically, isolated
20
valuable and protected tree species, especially Brazil nut trees, were left in the fields. Slashed and dried biomass was partly burned shortly before the onset of the rainy season. On most sites, grass seeds were either sown directly or after one rotation of maize or rice (10 sites). Typical management of the pasture sites consisted of slash-ing of secondary vegetation once per year and burnslash-ing about once every three years
25
BGD
2, 499–535, 2005
Nitrous oxide fluxes and nitrogen cycling
B. Wick et al. Title Page Abstract Introduction Conclusions References Tables Figures J I J I Back Close Full Screen / Esc
Print Version Interactive Discussion
EGU
of pasture grasses over secondary vegetation and enhances the palatability of grasses. Invading accidental fires from adjacent areas are common. No fertilizers were used on any of the pastures. Except for the 6 month and 1 year old pastures, all sites were actively grazed at an average annual rate of about 1 animal ha−1.
Brachiaria brizantha (A. Rich.) Stapf cv. Marandu was the dominant grass species at
5
most sites. Only the 1 year old site was planted with “mombac¸a” (Panicum maximum Jacq.) and the 60 year old pasture site was planted with “quicuio” (Brachiaria
hu-midicola). All pasture sites of our chronosequence study contained woody vegetation
including trees left standing following forest clearing and/or regrowing shrubs. Woody vegetation was more prominent in younger pasture sites where single trees were left
10
standing and residual uncombusted woody debris still remained from the old growth forests.
2.2. N2O and CH4flux measurements
Surface fluxes of N2O and CH4 were assayed once during both wet and dry season using two-part static vented chambers (PVC and ABS plastics) approximately 20 cm
15
high (Keller and Reiners, 1994). At each site 7–8 chamber bases were installed along at randomly selected points along a 50 m long transect. The chamber bases were in-serted into the soil to a depth of 2–3 cm about 5 to 10 min prior to chamber closure. Four 20 ml headspace samples were withdrawn at 10 min intervals over 30 min us-ing nylon syrus-inges fitted with polycarbonate/polypropylene valves. The syrus-inges were
20
transported to the laboratory for analysis by ECD (N2O) and FID (CH4) gas chromatog-raphy within 36 h of sampling. Integrated peak areas for samples were compared to known standards for determination of gas mixing ratio. Fluxes were calculated from the linear change of mixing ratio with time for the brief enclosures. Fluxes of N2O were discarded when the initial sample (1 minute following enclosure) greatly exceeded the
25
ambient mixing ratio of ∼310 ppbv. When fewer than 4 chamber measurements per site were obtained, the entire site was excluded. Zero fluxes (no change in concentration) were included.
BGD
2, 499–535, 2005
Nitrous oxide fluxes and nitrogen cycling
B. Wick et al. Title Page Abstract Introduction Conclusions References Tables Figures J I J I Back Close Full Screen / Esc
Print Version Interactive Discussion
EGU
2.3. Soil sampling and processing
Surface soil (10 cm depth) was sampled once during the rainy season (April–May) and once during the dry season (September–October) of 2000. Soil cores were taken ad-jacent to 4 chambers with a root corer of 7 cm diameter, transferred in sealed plastic bags and transported in Styrofoam coolers to the laboratory the same day. Coarse
5
roots, stones and litter were manually removed from the samples. Bulk density mea-surements (0–5 cm depth) were made using undisturbed soil cores. Subsamples for determination of particle size distribution, pH and exchangeable cations were air-dried, ground and passed through a 2 mm sieve. Air-dried subsamples (taking during the rainy season) for total nitrogen (N) and inorganic phosphorus (Pi) were ground to
10
<150 µm using a ball mill. Field moist subsamples (of both wet and dry season
sam-pling) for enzyme analysis (protease activity), microbial biomass N measurement and inorganic N and N-mineralization determination were passed through a 2 mm sieve and stored at 4◦C until analysis.
2.4. Soil physical and chemical analyses
15
Soil bulk density (BD) was measured using the core method (Anderson and Ingram, 1993). Particle size distribution was analyzed with the pipette method using pyrophos-phate as a dispersing agent (Moschrefi, 1983). Soil pH was determined in a slurry of 10 g soil and 25 ml de-ionized water (Anderson and Ingram, 1993). Gravimetric water content was calculated as the ratio of mass of water to soil dry mass after oven-drying
20
soil at 105◦C for 24 h. Total N was measured with an automated C and N analyzer (Elementaranalysator CNS, Vario EL, elementar, Hanau, Germany) (K ¨onig and Fort-man, 1996). Inorganic P (Pi) was determined by resin extraction (Tiessen and Moir, 1993). Exchangeable calcium (Ca), magnesium (Mg), potassium (K) and aluminum (Al) were extracted by leaching soil samples with 100 ml of unbuffered 1 M ammonium
25
chloride (NH4Cl) for 4–5 h. Cations in the extracts were quantified by atomic absorption spectroscopy (K ¨onig and Fortmann, 1996).
BGD
2, 499–535, 2005
Nitrous oxide fluxes and nitrogen cycling
B. Wick et al. Title Page Abstract Introduction Conclusions References Tables Figures J I J I Back Close Full Screen / Esc
Print Version Interactive Discussion
EGU
Nitrate (NO−3) and ammonium (NH+4) were determined by extracting 10 g of field moist soil with 70 ml of 2 M KCl. The soil-KCl solution was shaken for an hour on a hor-izontal shaker and allowed to settle for 2 h. A 20 ml aliquot of the supernatant was removed with a syringe, filtered through a 0.45 µm polysulfone membrane and stored frozen until analysis (Erickson et al., 2001). Analysis of NH+4 and NO−3 was done on
5
a continuous-flow autoanalyzer (Skalar, Erkelenz, Germany) according to K ¨onig and Fortmann (1996).
Potential net mineralization and net nitrification were measured using the aerobic incubation procedure described by Hart et al. (1994). Two 10 g sub-samples of field moist soil were transferred into 100 ml polyethylene plastic bottles. One set of
sub-10
samples was immediately extracted with 70 ml of 2 M KCl, the other set was covered with perforated parafilm and incubated for 7 days at ambient temperature in the dark before extraction. Ammonium and NO−3 were analyzed as described above. Net min-eralization and nitrification rates were calculated from the difference between inorganic N at the beginning and end of the incubation, and results were expressed as µg N
15
released per g of dry soil over 7 days. 2.5. Soil microbiological assays
Protease activity (N-benzoyl-L-argininamide hydrolysis) of the soil was determined ac-cording to Bonmati et al. (1998). The released NH+4 was measured according to the procedure of Kandeler and Gerber (1988). Results of activity are expressed as µg NH+4
20
released per g of dry soil per hour.
Beta-glucosidase activity in the soil was measured according to Eivazi and Tabatabai (1988). Toluene was not included in the procedure. Results of enzyme activity is expressed as micrograms p-nitrophenol (PNP) released per g of dry soil per hour and are averages of triplicate assays.
25
Microbial biomass N was analyzed by the chloroform-fumigation-extraction method of Vance et al. (1987). Soil was adjusted to 30% water holding capacity (WHC) prior to fumigation and extraction. Total organic N of the K2SO4-extracts was oxidized to
BGD
2, 499–535, 2005
Nitrous oxide fluxes and nitrogen cycling
B. Wick et al. Title Page Abstract Introduction Conclusions References Tables Figures J I J I Back Close Full Screen / Esc
Print Version Interactive Discussion
EGU
NO−3 by UV and persulphate digestion, and the released NO−3 was measured on a continuous flow autoanalyzer (Skalar, Erkelenz, Germany) (K ¨onig and Fortman, 1996). Microbial biomass N was calculated by subtracting extractable N in the unfumigated sample from extractable N in the fumigated sample (Vance et al., 1987) divided by the KENfactor of 0.54 (Brookes et al., 1985).
5
2.6. Plant sampling and analysis
Wet and dry season standing grass biomass and grass litter at each pasture site was sampled from 2 points along the transect using a 1 m2 frame. Subsamples were dried at 65◦C and ground to <150 µm on a ballmill. Total C and N were measured with an automated C and N analyzer (Elementaranalysator CNS, Vario EL, elementar, Hanau,
10
Germany) (K ¨onig and Fortman, 1996). For comparison to pasture biomass, we used data of forest floor litter stocks including data from Silver et al. (2000).
2.7. Statistical analyses
Fluxes of N2O and soil variables (log transformed where necessary) were compared using analysis of variance separately for wet and dry seasons with three pasture age
15
classes. Pasture sites were clustered in young (0 to 2 years, n=8), intermediate (4 to 8 years, n=9) and old age classes (>10 years, n=10). The Tukey-Kramer test at the 95% confidence level was used for post-hoc comparison of class means to account for unequal sample sizes.
The relationship between N2O fluxes and the various soil parameters were evaluated
20
using the linear regression procedures from SYSTAT version 10.2 (SYSTAT, 2002). Number of sites were n=2 for old growth forests, n=3 for 6 month old pastures, n=1 for 1 year old pasture, n=4 for 2 year old pastures, n=2 for 5 year old pastures, n=3 for 6 year old pastures, n=2 for 8 year old pastures, n=4 for 10 year old pasture, n=1 for 12 year old pasture, n=2 for 15 year old pasture, and n=1 for each 20, 25 and 60 year old
25
BGD
2, 499–535, 2005
Nitrous oxide fluxes and nitrogen cycling
B. Wick et al. Title Page Abstract Introduction Conclusions References Tables Figures J I J I Back Close Full Screen / Esc
Print Version Interactive Discussion
EGU
3. Results
3.1. General soil characteristics of the forest and pasture sites
All sites of our chronosequence study had a clayey to very clayey texture according to the Brazilian classification system (Embrapa, 1999). Clay content varied between 36 and 78% in the top 10 cm of all sites except for one forest site which had a clay content
5
of 25% (Table 1). Soil bulk density (BD) was below 1 Mg m−3 at the old growth forest and 6 month old pasture site and increased with pasture age to about 1.2 Mg m−3 in the 15 to 25 year old pastures.
Total N of forest and pasture soils up to 8 years old was generally between 2.1 and 2.6 g N kg−1 soil (Table 1) and was lower in pastures older than 10 years associated
10
with the higher sand content in older pastures (Table 1).
Soil pH in the forests was 3.9 and between 4.0 and 5.6 in the pasture soils. Forest clearing, burning and pasture establishment increased soil pH and concomitantly de-creased available Al at all pasture sites. Concentrations of basic cations Ca (Table 1) and Mg and K (data not shown) increased considerably after deforestation and pasture
15
establishment. Calcium concentrations remained elevated in the pasture sites for up to 12 years after deforestation relative to the forest sites and declined consistently in pastures older than 15 years. Inorganic phosphorous (Pi) was highest in the old growth forest soils and the young pastures of 6 months and 1 year. With increasing pasture age Pi decreased steadily.
20
3.2. Fluxes of N2O and CH4from forest and pasture soils
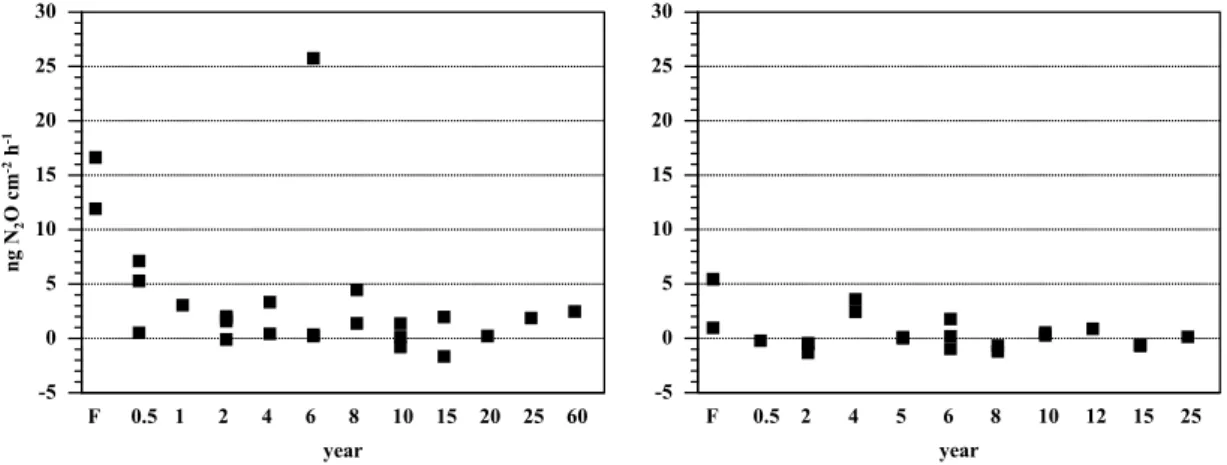
Six months following forest clearing and pasture establishment N2O fluxes were 67% lower compared to the primary forests (Fig. 1). Fluxes of N2O were higher during the wet than during the dry season and showed no consistent trend with pasture age. During the wet season, pasture sites generally had lower fluxes than forest sites except
25
BGD
2, 499–535, 2005
Nitrous oxide fluxes and nitrogen cycling
B. Wick et al. Title Page Abstract Introduction Conclusions References Tables Figures J I J I Back Close Full Screen / Esc
Print Version Interactive Discussion
EGU
50%. During the dry season emissions of N2O from pasture sites were significantly lower than from forest soils and some pasture soils showed slight net uptake of N2O. Nitrous oxide emissions of the 4 year old pasture sites were comparable to fluxes from the forest sites. Fluxes of N2O from young, intermediate and old pasture classes were not significantly different from one other.
5
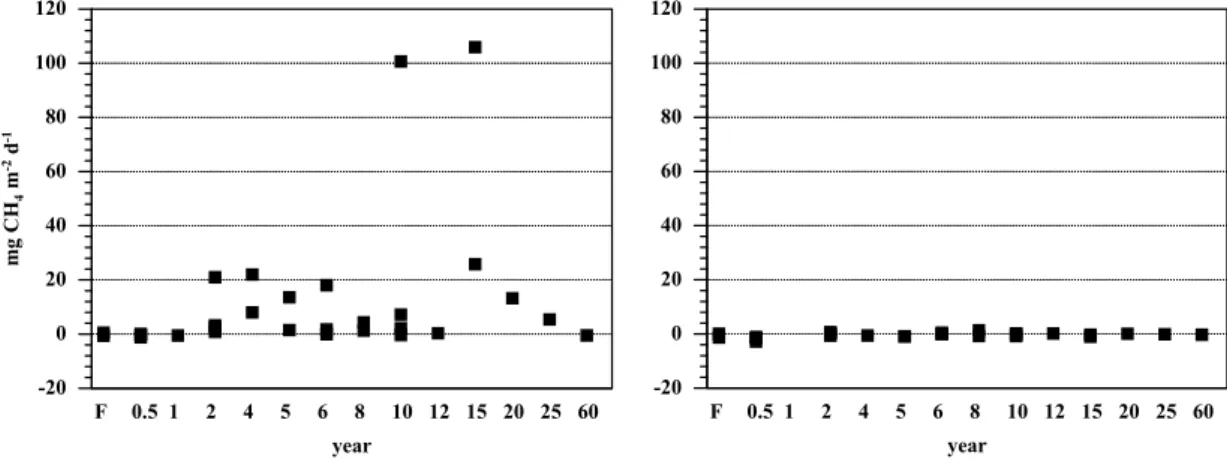
Forest soils consumed CH4during both wet season and dry season at similar rates (Fig. 2). During the wet season young pastures up to one year generally consumed CH4 whereas most pastures older than 1 year emitted CH4to the atmosphere. Emis-sions of CH4were not significantly different among young, intermediate and old pasture age classes. During the dry season forest and most pastures soils consumed CH4but
10
no clear trend with pasture age was observed. The uptake rates were similar between pastures and the old growth forest. We found no significant relationships between CH4 fluxes and indices of N cycling or inorganic N stocks or between CH4 fluxes and soil moisture, BD or soil chemical characteristics.
3.3. Nitrogen cycling and turnover in forest and pasture soils
15
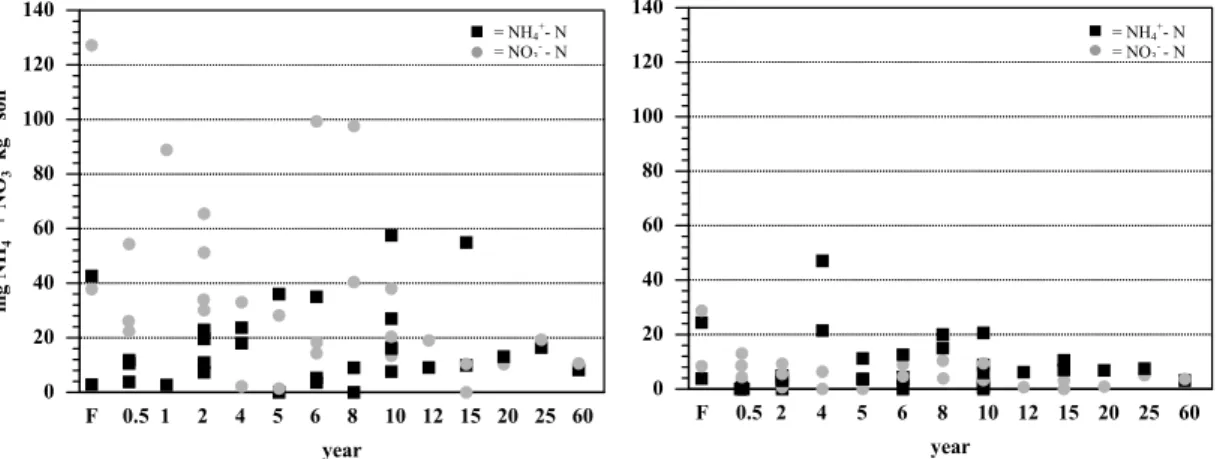
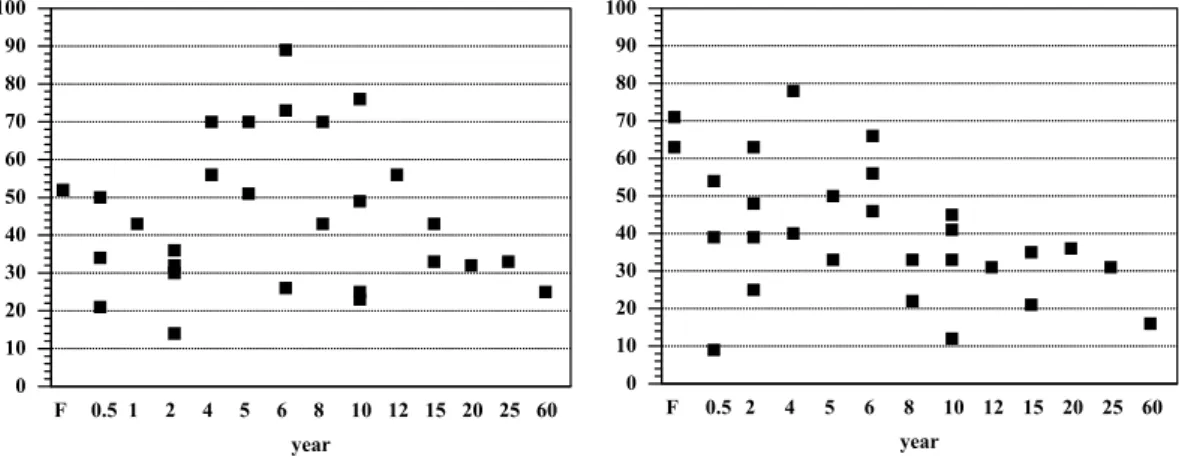
Total inorganic N-pools (NO−3-N and NH+4-N) were greater during the wet than during the dry season and showed no consistent trend with pasture age (Fig. 3). Nitrate was the dominant form of inorganic N at our old growth forest sites during both wet and dry season. At the pasture sites NO−3-N generally dominated the inorganic N pools during the wet season whereas NH+4-N was the dominant form of inorganic N in the
pas-20
ture soils during the dry season. Extractable NH+4-N did not differ significantly among forest and pasture classes during either wet or dry season. During the wet season, extractable NO−3-N concentrations in young pastures of 0–2 years were similar to the forest sites. Pastures older than 4 years had significantly lower extractable NO−3-N compared to the forest sites. No significant differences among the pasture classes was
25
found. During the dry season, forest NO−3-N concentrations were significantly higher than in pasture soils. No statistically significant differences of NO−3-N concentrations
BGD
2, 499–535, 2005
Nitrous oxide fluxes and nitrogen cycling
B. Wick et al. Title Page Abstract Introduction Conclusions References Tables Figures J I J I Back Close Full Screen / Esc
Print Version Interactive Discussion
EGU
were found among the pasture classes.
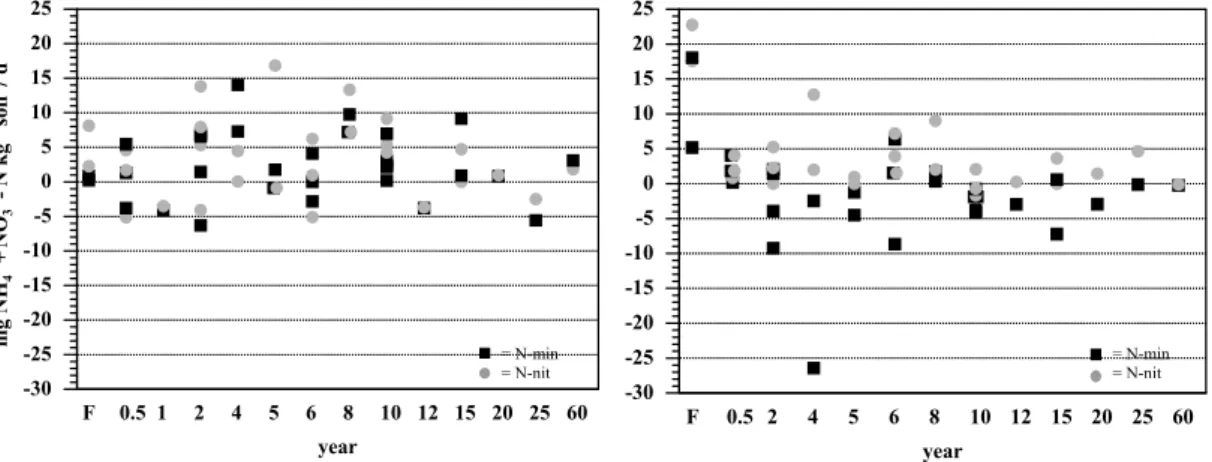
Potential net N-mineralization and net nitrification rates were generally higher dur-ing the wet season than durdur-ing the dry season (Fig. 4). At the forest sites nitrification rates were higher than N-mineralization rates during both wet and dry season. During the dry season, most pastures older than 1 year showed net immobilization and
nitri-5
fication exceeded N-mineralization. During the wet season no statistically significant differences in potential N mineralization and nitrification rates were found among forest and pasture classes. During the dry season, forest sites had significantly higher N min-eralization and nitrification rates than the pasture classes which, in turn, did not differ significantly from one another.
10
Microbial biomass N during the wet season (Fig. 5) was significantly higher in the 4 to 8 year-old pasture class as compared to the young pasture class (0 to 2 years). How-ever, there were no statistically significant differences among other sampled classes. During the dry season, the microbial biomass N in the forest soils was similar to the intermediate pasture age class of 4 to 8 years whereas both young and old pasture age
15
classes had significantly lower microbial biomass N than the forest sites. No significant differences were found among the pasture age classes.
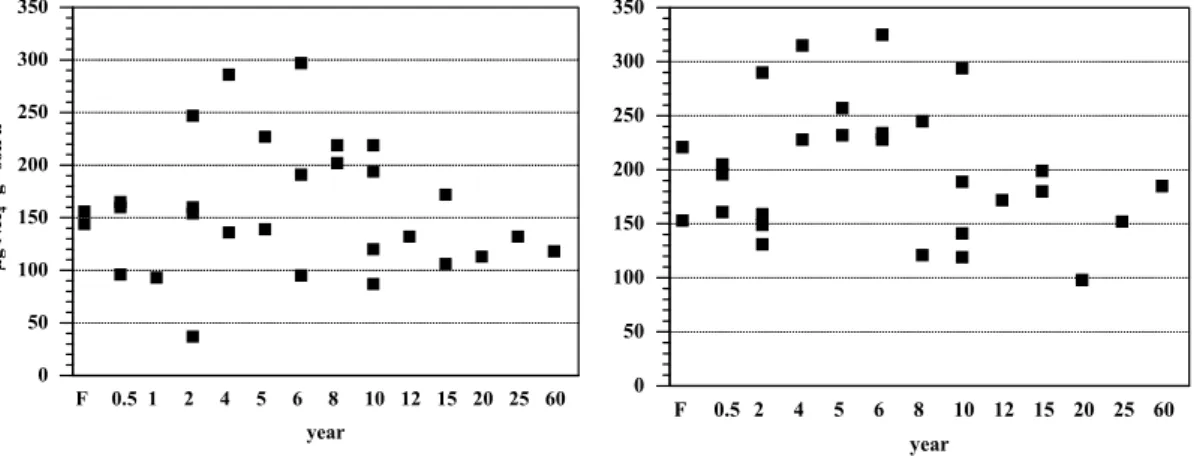
The protease activity in forest and pasture sites was lower during the wet than during the dry season (Fig. 6). No statistically significant differences were found among forest and pasture classes during either the wet or dry season.
20
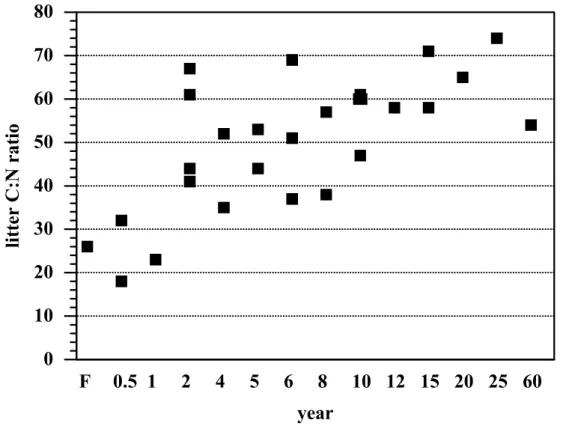
The C/N ratio of litter was low at the forest sites and increased with pasture age up to 10 years (Fig. 7). No clear trend was found in pastures older than 10 years. The C/N ratio increased consistently from about 25 in both the 6 month and 1 year old sites to about 70 in the 15 to 25 year old sites. The forest litter C/N ratio was similar to young pasture sites (0–2 years) whereas pastures older than 4 years had significantly
25
higher C/N ratios than the forest sites. The young pasture age class had significantly lower C/N ratios than the old pasture age class. The increase of the C/N ratio with pasture age was accompanied by a decrease in overall pasture productivity and site degradation as was reflected by sparse soil cover. Total aboveground grass biomass
BGD
2, 499–535, 2005
Nitrous oxide fluxes and nitrogen cycling
B. Wick et al. Title Page Abstract Introduction Conclusions References Tables Figures J I J I Back Close Full Screen / Esc
Print Version Interactive Discussion
EGU
decreased from about 10 t ha−1 in the 1 to 10 year old pasture sites to about 5 t ha−1 on average in pastures older than 10 years (data not shown).
4. Discussion
4.1. Changes of N transformation along the forest-to-pasture chronosequence
The pasture chronosequence showed a strong decline in most measures of N cycling
5
with time following deforestation. The dominance of nitrate over ammonium pools in our forest soils is consistent with results by Matson et al. (1990) and Neill et al. (1995) for humid tropical forest ecosystems in the central and western Brazilian Amazon. While recognizing that nitrate pool sizes as such do not give information on N transformation rates, nitrate accumulation has been interpreted as an indication of an open soil N cycle
10
(Vitousek et al., 1982). This interpretation was supported by results of our aerobic incubations. In our forest soils, net nitrification exceeded net N-mineralization which indicates the potential for N losses by gaseous emission or leaching (e.g. Vitousek and Sanford, 1986; Matson and Vitousek, 1987). In the pastures of our chronosequence, the internal soil N cycle drastically changed compared to the forest sites. While young
15
pastures still display dominance of nitrate over ammonium in the wet season, the clear drop of nitrate concentrations in the older pastures and the dominance of ammonium in the dry season indicate that the internal N cycle of these pastures is more closed. This is supported by low mineralization and nitrification rates, both of which even became negative (net immobilization, Fig. 4) in a considerable number of pastures.
20
Increasing N limitation with pasture age was reflected in the decrease in litter quality of Brachiaria brizantha with age (Fig. 7), a trend that has also been observed in old pastures in other studies (Castilla and Jackson, 1996; Fernandes et al., 2002). A pattern of increased N limitation with increasing pasture age has also been observed in forest-to-pasture chronosequence studies in Rond ˆonia (Neill et al., 1995, 1999) and
25
BGD
2, 499–535, 2005
Nitrous oxide fluxes and nitrogen cycling
B. Wick et al. Title Page Abstract Introduction Conclusions References Tables Figures J I J I Back Close Full Screen / Esc
Print Version Interactive Discussion
EGU
probably caused by a combination of early loss of nitrogen through gaseous emissions and leaching, reduced inputs of nitrogen (e.g. by N fixation) and the immobilization of N by grass litter and roots with a high C-to-N ratio. Brachiaria brizantha deposits large quantities of litter and decaying roots of very low N content of 0.5 to 1% (Boddey et al., 1996). Furthermore in pastures, the microbial biomass gradually reworks soil organic
5
matter (SOM) to more recalcitrant forms that cycle N more slowly as compared with SOM in the original forest (Neill et al., 1999).
The strong decline of microbial biomass N following deforestation that we observed has also been reported for young pasture sites near Manaus, in the central Amazon (Luiz ˜ao et al., 1992). Apart from the direct lethal effects of heat, the effect of burning
10
probably limited microbial growth for some time after felling and burning due to changes in substrate availability (Raison, 1979; Kauffman et al., 1995). Slash burning in Amazo-nian forests is accompanied by a temporary input of low quality, high C/N debris to soils (Kauffman et al., 1995). The peak of microbial biomass N in the 4 to 6 year old pasture sites (wet season) with a high aboveground biomass production is probably related to
15
the large (-above-) and sub-surface inputs of organic material from shoots, roots, and root residues returning labile C and nutrients to the soil as was found in other studies in Brazil (Boddey et al., 1996; Neill et al., 1999). The aboveground biomass in the intermediate pasture age classes was 12 t ha−1compared to 8 t ha−1in both the young and old pasture sites. The steady decline of the microbial biomass in the pastures of 8
20
years and older may be a result of pasture degradation caused by the combined effects of reduced nutrient stocks, lower plant biomass and related lower organic matter return with a higher C/N ratio.
Extracellular proteases are involved in the mineralization of organic N compounds to amino acids and subsequent ammonification from amino acids to ammonia and CO2
25
(Loll and Bollag, 1983; Kalisz, 1988). In our chronosequence study we observed a close correlation between microbial biomass N and protease activity (r=0.71, p>0.001, n=28). The observed pattern of protease activity was probably also related to changes in substrate quality. As soil proteases are limited by available substrate concentrations
BGD
2, 499–535, 2005
Nitrous oxide fluxes and nitrogen cycling
B. Wick et al. Title Page Abstract Introduction Conclusions References Tables Figures J I J I Back Close Full Screen / Esc
Print Version Interactive Discussion
EGU
(Tateno, 1988), high activity in intermediate pastures and decreasing activities in older pasture sites was likely due to changes in availability of nitrogen containing organic compounds as pastures aged. In older pastures with a high litter C/N ratio N is rapidly immobilized by the microbial biomass and, after turnover of the microbial population, may be sequestered into the recalcitrant humic soil pool over time (Hall and Matson,
5
2003).
4.2. Factors controlling N2O fluxes from forest and pasture sites
Although we sampled N2O fluxes only twice, our measured N2O fluxes correlated with several indices of N cycling, suggesting that N availability exerted an important con-trol on N2O fluxes. As was found by Erickson et al. (2001, 2002) and Davidson et
10
al. (2000), N2O fluxes in our study were negatively correlated with the litter quality of the forest and pasture biomass (Fig. 8a). The C/N ratio of litter has been proposed as reasonable proxy for N availability in ecosystems (Davidson et al., 2000) and is an important determining factor whether N is mineralized or immobilized. Litter high in N is associated with fast rates of decomposition and rapid soil N turnover which, in turn,
15
may result in increased emissions of N2O (Erickson et al., 2001, 2002).
The positive correlation with the ratio of NO−3-N to the sum of NH+4-N and NO−3-N which we observed during the wet season (Fig. 8b) and the positive correlation be-tween fluxes of N2O and the sum of NH+4-N and NO−3-N during the dry season (Fig. 8c) fit the conceptual model of Firestone and Davidson (1989), Davidson et al. (2000) and
20
Davidson and Verchot (2000). In this model, commonly called “Hole-in-the-Pipe”, the first level of control on N2O fluxes is the rate of nitrogen cycling through ecosystems. The contribution from nitrification (biological oxidation of NH+4) to N2O production can be significant at certain sites (Firestone and Davidson, 1989; Hall and Matson, 2003).
Although we found no correlation of N2O fluxes with WFPS, we think that soil
aer-25
ation content played an important role in some of the observed N2O emissions. Neg-ative correlations were found between N2O fluxes and CH4 emissions (Fig. 8d) in the wet season. Furthermore, chambers in which we measured the highest methane
emis-BGD
2, 499–535, 2005
Nitrous oxide fluxes and nitrogen cycling
B. Wick et al. Title Page Abstract Introduction Conclusions References Tables Figures J I J I Back Close Full Screen / Esc
Print Version Interactive Discussion
EGU
sions often corresponded with low or even negative N2O emissions (results not shown). These results correspond to findings by Keller et al. (1986) and suggest that at least in some pastures strongly anaerobic conditions prevailed during the wet season, which may have led to reduction of N2O to N2. Apart from the reduced N availability in older pastures this may have been an additional cause for the observed low (and sometimes
5
negative) N2O fluxes.
An additional control on N2O emissions may have been easily available carbon as was illustrated by the correlation of N2O emission with β-glucosidase activity in the dry season (Fig. 8f). Beta-glucosidase plays a key role in the decomposition of carbo-hydrates in soils (Shewale, 1982), and the products of β-glucosidase activity are
be-10
lieved to be an important substrate for microbial metabolism. Especially heterotrophic nitrifying and denitrifying bacteria (which can both produce N2O) require an organic form of carbon as energy source and may depend on β-glucosidase activity for their carbon supply. The importance of available carbon for N2O production has been dis-cussed before (Groffman, 1991) and positive correlations between N2O emissions and
15
β-glucosidase activities have also been established for temperate wetland soils
(Free-man et al., 1997; Kang et al., 1998).
4.3. Regional comparison of N2O-fluxes in the Amazon basin
Forest clearing can result in a pulse of available soil N and may cause transient in-creases in N2O emissions (Keller et al., 1993; Melillo et al., 2001). The magnitude
20
and duration of N2O emissions following deforestation and pasture establishment dif-fers among the central and eastern Brazilian Amazon on one hand and the western Brazilian Amazon on the other hand. Our results from 2 forest sites and 27 pasture sites in the central Amazon agree with other studies conducted in the central and east-ern Amazon (Goreau and de Mello, 1985, 1988; Verchot et al., 1999); N2O fluxes from
25
forest soils were relatively high and N2O fluxes from pasture soils were always lower. The dominance of nitrate over ammonium and the dominance of nitrification over N-mineralization during the wet season (Figs. 2 and 3) may indicate that in pastures
BGD
2, 499–535, 2005
Nitrous oxide fluxes and nitrogen cycling
B. Wick et al. Title Page Abstract Introduction Conclusions References Tables Figures J I J I Back Close Full Screen / Esc
Print Version Interactive Discussion
EGU
younger than 10 years there is some potential for higher N2O emissions. However, we only measured high N2O fluxes on one 6 year old pasture site.
Our results agree also with observations from Rond ˆonia, western Amazon for pas-tures older than 3 years (Garcia-Montiel et al., 2001) but do not agree with higher emis-sions from young pastures up to 2–3 years relative to forest (Melillo et al., 2001). The
5
temporary increases of N2O in Rond ˆonia immediately following forest clearing may be explained by different soil conditions. In contrast to the clay-textured Oxisols in central and eastern Amazon, soils in Rond ˆonia are coarser textured Ultisols. This difference in texture may lead to rapid SOM turnover and N-mineralization rates in Rond ˆonia (Desjardins et al., 1994; Moraes et al., 1996; Neill et al., 1999), whereas in the
east-10
ern Amazon, the higher clay content may protect SOM against rapid mineralization (Koutika et al., 1997). Furthermore, the variation in soil mineralogy on P availability likely contributed to the differences in pasture productivity and N cycling across the Amazon basin (see Davidson et al., 2004). The phosphorus status of pastures on Ul-tisols in Rond ˆonia is better (see Garcia-Montiel et al., 2000) than the pastures in this
15
study (Table 1) or a nearby study on forest-to pasture chronosequences (Asner et al., 2004), and in the Paragominas region, eastern Amazon (see Verchot et al., 1999). The better P status at the Rond ˆonian sites may have led to higher pasture productivity and hence, the potential of increased levels of SOM and N-mineralization. In contrast to Rond ˆonia, studies in Paragominas (Trumbore et al., 1995) and central Amazonia
20
(Wick, unpublished results) show declining SOM levels in (-unfertilized-) pastures. Overall, this study confirms the results from a forest-to-pasture chronosequence in Paragominas, eastern Amazon on similar soils and management regimes (Verchot et al., 1999) that young pastures do not emit higher N2O compared to the forests that they replaced. Excess N, easily available carbon and soil water content controlled fluxes of
25
N2O.
Acknowledgements. We gratefully acknowledge support from the German Research
Founda-tion (DFG), the German Agency for Technical CooperaFounda-tion (GTZ), the NASA Terrestrial Ecol-ogy Program (NASA NCC5-225 and NCC5-357), the US Forest Service and US AID. This work
BGD
2, 499–535, 2005
Nitrous oxide fluxes and nitrogen cycling
B. Wick et al. Title Page Abstract Introduction Conclusions References Tables Figures J I J I Back Close Full Screen / Esc
Print Version Interactive Discussion
EGU was done as part of the Brazilian led Large Scale Biosphere-Atmosphere Experiment in
Ama-zonia (LBA). We also thank E. Davidson for the constructive review of an earlier version of this manuscript.
References
Anderson, J. M. and Ingram, J. S. I.: Tropical Soil Biology and Fertility, A Handbook of Methods,
5
2nd Edition, CAB International, Wallingford, UK, 1993.
Asner, G. P., Townsend, A. R., Bustamante, M. M. C., Nardoto, G. B., and Olander, L. P.: Pasture degradation in the central Amazon: linking changes in carbon and nutrient cycling with remote sensing, Global Change Biology, 10, 844–862, 2004.
Boddey, R. M., Rao, I. M., and Thomas, R. J.: Nutrient cycling and environmental impact of
10
Brachiaria pastures, in: Brachiaria: Biology, Agronomy, and Improvement, edited by: Miles, J. W., Maass, B. L., Valle, C. B., with the collaboration of Kumble, V., Publication no 259, Centro International de Agricultura Tropical, Cali, Colombia, p. 72–86, 1996.
Bonmati, M., Ceccanti, B., and Nannipieri, P.: Protease extraction from soil by sodium py-rophosphate and chemical characterization of the extracts, Soil Biol. Biochem., 30, 2113–
15
2125, 1998.
Brookes, P. C., Landman, A., Pruden, G., and Jenkinson, D. S.: Chloroform fumigation and the release of soil nitrogen: a rapid extraction method for measuring microbial biomass nitrogen in soil, Soil Biol. Biochem., 17, 837–842, 1985.
Castilla, C. and Jackson, W. A.: Nitrogen uptake mechanism in two Brachiaria species: Y-315,
20
in: Brachiaria: Biology, Agronomy, and Improvement, edited by: Miles, J. W., Maass, B. L., Valle, C. B., with the collaboration of Kumble, V., Publication no 259, Centro International de Agricultura Tropical, Cali, Colombia, p. 57, 1996.
Davidson, E. A., Keller, M., Erickson, H. E., Verchot, L. V., and Veldkamp, E.: Testing a con-ceptual model of soil emissions of nitrous and nitric oxides, BioSci., 50(8), 667–680, 2000.
25
Davidson, E. A. and Verchot, L. V.: Testing the hole-in-the-pipe model of nitric and nitrous oxide emissions from soils using the TRAGNET database, Global Biogeochem. Cycles, 14 (4), 1035–1043, 2000.
BGD
2, 499–535, 2005
Nitrous oxide fluxes and nitrogen cycling
B. Wick et al. Title Page Abstract Introduction Conclusions References Tables Figures J I J I Back Close Full Screen / Esc
Print Version Interactive Discussion
EGU R.: Loss of nutrients from terrestrial ecosystems to streams and the atmosphere following
land use change in Amazonia, Ecological Applications, 14, 147–158, 2004.
Desjardins, T., Andreaux, F., Volkoff, B., and Cerri, C. C.: Organic carbon and13C contents in soils and soil size-fractions, and their changes due to deforestation and pasture installation in eastern Amazonia, Geoderma, 61, 103–118, 1994.
5
Eivazi, F., and Tabatabai, M.A.: Glucosidases and galactosidases in soils, Soil Biol. Biochem., 20(5), 601-606, 1988.
Embrapa: Sistema Brasileiro de Classificac¸ ˜ao de solos, 1st edition, Servico de Produc¸ ˜ao de Informac¸ ˜ao- SPI, Bras´ılia, DF, Brazil, 412 p, 1999.
Erickson, H., Keller, M., and Davidson, E. A.: Nitrogen oxide fluxes and nitrogen cycling during
10
postagricultural succession and forest fertilization in the humid tropics, Ecosystems, 4, 67– 84, 2001.
Erickson, H., Davidson, E. A., and Keller, M.: Former land-use and tree species affect nitrogen oxide emissions from a tropical dry forest, Oecologia, 130, 297–308, 2002.
Fernandes, S. A. P., Bernoux, M., Cerri, C. C., Feigl, B. J., and Piccolo, M. C.: Seasonal
15
variation of soil chemical properties and CO2 and CH4fluxes in unfertilized and P-fertilized pastures in an Ultisol of the Brazilian Amazon, Geoderma, 107, 227–241, 2002.
Firestone, M. K. and Davidson, E. A.: Microbiological basis of NO and N2O production and consumption in soil, in: Exchange of trace gases between terrestrial ecosystems and the atmosphere, edited by: Andreae, M. O. and Schimel, D. S., Chichester, John Wiley and
20
Sons, Chichester, UK, p. 7–21, 1989.
Fleming, R. A.: Statistical advantages in, and characteristics of, data from long-term research, The Forestry Chronicle, 75 (3), 487–489, 1999.
Freeman, C., Liska, G., Ostle, N. J., Lock, M. A., Hughes, S., Reynolds, B., and Hudson, J.: Enzymes and biogeochemical cycling in wetlands during a simulated drought, Biogeochem.,
25
39, 177–187, 1997.
Garcia-Montiel, D. C., Neill, C., Melillo, J. M., Thomas, S., Steudler, P. A., and Cerri, C. C.: Soil phosphorus transformations following forest clearing for pasture in the Brazilian Amazon, Soil Sci. Soc. Am. J., 64, 1792–1804, 2000.
Garcia-Montiel, D. C., Steudler, P. A., Piccolo, M. C., Melillo, J. M., Neill, C., and Cerri, C. C.:
30
Controls on soil nitrogen oxide emissions from forest and pastures in the Brazilian Amazon, Global Biogeochem. Cycles, 15 (4), 1021–1030, 2001.
BGD
2, 499–535, 2005
Nitrous oxide fluxes and nitrogen cycling
B. Wick et al. Title Page Abstract Introduction Conclusions References Tables Figures J I J I Back Close Full Screen / Esc
Print Version Interactive Discussion
EGU carbon dioxide, nitrous oxide, and methane from central Amazonian soils and biota during
the dry season: a preliminary study, in: Biogeochemistry of Tropical Rain Forests: Problems for Research, edited by: Athi ´e, D., Lovejoy, T. E., and de Marez Oyens, P., Piricicaba: Centro do Energia Nuclear na Agricultura, and World Wildlife Fund, Piricicaba, S ˜ao Paulo, Brazil, p. 51–66, 1985.
5
Goreau, T. J. and de Mello, W. Z.: Tropical Deforestation: some effects on atmospheric chem-istry, Ambio, 17 (4), 275–281, 1988.
Groffman, P. M.: Ecology of nitrification and denitrification in soil evaluated at scales relevant to atmospheric chemistry, in: Microbial production and consumption of greenhouse gases, edited by: Roger, J. E. and Whitman, W. B., Washington D.C., American Society for
Microbi-10
ology, Washington D.C., p. 91–110, 1991.
Hall, S. J. and Matson, P. A.: Nutrient status of tropical rain forests influences soil N dynamics after N additions, Ecological Monographs, 73 (1), 107–129, 2003.
Hart, S. C., Stark, J. M., Davidson, E. A., and Firestone, M. K.: Nitrogen mineralization, immo-bilization, and nitrification, in: Methods of Analysis, Part 2, Microbiological and Biochemical
15
Properties, Madison, Soil Science Society of America Book Series no 5, Madison, USA, p. 985–1018, 1994.
Houghton, R. A., Skole, D. L., Nobre, C. A., Hackler, J. L., Lawrence, K. T., and Chomentowski, W. H.: Annual fluxes of carbon from the deforestation and regrowth in the Brazilian Amazon, Nature, 403 (6767), 301–304, 2000.
20
IPCC: Climate Change 2001: The Scientific basis, Contribution of working group I to the third assessment report of the intergovernmental panel on climate change, Cambridge University Press, London, 2001.
Kalisz, H. M.: Microbial proteinases, Advances in Biochemical Engineering/Biotechnology, 36, 3–65, 1988.
25
Kandeler, E. and Gerber, H.: Short-term assay of soil urease activity using colorimetric deter-mination of ammonium, Biology and Fertility of Soils, 6, 68–72, 1988.
Kang, H., Freeman, C., and Lock, M. A.: Trace gas emissions from a North Wales fen – role of hydrochemistry and soil enzyme activity, Water, Air, Soil Pollut., 105, 107–116, 1998. Kauffman, J. B., Cunnings, D. L, Ward, D. E., and Babbitt, R.: Fire in the Brazilian Amazon. 1.
30
Biomass, nutrient pools and losses in cattle pastures, Oecologia, 113, 415–427, 1995. Keller, M., Kaplan, W. A., and Wofsy, S. C.: Emissions of N2O, CH4and CO2from tropical forest
BGD
2, 499–535, 2005
Nitrous oxide fluxes and nitrogen cycling
B. Wick et al. Title Page Abstract Introduction Conclusions References Tables Figures J I J I Back Close Full Screen / Esc
Print Version Interactive Discussion
EGU Keller, M., Veldkamp, E., Weitz, A. M., Reiners, W. A.: Effect of pasture age on soil trace gas
emissions from a deforested area of Costa Rica, Nature, 365, 224–246, 1993.
Keller, M. and Reiners, W. A.: Soil-atmosphere exchange of nitrous oxide, nitric oxide, and methane under secondary succession of pasture to forest in the Atlantic lowlands of Costa Rica, Global Biogeochem. Cycles, 8 (4), 399–409, 1994.
5
K ¨onig, N. and Fortmann, H.: Probenvorbereitungs-, Untersuchungs- und Element-bestimmungs-Methoden des Umweltanalytik-Labors der Nieders ¨achsischen Forstlichen Ver-suchsanstalt, 1–4, Berichte des Forschungszentrums Wald ¨okosysteme, Reihe B, University of G ¨ottingen, Germany, B46–B49, ISSN 0939-1339, 1996.
Koutika, L. S., Bartoli, F., Andreaux, F., Cerri, C. C., Burtin, G., Chon ´e, Th., and Philippy,
10
R.: Organic matter dynamics and aggregation in soils under rain forest and pastures of increasing age in the eastern Amazon basin, Geoderma, 76, 87–11, 1997.
Loll, M. J. and Bollag, J. M.: Protein transformation in soil, Advances in Agronomy, 36, 351–382, 1983.
Luiz ˜ao, F., Matson, P., Livingston, G., Luiz ˜ao, R. R. C., and Vitousek, P.: Nitrous oxide fluxes
15
following tropical land clearing, Global Biogeochem. Cycles, 3 (3), 281–285, 1989.
Luiz ˜ao, R. C. C., Bonde, T. A., and Rosswall, T.: Seasonal variation of soil microbial biomass – the effects of clearfelling a tropical rainforest and establishment of pasture in the central Amazon, Soil Biol. Biochem., 24, 805–813, 1992.
Matson, P. A. and Vitousek P. M.: Cross-system comparisons of soil nitrogen transformations
20
and nitrous oxide flux in tropical forest ecosystems, Global Biogeochem. Cycles, 1, 163–170, 1987.
Matson, P. A., Vitousek, P. M., Livingston, G. P., and Swanberg, N. A.: Sources of variation in nitrous oxide flux from Amazonian ecosystems, J. Geophys. Res., 95 (D 10), 16 789–16 798, 1990.
25
Melillo, J. M., Steudler, P. A., Feigl, B. A., Neill, C., Garcia, D., Piccolo, M. C., Cerri, C. C., and Tian, H.: Nitrous oxide emissions from forests and pastures of various ages in the Brazilian Amazon, J. Geophys. Res., 106, 34 179–34 188, 2001.
Moraes, J. F. L., Volkhoff, B., Cerri, C. C., and Bernoux, M.: Soil properties under Amazon forest and changes due to pasture installation in Rond ˆonia, Brazil, Geoderma, 70, 63–81,
30
1996.
Moschrefi, N.: Ein neues Verfahren der Schl ¨ammanalyse f ¨ur die Bestimmung der Ko-rngr ¨oßenzusammensetzung, Mitteilungen der Deutschen Bodenkundlichen Gesellschaft,
BGD
2, 499–535, 2005
Nitrous oxide fluxes and nitrogen cycling
B. Wick et al. Title Page Abstract Introduction Conclusions References Tables Figures J I J I Back Close Full Screen / Esc
Print Version Interactive Discussion
EGU 38, 115–118, 1983.
Mosier, A. R. and Delgado, J. A.: Methane and nitrous oxide fluxes in grasslands in western Puerto Rico, Chemosphere, 35, 2059–2082, 1997.
Neill, C., Piccolo, M. C., Steudler, P. A., Melillo, J. M., Feigl, B., and Cerri, C. C.: Nitrogen dynamics in soils of forests and active pastures in the western Brazilian Amazon basin, Soil
5
Biol. Biochem., 27 (9), 1167–1175, 1995.
Neill, C., Piccolo, M. C., Cerri, C. C., Steudler, P. A., Melillo, J. M., and Brito, M.: Net nitrogen mineralization and net nitrification rates in soils following deforestation for pasture across the southwestern Brazilian Amazon basin landscape, Oecologia, 110, 243–252, 1997.
Neill, C., Piccolo, M. C., Melillo, J. M., Steudler, P. A., and Cerri, C. C.: Nitrogen dynamics
10
in Amazon forest and pasture soils measured by 15N pool dilution, Soil Biol. Biochem., 31, 567–572, 1999.
Nepstad, D. C., Klink, C. A., Uhl, U., Vieira, I. C., Lefebvre, P., Pedlowski, M., Matricardi, E., Negreiros, G., Brown, I. F., Amaral, E., Homma, A., and Walker, R.: Land-use in Amazonia and the Cerrado of Brazil, Ciencia e Cultura Journal of the Brazilian Association for the
15
Advancement of Science, 49, 73–85, 1997.
Parrotta, J. A., Francis, J. K., and de Almeida, R. R.: Trees of the Tapajos, A photographic field guide, Rio Piedras, Puerto Rico, United States Department of Agriculture, Forest Service, International Institute of Tropical Forestry, General Technical Report IITF-1, 1995.
Pickett, S. T. A.: Space-for-time substitution as an alternative to long-term studies, in:
Long-20
term studies in ecology, edited by: Likens, G. E., New York, Springer Verlag New York, 110–135, 1989.
Plant, R. A. J.: Regional analysis of soil-atmosphere nitrous oxide emissions in the Northern Atlantic Zone of Costa Rica, Global Change Biology, 6, 639–653, 2000.,
Raison, R. J.: Modification of the soil environment by vegetation fires, with particular reference
25
to nitrogen transformations: a review, Plant and Soil, 51, 73–108, 1979.
Reiners, W. A. S., Liu, K. G., Gerow, M., Keller, M., and Schimel, D. S.: Historical and future land use effects on N2O and No emissions using an ensemble modeling approach: Costa Rica’s Caribbean lowlands as an example, Global Biogeochem. Cycles, 16 (4), art. no. 1068, doi:10.1029/2001GB001437, 2002.
30
Shewale, J. G.: Beta-glucosidase: its role in cellulase synthesis and hydrolysis of cellulose, International Journal of Biochemistry, 14, 435–443, 1982.
BGD
2, 499–535, 2005
Nitrous oxide fluxes and nitrogen cycling
B. Wick et al. Title Page Abstract Introduction Conclusions References Tables Figures J I J I Back Close Full Screen / Esc
Print Version Interactive Discussion
EGU and belowground carbon and nutrient storage in a lowland Amazonian Forest Ecosystem,
Ecosystems, 3, 193–209, 2000.
SYSTAT for Windows: Statistics, Version 10.2 Edition, Evanston, Illinois, USA, 2002.
Tateno, M.: Limitations of available substrates for the expression of cellulase and protease activities in soil, Soil Biol. Biochem., 20 (1), 117–118, 1988.
5
Tiessen, H. and Moir, J. O.: Characterization of available phosphorus by sequential extraction, in: Soil sampling and Methods of Analysis, edited by: Carter, M. R., Canadian Society of Soil Science, Lewis Publishers, USA, p. 75–86, 1993.
Trumbore, S. E., Davidson, E. A., Demarco, P. B., Nepstad, D. C., and Martinelli, L. A.: Below-ground cycling of carbon in forests and pastures of eastern Amazonia, Global Biogeochem.
10
Cycles, 9, 515–528, 1995.
Vance, E. D., Brookes, P. C., and Jenkinson, D. S.: An extraction method for measuring soil microbial biomass C, Soil Biol. Biochem., 19 (6), 703–707, 1987.
Veldkamp, E., Keller, M., and Nu ˜nez, M.: Effects of pasture management on N2O and NO
emissions from soils in the humid tropics of Costa Rica, Global Biogeochem. Cycles, 12,
15
71–79, 1998.
Veldkamp, E., Davidson, E., Erickson, H., Keller, M., and Weitz, A.: Soil nitrogen cycling and nitrogen oxide emissions along a pasture chronosequence in the humid tropics of Costa Rica, Soil Biol. Biochem., 31, 387–394, 1999.
Verchot, L. V., Davidson, E. A., Catt ˆanio, J. H., Ackerman, I. L., Erickson, H. E., and Keller,
20
M.: Land use change and biogeochemical controls of nitrogen oxide emissions from soils of eastern Amazonia, Global Biogeochem. Cycles, 13, 31–46, 1999.
Vitousek, P. M., Gosz, J. R., Grier, C. C., Melillo, J. M., and Reiners, W. A.: A comparative analy-sis of potential nitrification and nitrate mobility in forest ecosystems, Ecological Monographs, 52, 155–177, 1982.
25
Vitousek, P. M. and Sanford Jr., R. L.: Nutrient cycling in moist tropical forest, Annual Review of Ecological Systems, 17, 137–167, 1986.
BGD
2, 499–535, 2005
Nitrous oxide fluxes and nitrogen cycling
B. Wick et al. Title Page Abstract Introduction Conclusions References Tables Figures J I J I Back Close Full Screen / Esc
Print Version Interactive Discussion
EGU
Table 1. Average (±standard error) soil physical and chemical characteristics of the top 10 cm
of old growth forests and pasture soils during the wet and dry season of 2000, near Santar ´em, Par ´a, Brazil.
Clay Sand BD WFPS pH Ntot Pi Al Ca
% Mg m−3 % H2O g kg −1 µg g−1 cmolckg −1 wet dry Forest 78 8 0.76 55 43 3.9 2.6 12.4 4.4 0.2 Forest 25 58 ND ND 46 3,9 1,6 8,6 1,2 0,9 0.5 yr 67 20 0.88 47 42 5.5 2.4 18.1 1.0 5.2 0.5 yr 53 32 0.97 59 40 4.9 2.1 23.0 1.3 3.5 0.5 yr 69 7 0.75 41 35 4.3 2.4 7.8 3.1 1.5 1 yr 66 24 1.06 67 ND 4.0 2.4 13.1 2.9 0.5 2 yrs 72 14 1.11 93 66 4.5 2.4 10.0 3.9 1.9 2 yrs 73 9 1.03 73 55 5.5 2.6 6.1 0.4 6.4 2 yrs 57 24 0.91 40 35 5.2 2.6 7.1 0.8 5.6 2 yrs 72 12 1.05 76 52 5.1 2.4 7.8 0.9 3.2 4 yrs 64 12 0.92 70 53 5.7 2.1 5.8 0.5 7.1 4 yrs 61 11 1.11 83 83 5.1 2.3 6.2 0.3 4.1 5 yrs 62 6 0.98 76 59 5.2 2.3 5.7 0.6 4.6 5 yrs 58 15 0.99 57 48 5.1 2.3 6.9 0.7 4.1 6 yrs 66 18 1.02 72 50 5.1 2.1 9.7 1.4 4.9 6 yrs 57 18 0.91 58 41 5.3 2.5 9.7 0.2 6.3 6 yrs 55 16 1.13 84 75 5.2 2.1 8.3 0.6 3.5 8 yrs 76 7 0.87 62 46 5.0 2.6 11.7 1.0 5.3 8 yrs 47 27 0.98 63 55 4.6 2.1 8.6 1.3 3.0 10 yrs 36 55 1.07 52 28 4.9 1.6 5.7 0.9 2.3 10 yrs 45 45 1.48 92 57 4.9 1.5 6.0 0.9 1.4 10 yrs 72 8 0.93 62 46 4.8 2.0 9.2 0.8 2.5 10 yrs 54 30 1.08 74 47 4.9 2.3 11.8 1.0 4.2 12 yrs 46 25 1.10 66 48 5.5 2.1 6.7 0.1 5.2 15 yrs 43 44 1.20 100 53 4.9 1.8 6.9 0.6 2.0 15 yrs 43 27 1.21 70 55 5.6 1.7 0.1 5.6 20 yrs 40 49 1.17 46 36 5.2 1.6 5.7 0.3 2.1 25 yrs 53 31 1.22 74 78 4.9 1.6 6.5 0.4 1.7 60 yrs 45 45 1.44 91 49 4.8 1.3 5.0 1.0 0.7 ND=not determined.
BGD
2, 499–535, 2005
Nitrous oxide fluxes and nitrogen cycling
B. Wick et al. Title Page Abstract Introduction Conclusions References Tables Figures J I J I Back Close Full Screen / Esc
Print Version Interactive Discussion EGU 1 Figure 1. -5 0 5 10 15 20 25 30 ng N O cm h 2 -2 -1 F 0.5 1 2 4 6 8 10 15 20 25 60 year -5 0 5 10 15 20 25 30 F 0.5 2 4 5 6 8 10 12 15 25 year
Fig. 1. Fluxes of N2O (ng N2O-N cm−2h−1) from forest and pasture soils during the wet season (left) and the dry season (right) of 2000, near Santar ´em, Par ´a, Brazil.
BGD
2, 499–535, 2005
Nitrous oxide fluxes and nitrogen cycling
B. Wick et al. Title Page Abstract Introduction Conclusions References Tables Figures J I J I Back Close Full Screen / Esc
Print Version Interactive Discussion EGU 1 Figure 2. -20 0 20 40 60 80 100 120 mg CH m d 4 -2 -1 F 0.5 1 2 4 5 6 8 10 12 15 20 25 60 year -20 0 20 40 60 80 100 120 F 0.5 1 2 4 5 6 8 10 12 15 20 25 60 year
Fig. 2. Fluxes of CH4 (mg m−2 d−1) from forest and pasture soils during the wet season (left) and the dry season (right) of 2000, near Santar ´em, Par ´a, Brazil.
BGD
2, 499–535, 2005
Nitrous oxide fluxes and nitrogen cycling
B. Wick et al. Title Page Abstract Introduction Conclusions References Tables Figures J I J I Back Close Full Screen / Esc
Print Version Interactive Discussion EGU 1 Figure 3. 0 20 40 60 80 100 120 140 m g NH + N O k g soil 43 +--1 F 0.5 1 2 4 5 6 8 10 12 15 20 25 60 year = NH4+- N = NO3- - N 0 20 40 60 80 100 120 140 F 0.5 2 4 5 6 8 10 12 15 20 25 60 year = NH4+- N = NO3- - N
Fig. 3. Inorganic N-pools (mg NH+4 and NO−3-N per kilogram soil) from forest and pasture soils during the wet season (left) and the dry season (right) of 2000, near Santar ´em, Par ´a, Brazil.
BGD
2, 499–535, 2005
Nitrous oxide fluxes and nitrogen cycling
B. Wick et al. Title Page Abstract Introduction Conclusions References Tables Figures J I J I Back Close Full Screen / Esc
Print Version Interactive Discussion EGU 1 Figure 4. -30 -25 -20 -15 -10 -5 0 5 10 15 20 25 mg NH + N O -N k g soil 7 d 43 +--1 -1 F 0.5 1 2 4 5 6 8 10 12 15 20 25 60 year = N-min = N-nit -30 -25 -20 -15 -10 -5 0 5 10 15 20 25 F 0.5 2 4 5 6 8 10 12 15 20 25 60 year = N-min = N-nit
Fig. 4. Potential N-mineralization (mg NH+4 and NO−3-N) and nitrification rates (mg NO−3-N) over 7 days in the laboratory from forest and pasture soils during the wet season (left) and the dry season (right) of 2000, near Santar ´em, Par ´a, Brazil.
BGD
2, 499–535, 2005
Nitrous oxide fluxes and nitrogen cycling
B. Wick et al. Title Page Abstract Introduction Conclusions References Tables Figures J I J I Back Close Full Screen / Esc
Print Version Interactive Discussion EGU Figure 5. 0 10 20 30 40 50 60 70 80 90 100 mi cr ob ia lb io ma ss N (mg k g so il ) -1 F 0.5 1 2 4 5 6 8 10 12 15 20 25 60 year 0 10 20 30 40 50 60 70 80 90 100 F 0.5 2 4 5 6 8 10 12 15 20 25 60 year
Fig. 5. Microbial biomass N (mg N kg−1 soil) from forest and pasture soils during the wet season (left) and the dry season (right) of 2000, near Santar ´em, Par ´a, Brazil.
BGD
2, 499–535, 2005
Nitrous oxide fluxes and nitrogen cycling
B. Wick et al. Title Page Abstract Introduction Conclusions References Tables Figures J I J I Back Close Full Screen / Esc
Print Version Interactive Discussion EGU Figure 6. 0 50 100 150 200 250 300 350 µg NH g soil h 4 +-1 -1 F 0.5 1 2 4 5 6 8 10 12 15 20 25 60 year 0 50 100 150 200 250 300 350 F 0.5 2 4 5 6 8 10 12 15 20 25 60 year
Fig. 6. Protease activity (µg NH+4-N g−1 soil h−1) from forest and pasture soils during the wet season (left) and the dry season (right) of 2000, near Santar ´em, Par ´a, Brazil.
BGD
2, 499–535, 2005
Nitrous oxide fluxes and nitrogen cycling
B. Wick et al. Title Page Abstract Introduction Conclusions References Tables Figures J I J I Back Close Full Screen / Esc
Print Version Interactive Discussion EGU Figure 7.
0
10
20
30
40
50
60
70
80
li
tter
C:N
ratio
F
0.5 1
2
4
5
6
8
10 12 15 20 25 60
year
BGD
2, 499–535, 2005
Nitrous oxide fluxes and nitrogen cycling
B. Wick et al. Title Page Abstract Introduction Conclusions References Tables Figures J I J I Back Close Full Screen / Esc
Print Version Interactive Discussion EGU Figure 8a. 0,0 0,2 0,4 0,6 0,8 1,0 1,2 1,4 1,6 log [ng N O cm h ] 2 -2 -1 0 20 40 60 80 litter C:N
Fig. 8. (a) Linear regressions of wet season log transformed N2O fluxes with litter C/N ratio [log N2O=−0.009*litter C:N + 1.12, R2=0.28, p=0.01, n=23] during 2000 from a forest-to-pasture chronosequence near Santar ´em, Par ´a, Brazil.
BGD
2, 499–535, 2005
Nitrous oxide fluxes and nitrogen cycling
B. Wick et al. Title Page Abstract Introduction Conclusions References Tables Figures J I J I Back Close Full Screen / Esc
Print Version Interactive Discussion EGU Figure 8b.
0,0
0,2
0,4
0,6
0,8
1,0
1,2
1,4
1,6
lo
g
[n
g
N
O
cm
h
]
2 -2 -10,0
0,2
0,4
0,6
0,8
1,0
ratio NO : NH + NO [µg g soil]
3- 4+ 3- -1Fig. 8. (b) Linear regressions of wet season log transformed N2O fluxes with the ratio NO−3:NH+4+NO−3[log N2O=0.497*ratio NO−3:NH+4+0.403, R2=0.23, p=0.016, n=25] during 2000 from a forest-to-pasture chronosequence near Santar ´em, Par ´a, Brazil.
BGD
2, 499–535, 2005
Nitrous oxide fluxes and nitrogen cycling
B. Wick et al. Title Page Abstract Introduction Conclusions References Tables Figures J I J I Back Close Full Screen / Esc
Print Version Interactive Discussion EGU Figure 8c.
0,0
0,1
0,2
0,3
0,4
0,5
0,6
0,7
0,8
0,9
1,0
lo
g
[n
g
N
O
cm
h
]
2 -2 -10,0
0,5
1,0
1,5
2,0
log [µg NH + NO g soil]
4+ 3- -1Fig. 8. (c) Linear regressions of dry season log transformed N2O fluxes with log NH+4+NO−3 [log N2O=0.244*log (NO−3+NH+4)+0.239, R2=0.23, p=0.026, n=21] during 2000 from a forest-to-pasture chronosequence near Santar ´em, Par ´a, Brazil.
BGD
2, 499–535, 2005
Nitrous oxide fluxes and nitrogen cycling
B. Wick et al. Title Page Abstract Introduction Conclusions References Tables Figures J I J I Back Close Full Screen / Esc
Print Version Interactive Discussion EGU Figure 8d.
0,0
0,2
0,4
0,6
0,8
1,0
1,2
1,4
1,6
lo
g
[n
g
N
O
cm
h
]
2 -2 -10,0
0,5
1,0
1,5
2,0
2,5
log [mg CH m d ]
4 -2 -1Fig. 8. (d) Linear regressions of wet season log transformed N2O fluxes with log CH4+50 [log N2O=−0.239*log CH4+0.92, R2=0.19, p=0.03, n=25] during 2000 from a forest-to-pasture chronosequence near Santar ´em, Par ´a, Brazil.
![Fig. 8. (a) Linear regressions of wet season log transformed N 2 O fluxes with litter C/N ratio [log N 2 O= −0.009*litter C:N + 1.12, R 2 =0.28, p =0.01, n=23] during 2000 from a forest-to-pasture chronosequence near Santar ´em, Par ´a, Brazil.](https://thumb-eu.123doks.com/thumbv2/123doknet/14800789.606146/33.918.60.645.114.485/linear-regressions-season-transformed-pasture-chronosequence-santar-brazil.webp)
![Fig. 8. (b) Linear regressions of wet season log transformed N 2 O fluxes with the ratio NO − 3 :NH +4 + NO −3 [log N 2 O = 0.497*ratio NO −3 :NH +4 + 0.403, R 2 = 0.23, p = 0.016, n = 25] during 2000 from a forest-to-pasture chronosequence near Santar ´em](https://thumb-eu.123doks.com/thumbv2/123doknet/14800789.606146/34.918.60.663.89.508/linear-regressions-season-transformed-fluxes-pasture-chronosequence-santar.webp)
![Fig. 8. (c) Linear regressions of dry season log transformed N 2 O fluxes with log NH + 4 + NO − 3 [log N 2 O=0.244*log (NO − 3 +NH +4 )+0.239, R 2 =0.23, p =0.026, n=21] during 2000 from a forest-to-pasture chronosequence near Santar ´em, Par ´a, Brazil.](https://thumb-eu.123doks.com/thumbv2/123doknet/14800789.606146/35.918.61.655.88.507/linear-regressions-season-transformed-pasture-chronosequence-santar-brazil.webp)
