RESEARCH PAPER
Quantitative monitoring of tamoxifen in human plasma extended
to 40 metabolites using liquid-chromatography high-resolution
mass spectrometry: new investigation capabilities
for clinical pharmacology
Elyes Dahmane&Julien Boccard&Chantal Csajka&Serge Rudaz&Laurent Décosterd&
Eric Genin&Bénédicte Duretz&Maciej Bromirski&Khalil Zaman&Bernard Testa&
Bertrand Rochat
Received: 30 October 2013 / Revised: 6 January 2014 / Accepted: 6 February 2014 / Published online: 16 March 2014 # Springer-Verlag Berlin Heidelberg 2014
Abstract Liquid-chromatography (LC) high-resolution (HR) mass spectrometry (MS) analysis can record HR full scans, a technique of detection that shows comparable selectivity and sensitivity to ion transitions (SRM) performed with triple-quadrupole (TQ)-MS but that allows de facto determination of “all” ions including drug metabolites. This could be of potential utility in in vivo drug metabolism and pharmacovigilance studies in order to have a more compre-hensive insight in drug biotransformation profile differences in patients. This simultaneous quantitative and qualitative (Quan/Qual) approach has been tested with 20 patients chron-ically treated with tamoxifen (TAM). The absolute quantifica-tion of TAM and three metabolites in plasma was realized
using HR- and TQ-MS and compared. The same LC-HR-MS analysis allowed the identification and relative quantification of 37 additional TAM metabolites. A number of new metab-olites were detected in patients’ plasma including metabolites identified as didemethyl-trihydroxy-TAM-glucoside and didemethyl-tetrahydroxy-TAM-glucoside conjugates corre-sponding to TAM with six and seven biotransformation steps, respectively. Multivariate analysis allowed relevant patterns of metabolites and ratios to be associated with TAM administra-tion and CYP2D6 genotype. Two hydroxylated metabolites, α-OH-TAM and 4′-OH-TAM, were newly identified as puta-tive CYP2D6 substrates. The relaputa-tive quantification was pre-cise (<20 %), and the semiquantitative estimation suggests Parts of this work were presented at the 62nd ASMS Conference on Mass
Spectrometry and Allied Topics in Baltimore Maryland, 2013. Electronic supplementary material The online version of this article (doi:10.1007/s00216-014-7682-2) contains supplementary material, which is available to authorized users.
E. Dahmane
:
J. Boccard:
C. Csajka:
S. RudazSchool of Pharmaceutical Sciences, University of Geneva and University of Lausanne, 1211 Geneva 4, Switzerland
E. Dahmane
:
C. CsajkaDivision of Clinical Pharmacology, University Hospital of Lausanne, CHUV, 1011 Lausanne, Switzerland
L. Décosterd
Innovation and Development Unit, Department of Laboratories, University Hospital of Lausanne; CHUV, 1011 Lausanne, Switzerland
E. Genin
:
B. Duretz:
M. BromirskiThermo Fisher Scientific, 28199 Bremen, Germany
K. Zaman
Breast Center, Department of Oncology, University Hospital of Lausanne; CHUV, 1011 Lausanne, Switzerland
B. Testa
Department of Pharmacy, University Hospital of Lausanne; CHUV, 1011 Lausanne, Switzerland
B. Rochat (*)
Quantitative Mass Spectrometry Facility [qMSF], University Hospital of Lausanne, CHUV, BH18-228, Rte du Bugnon 46, 1011 Lausanne, Switzerland
e-mail: bertrand.rochat@chuv.ch DOI 10.1007/s00216-014-7682-2
that metabolite levels are non-negligible. Metabolites could play an important role in drug toxicity, but their impact on drug-related side effects has been partially neglected due to the tremendous effort needed with previous MS technologies. Using present HR-MS, this situation should evolve with the straightforward determination of drug metabolites, enlarging the possibilities in studying inter- and intra-patients drug metabolism variability and related effects.
Keywords Drug metabolites . High-resolution mass spectrometry . Plasma . Quantification . Therapeutic drug monitoring . Triple-quadrupole
Abbreviations
HR-MS High-resolution mass spectrometry MDF Mass defect filtering
TDM Therapeutic drug monitoring
TQ-MS Triple-quadrupole mass spectrometer TDM XIC Extracted ions chromatogram
Introduction
Adverse drug reactions (ADR) are a major concern as regards the number of people exposed (millions), the number of deaths (a few thousands), and financial costs (US$10–100 billion in a country such as the USA) [1–3]. Moreover, the absolute number of ADR is steadily increasing due to (i) an increased number of prescriptions, (ii) the increased number of available drugs, and (iii) polymedication [2].
Recently, the importance of drug metabolites in ADR have been specifically underscored with the release of Authority Guidance for industry about the safety of drug metabolites (Metabolites In Safety Testing (MIST) in 2008) and the Inter-national Conference on Harmonization (ICH Guideline M3(R2) in 2009/2010) [4,5]. Today, drug developers must address drug metabolite toxicology when their levels repre-sent more than 10 % of the total drug-related exposure or if they are present in disproportionate higher levels in humans than in the tested animals [6].
The mechanisms of toxicity of a drug and its metabolites are diverse and can be (i) on-target, (ii) off-target with the binding of the drug/metabolites to an alternate target, or (iii) related to the covalent binding of reactive metabolites to proteins, nucleic acids, or membranes [7–9]. Strong side ef-fects can also be observed with very low levels of metabolites or at a very low frequency (<1 case in 1,000 patients). These are rare events involving (alone or in combination) rare alleles (single nucleotide polymorphisms (SNPs)), or drug–drug/– herbal/–food interactions (induction and/or inhibition) able to alter pharmacokinetics [10, 11]. Eventually, the realistic safety profile of a new approved drug can only be appraised
after a number of years of public use [2]. This underscores the huge significance of pharmacovigilance [12].
One main example of a drug whose metabolic pathways and related pharmacodynamics has raised interest through the last decades, is tamoxifen (TAM), a selective estrogen recep-tor modularecep-tor, used for the prevention and adjuvant treatment of estrogen-sensitive breast cancer. TAM is extensively me-tabolized into active, inactive, and reactive metabolites though different metabolic pathways involving different enzymes (mainly cytochrome P-450 (CYP) and conjugation enzymes) whose activities can vary intra- and inter-individually [7, 13–15]. Two metabolites, 4-hydroxy-TAM and endoxifen (4-hydroxy-N-demethyl-TAM), show much higher activity than the parent drug with up to 100-fold greater affinity and potency in inhibiting estrogen receptors [13]. Patients with lower endoxifen levels, as a consequence of the re-duced CYP2D6 activity, are less likely to achieve benefit from TAM treatment [14]. Conversely, patients with higher endoxifen concentrations have higher frequency of side effects. Other TAM metabolites could be related to the occurrence of other ADR such as cancer via the formation of reactive carbocation or benzoquinones [7]. Thus, the extensive TAM biotransformation underscores the impor-tance of comprehensive in vivo drug metabolism studies [15–18].
In the present work, our objective was to show that now-adays, the determination of a drug and tens of its metabolites in human plasma is feasible with recent high-resolution mass spectrometers (HR-MS; time-of-flight- and Orbitrap-MS). In liquid-chromatography (LC) coupled to HR-MS analysis, the detection of a drug and its metabolites can be performed by high-resolution full scan (HR-FS) with comparable selectivity, sensitivity, level accuracy, robustness, and ease of use to ion transitions (SRM) performed with triple-quadrupole MS (TQ-MS) [19–23]. This is why there is a replacement of TQ-MS by HR-MS in many laboratories [24]. HR-FS acquisition records virtually all ions and allows the determination of known or unexpected compounds that can possibly be identified retro-spectively. The selectivity of HR-FS takes place post-acquisition by the construction of an extracted ion chromato-gram (XIC) on the analyte theoretical m/z with a narrow mass extraction window (MEW) [22].
As a noteworthy consequence for clinical pharmacologists, HR-MS technology (i) offers the possibility to identify and survey the exposure to a drug and tens of its metabolites and (ii) allow, whenever needed, to extend drug monitoring to many drug metabolites in patients’ samples, in order to relate their concentrations with toxicity or efficacy. This is in line with recent Authority’s demands about pharmacovigilance [12,25,26].
In the present study, we have tested a quantitative and qualitative (Quan/Qual) approach on 20 patients treated with TAM. In parallel to the absolute quantification of TAM and
three known metabolites by HR-MS and TQ-MS, the relative quantification of 37 other identified TAM metabolites was performed together with their provisional elucidation.
Materials and methods Materials and reagents
TAM was purchased from Sigma-Aldrich (Germany). (Z)-4-hydroxy-TAM (4-OH-TAM), (Z)-N-demethyl-TAM (N-demethyl-TAM), N-demethyl-4-hydroxy-TAM 1:1 E/Z mix-ture (N-demethyl-4-OH-TAM) and the deuterated internal standards (IS): TAM-ethyl-D5(TAM-IS), N-demethyl-TAM-ethyl-D5 (N-demethyl-TAM/IS), 4-hydroxy-TAM-ethyl-D5 (4-OH-TAM/IS), and N-demethyl-4-hydroxy-TAM-ethyl-D5 (endoxifen-IS), were purchased from Toronto Research Chemicals Inc. (Canada). Chromatography solvents and other chemicals were of analytical grade (Merck (Darmstadt, Germany).
Patients’ blood withdrawal, plasma extraction and CYP2D6 status
Blood samples were obtained from breast cancer patients enrolled in a study protocol (ClinicalTrials.gov Identifier: NCT00963209) approved by the local Ethics Committee Patients received 20 mg TAM once or twice daily for ≥4 months. Blood samples were centrifuged (1,850×g, 10 min, +4 °C). Plasma were transferred and frozen at−20 °C.
As previously described in a method validated according to FDA guidelines [27], the extraction was as follows: 100μL of plasma samples were mixed with 400μL MeCN containing the four IS (6.25 ng/mL). The mixture was centrifuged (16,000×g, 10 min, 4 °C). Supernatants were transferred into polypropylene tubes and evaporated at RT under a N2flux. The dried residues were reconstituted in 600 μL MeOH/20 mM ammonium formate 1:1 (v/v) adjusted to pH 2.9 and re-centrifuged. Supernatants were transferred into injection vials.
Patients were classified according to their CYP2D6 geno-type as poor (PM; N=1), intermediate (IM; N=7), extensive (EM; N=11), or ultra-rapid metabolizers (UM; N=1). LC-MS methods and parameters
The analyses used two UHPLC systems coupled to a triple-quadrupole Quantum Ultra MS (Thermo, USA) or an Exactive Plus Orbitrap MS (Thermo, Germany) and included a Rheos Allegro pump (Flux Instruments, Switzerland) and a HTS PAL autosampler (CTC analytics, Switzerland) set at 10 °C. Heated electrospray ionization (H-ESI) was operated
in positive mode. All H-ESI and MS parameters were usual values including spray voltage, 3.8–4.7 kV; sheath gas and auxiliary nitrogen pressures, 40–60 and 10–20 respective arbitrary units; declustering potential, 4–10 V; capillary tem-perature, 300–350 °C; and tube lens voltages, 60 to 180 V.
The mobile phase was 10 mM ammonium formate+0.1 % FA (A) and MeCN + 0.1 % FA (B) and was delivered at 300 μL/min using the following stepwise gradient: T= 0 min, 20 % B; T=11 min maintained for 1.4 min, 55 % B; T=12.5 min: initial conditions for 3.5 min. The analytical column, 2.1 × 30 mm (i.d. × L) Acquity UPLC BEH C18 1.7 μm particle size (Waters, USA), was placed in an oven set at +40 °C. The injection volume was 10μL. Data acqui-sition, peak integration, and quantification were performed using Xcalibur software (Thermo, USA).
TQ-MS settings: quadrupole resolution, 0.7 U at FWHM; collision gas (Arg) pressure, 1.5 mTorr, and transitions with 0.5 U and 0.02 s scan width and scan time, respectively. SRM were recorded in centroid mode with the following precur-sor→product m/z and collision-induced dissociation (see Ta-ble 1 for abbreviations and chemical compositions). TAM, 372.3→72.1 at 23 eV; N-demethyl-TAM, 358.3→58.1 at 21 eV; 4-OH-TAM, 388.3→70.1+72.1+129.1 at 38/25/ 25 eV; Endoxifen, 374.3→58.1+129.1+223.1 at 22/28/ 20 eV; Endoxifen_IS, 377.3→72.1 at 24 eV; 4-OH-TAM_IS:, 363.3→58.1 at 21 eV; N-demethyl-TAM_IS, 393.3→72.1 at 25 eV; and TAM_IS, 379.3→58.1 at 22 eV.
Exactive Plus-HR-MS settings: HR-FS alternating with “all-ion fragmentation” MS (MSALL
; high-energy collisional dissociation=40 eV) scan: from m/z 200 to 800 and m/z 55 to 800, respectively. MSALLis the fragmentation of all precursor ions entering the C-trap (no ion selections). C-trap capacity:, 106charges; maximum injection time, 250 ms; and H-ESI probe temperature, 300 °C. External mass calibration of the Exactive Plus-MS was performed when mass accuracy was less than or equal to ±4 ppm. Resolution, 70,000 and 17,500 FWHM for HR-FS and MSALLacquisition, respectively. XIC were based on a ±5 ppm MEW.
LC-MS parameters for metabolite confirmation with MS2 acquisition
For confirmation and structure elucidation attempt of some TAM metabolites, additional product scan acquisitions were performed (MS2with the precursor ion selection within a m/z unit) on a Q-Exactive-MS (Thermo, Germany). UHPLC con-ditions were similar to the analysis on the Exactive Plus-MS but sample extracts were ten times more concentrated. Quantitative analysis
As previously described [27], calibration curves were pre-pared with TAM, 4-OH-TAM, N-demethyl-TAM, and and collected in K-EDTA Monovettes® (Sarstedt, Germany).
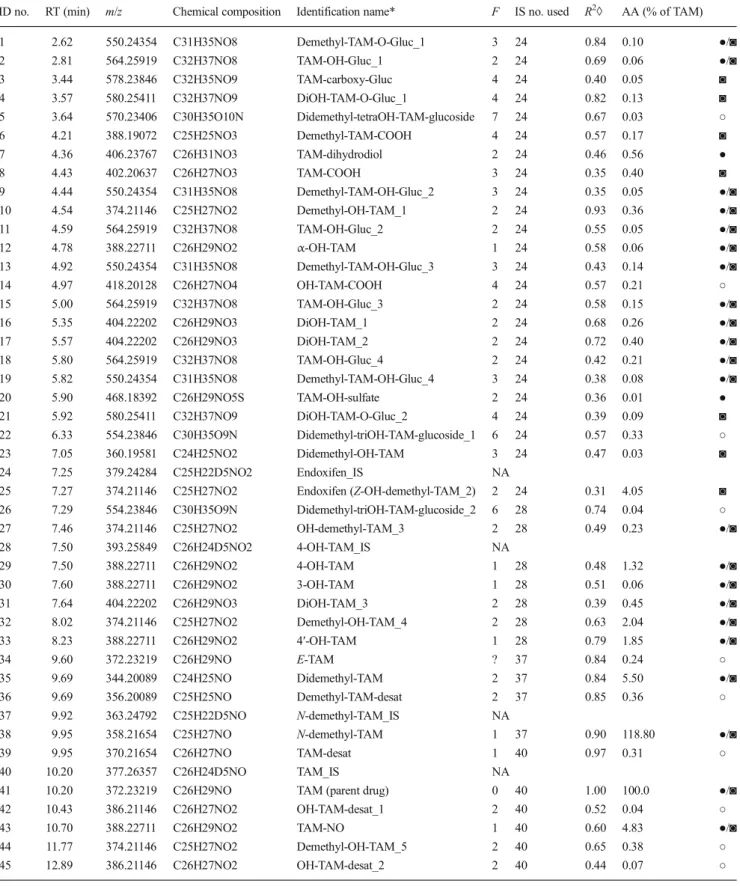
Table 1 List of compounds determined in this study. Compound identi-fication number (ID no.), retention time (RT), monoisotopic m/z used to construct extracted ion chromatograms (XIC), chemical composition, abbreviated name, metabolite generation number (F), internal standrad
(IS no.) used for metabolite/IS ratio (relative quantification), determina-tion coefficient (R2) between metabolite/IS and TAM/IS ratios and
me-tabolite mean peak area (AA) expressed in percent of TAM mean peak area, are given
ID no. RT (min) m/z Chemical composition Identification name* F IS no. used R2◊ AA (% of TAM)
1 2.62 550.24354 C31H35NO8 Demethyl-TAM-O-Gluc_1 3 24 0.84 0.10 ●/◙ 2 2.81 564.25919 C32H37NO8 TAM-OH-Gluc_1 2 24 0.69 0.06 ●/◙ 3 3.44 578.23846 C32H35NO9 TAM-carboxy-Gluc 4 24 0.40 0.05 ◙ 4 3.57 580.25411 C32H37NO9 DiOH-TAM-O-Gluc_1 4 24 0.82 0.13 ◙ 5 3.64 570.23406 C30H35O10N Didemethyl-tetraOH-TAM-glucoside 7 24 0.67 0.03 ○ 6 4.21 388.19072 C25H25NO3 Demethyl-TAM-COOH 4 24 0.57 0.17 ◙ 7 4.36 406.23767 C26H31NO3 TAM-dihydrodiol 2 24 0.46 0.56 ● 8 4.43 402.20637 C26H27NO3 TAM-COOH 3 24 0.35 0.40 ◙ 9 4.44 550.24354 C31H35NO8 Demethyl-TAM-OH-Gluc_2 3 24 0.35 0.05 ●/◙ 10 4.54 374.21146 C25H27NO2 Demethyl-OH-TAM_1 2 24 0.93 0.36 ●/◙ 11 4.59 564.25919 C32H37NO8 TAM-OH-Gluc_2 2 24 0.55 0.05 ●/◙ 12 4.78 388.22711 C26H29NO2 α-OH-TAM 1 24 0.58 0.06 ●/◙ 13 4.92 550.24354 C31H35NO8 Demethyl-TAM-OH-Gluc_3 3 24 0.43 0.14 ●/◙ 14 4.97 418.20128 C26H27NO4 OH-TAM-COOH 4 24 0.57 0.21 ○ 15 5.00 564.25919 C32H37NO8 TAM-OH-Gluc_3 2 24 0.58 0.15 ●/◙ 16 5.35 404.22202 C26H29NO3 DiOH-TAM_1 2 24 0.68 0.26 ●/◙ 17 5.57 404.22202 C26H29NO3 DiOH-TAM_2 2 24 0.72 0.40 ●/◙ 18 5.80 564.25919 C32H37NO8 TAM-OH-Gluc_4 2 24 0.42 0.21 ●/◙ 19 5.82 550.24354 C31H35NO8 Demethyl-TAM-OH-Gluc_4 3 24 0.38 0.08 ●/◙ 20 5.90 468.18392 C26H29NO5S TAM-OH-sulfate 2 24 0.36 0.01 ● 21 5.92 580.25411 C32H37NO9 DiOH-TAM-O-Gluc_2 4 24 0.39 0.09 ◙ 22 6.33 554.23846 C30H35O9N Didemethyl-triOH-TAM-glucoside_1 6 24 0.57 0.33 ○ 23 7.05 360.19581 C24H25NO2 Didemethyl-OH-TAM 3 24 0.47 0.03 ◙ 24 7.25 379.24284 C25H22D5NO2 Endoxifen_IS NA
25 7.27 374.21146 C25H27NO2 Endoxifen (Z-OH-demethyl-TAM_2) 2 24 0.31 4.05 ◙
26 7.29 554.23846 C30H35O9N Didemethyl-triOH-TAM-glucoside_2 6 28 0.74 0.04 ○ 27 7.46 374.21146 C25H27NO2 OH-demethyl-TAM_3 2 28 0.49 0.23 ●/◙ 28 7.50 393.25849 C26H24D5NO2 4-OH-TAM_IS NA 29 7.50 388.22711 C26H29NO2 4-OH-TAM 1 28 0.48 1.32 ●/◙ 30 7.60 388.22711 C26H29NO2 3-OH-TAM 1 28 0.51 0.06 ●/◙ 31 7.64 404.22202 C26H29NO3 DiOH-TAM_3 2 28 0.39 0.45 ●/◙ 32 8.02 374.21146 C25H27NO2 Demethyl-OH-TAM_4 2 28 0.63 2.04 ●/◙ 33 8.23 388.22711 C26H29NO2 4′-OH-TAM 1 28 0.79 1.85 ●/◙ 34 9.60 372.23219 C26H29NO E-TAM ? 37 0.84 0.24 ○ 35 9.69 344.20089 C24H25NO Didemethyl-TAM 2 37 0.84 5.50 ●/◙ 36 9.69 356.20089 C25H25NO Demethyl-TAM-desat 2 37 0.85 0.36 ○ 37 9.92 363.24792 C25H22D5NO N-demethyl-TAM_IS NA 38 9.95 358.21654 C25H27NO N-demethyl-TAM 1 37 0.90 118.80 ●/◙ 39 9.95 370.21654 C26H27NO TAM-desat 1 40 0.97 0.31 ○ 40 10.20 377.26357 C26H24D5NO TAM_IS NA
41 10.20 372.23219 C26H29NO TAM (parent drug) 0 40 1.00 100.0 ●/◙
42 10.43 386.21146 C26H27NO2 OH-TAM-desat_1 2 40 0.52 0.04 ○
43 10.70 388.22711 C26H29NO2 TAM-NO 1 40 0.60 4.83 ●/◙
44 11.77 374.21146 C25H27NO2 Demethyl-OH-TAM_5 2 40 0.65 0.38 ○
45 12.89 386.21146 C26H27NO2 OH-TAM-desat_2 2 40 0.44 0.07 ○
Abbreviations for metabolite identification: desat desaturated, OH hydroxylated, NO N-oxygenated, Gluc glucuronide,“white circles” never reported, “black circles” reported in animals or incubations only, “inverse white circle” reported in human plasma
Endoxifen (Z-isomers) at eight different levels ranging from 0.5 to 500, 0.2 to 200, 1 to 1,000, and 0.5 to 500 ng/mL whereas quality control samples (QCs) were spiked at 3, 50, 375, and 1.2, 20, 150, and 6, 100, 750, and 3, 50, 375 ng/mL, respectively. Patients’ plasma extracts were analyzed with the LC-TQ-MS system and a few months later re-extracted and analyzed with the LC-HR-MS system. Absolute quantifica-tions were compared between the two analyses. Detection sensitivity, robustness, and convenience were assessed. Qualitative analysis (metabolite identification)
The exact same HR-MS data used for the absolute quantifica-tion were reprocessed with Metworks 1.3 (Thermo, USA) for metabolite identification (Qual analysis). MassFrontier 6.0 (Thermo, USA) was used for the structure elucidation with the identification of fragment ions.
Two main strategies were employed for the identification of TAM metabolites. First, XIC (MEW=5 ppm) around the-oretical m/z values from 50 biotransformations predicted by Metworks software 1.3 SP2, were constructed (see also pub-lished list [28]). XIC of patients’ plasma extracts were com-pared with blank plasma and calibrant extracts. Secondly, a mass defect filtering (MDF) using Metworks software was applied and all ions that did not enter the MDF limits were removed. This MDF delimitation considered the mass defect and nominal m/z values of TAM metabolites discovered by the first strategy and was defined as a square between m/z 0.165 at m/z 250 (lower limits) and m/z 0.270 at m/z 600 (upper limits). The MDF-cleaned spectra of a patient’s chromatogram were checked visually scan by scan to reveal unexpected potential TAM metabolites and their m/z constructs were compared in patients’ and control plasma chromatograms.
For structure elucidation attempt of some identified TAM metabolites, additional LC-MS analyses were performed with a Q-Exactive HR-MS recording (true) MS2product ion spec-tra. Different collision energies were applied (see“Results”). Semi- and relative quantification of TAM metabolites After metabolite identification and confirmation, semi- and relative quantifications of TAM metabolites in the 20 patients’ plasma were assessed. Semiquantification is the estimation of metabolite levels in universal units (e.g., ng/mL) but within a large range (e.g., 0.1- to 10-fold accuracy) whereas relative quantification is the more or less precise determination of metabolites in arbitrary units.
With no pure standards of TAM metabolites, it is difficult to evaluate accurately the absolute levels. Nevertheless, semiquantification of TAM metabolites was estimated using the following equation applied to mean values: TAM metab-olite level (ng/mL)=((metabmetab-olite/TAM_IS peak area ratio) / (TAM/TAM_IS peak area ratio))×TAM absolute level.
The relative quantification was done with LC peak area ratios of TAM metabolites and IS. Metabolite/IS peak area ratios were calculated to reduce variability. The IS selec-tion for each TAM metabolite has been chosen based on chemical structure similarities and retention times (see Table1).
Statistics and bioinformatics data treatment
Passing–Bablok regression (PB) and Bland–Altman test (BA) have been used to assess the agreement between the two analytical methods for the absolute quantification. Assump-tions of linearity and normal distribution of differences, for respectively PB and BA, have been assessed. For BA analysis, due to the presence of proportional linear bias for some analytes, mean difference (bias) between measurement and limits of agreements were expressed as percentages of the absolute analytes concentrations and percent difference plots were used. Statistical analyses were performed using the MedCalc software, version 12.7 (MedCalc Software, Ostend, Belgium).
Multivariate analysis, including principal component anal-ysis (PCA) and Partial Least Squares (PLS) regression, was performed using SIMCA-P© v.13 (Umetrics, Sweden). PLS aims at building a linear multivariate model by determining an appropriate compromise between a synthetic description of the variables and a good correlation with the response. A leave-one-out cross-validation procedure was used to ensure the robustness of the PLS model and its generalization ability. For that purpose, the model was computed with data from 19 patients, leaving one subject out. The unseen sample was then predicted by the model. The process was repeated 20 times, once per subject. Model validity was further verified using permutation tests and CV-ANOVA.
Results
Absolute Quantification of TAM and three metabolites PB analysis performed on measured TAM levels, revealed the presence of a linear proportional bias (see Electronic supple-mentary material Fig. S1a and 1b). BA analysis shows the estimated bias (expressed as % of mean absolute concentra-tions of TQ and HR-MS) between the mehods and the lower and upper limits of agreements (LOA) for TAM, N-demethyl-TAM, 4-OH-N-demethyl-TAM, and endoxifen levels, which were 5.6 % (LOA,−12.3 and 25.5 %), −4.3 % (−25.4 and 10 %), −7.7 % (−27.9 and 19.2 %), and −6 % (−27.9 and 19.2 %), respec-tively (see Electronic supplementary material Fig.S1c).
Various minor differences in LC-MS conditions could putatively explain the acceptable bias between the anal-yses. Robust method-comparison experiment should be
conducted under exact similar method conditions with the same extracts and using a higher number of samples in replicates.
The sensitivity of the two technologies was also compared. The lowest levels detected were the first calibrants, 0.5, 0.2, 1, and 0.5 ng/mL, with the TQ-MS, and 1, 0.8, 2, and 1 ng/mL with the HR-MS for TAM, 4-OH-TAM, N-demethyl-TAM, and endoxifen, respectively. Thus, in our analysis, the Exactive Plus-HR-MS was two to four times less sensitive than the TSQ-Ultra-TQ-MS. In both analyses, QCs and calibrants accuracies were comparable. Calibration curves recorded by the LC-HR-MS show a behavior similar to the LC-TQ-MS.
In conclusion, our results confirm previous published data [19–21] showing that LC-HR-MS is fully capable of performing robust quantitative determinations in a productive environment.
Identification of TAM metabolites
Using the software dedicated to drug metabolism and its integrated list of predicted metabolites (m/z) to be extracted, we rapidly identified most TAM metabolites by comparing XIC from treated patients’ and control samples (Fig.1). We focused our comparison on two plasma samples showing the highest TAM levels (344 and 446 ng/mL). Over a day, we identified more than 40 potential TAM metabolites (LC peaks). With MSALLacquisitions, we confirmed most of our identifications by detecting TAM fragment ions that coeluted with the metabolite precursor ion. The tolerance on mass accuracy of the fragment ions was ±15 ppm (MSALL acquisi-tion was set at a lower resoluacquisi-tion=17,500). The fragmentaacquisi-tion of TAM in the HCD cell at 40 eV is presented in the Electronic supplementary material Fig.S2a, b.
The most intense marker ion of TAM and its metabolites was m/z=72.08078 corresponding to [C4H10N]
+
and was found in most metabolite MSALL spectra. Using chromato-grams and spectra cleaned by mass defect filtering, a few additional ions were detected as potential metabolites whereas they were not predicted. The last step of metabolite identifi-cation, consisting in measuring the correlation between TAM/IS and metabolite/IS LC peak area ratios, is given in Table1(see examples in Fig.2for ID no. 7, 8, 22, 25, 38, and 39). Metabolite candidates that were not correlated to TAM/IS ratio (R2< 0.1) were considered as false positives and discarded. By contrast, a metabolite candidate with a R2 >0.25 was identified with additional evidence. The best correlation was obtained with TAM-desat (ID no. 39; R2= 0.968), whereas the poorest value was observed with (Z)-endoxifen (ID no. 25; R2= 0.305) (Table1; Fig.2), a me-tabolite whose formation is known to be controlled by CYP2D6 activity.
Identification of TAM metabolites were considered as “confirmed” only if the three following criteria were fulfilled: (i) mass accuracy between measured and theoretical m/z< ±3 ppm; (ii) positive correlation (R2>0.1) between TAM metabolite/IS and TAM/IS ratios; and (iii) presence of ≥2 fragment ions (MSALL or MS2 acquisition), with a mass accuracy of less than ±15 ppm, identical to TAM or bearing the metabolic change and coeluting with the precursor ion or (iv) a fine isotopic distribution corresponding to the metabo-lite chemical composition (e.g.,34S vs.13C2).
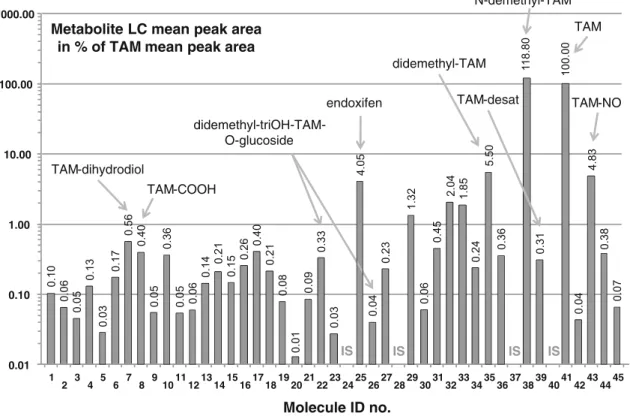
Summarizing the results of the above investigations, Ta-ble1shows all identified TAM metabolites detected in plasma extracts and present in at least eight patients (≥40 %). Simi-larly, Fig.1shows the mean of 40 metabolite LC peak area relatively to TAM mean area (in %) on a log-scale represen-tation. Additional putative metabolites were detected (e.g., hydroxy-methoxy-TAM, demethyl-TAM-COOH and addi-tional isomers of some metabolites depicted in Table1) but were below the detection limit in most patients (>12/20) with our sample preparation and not considered further.
Examples of metabolite identification with the Exactive Plus and Q-Exactive analyses are depicted in the Electronic supplementary material Fig.S3a–e. MS2spectra with frag-ment ions and metabolite structure proposals of TAM-COOH (ID no. 8), TAM-desat (ID no. 39), and TAM-dihydrodiol (ID no. 7) as well as the fine isotopic distribution of OH-TAM-sulfate at A+2 (m/zmonoisotopic+2 U=m/z 470; ID no. 20) confirming the presence of a sulfur atom [29], are depicted.
In Fig.3a,b, we describe the identification of three putative glucose conjugates, namely two trihydroxy-TAM-glucosides (ID no. 22 and 26) and one didemethyl-tetraOH-TAM-glucoside (ID no. 5). These glucosides have never been described and were revealed in MDF cleaned spectra (see Electronic supplementary material Fig.S4a, b). Key information to identify their chemical composition was the capability to establish the absence of a sulfur atom using the fine isotopic distribution (Fig.3a). This information re-duced significantly the chemical composition possibilities. Taking metabolite no. 22 as a case in point, Fig.3achallenges two possible chemical compositions, with or without a sulfur atom (which would derive from an initial glutathione conju-gate): [C37H34ON2S]+ and [C30H36O9N]+. The theoretical isotopic distribution of these two compositions is depicted for A+2 (m/zmonoisotopic+2 U). A resolution of >75,000 is sufficient to dissociate the two chemical compositions (m1 and m2) with a partial overlapping (resolution= 1.5× [m1/ │(m1–m2)│]; see [22]). Figure 3bshows the fragmentation pathways of one of the possible regioisomeric structures of metabolite no. 22. Its fragmentation is very different from that of TAM (see Electronic supplementary material Fig.S2a) due to the proton location: on the tertiary amine for TAM and on the glucosyl moiety for the glucoside. While neither their positions of hydroxylation nor the point of attachment of the
glucose moiety (on the –NH2or an –OH group) could be ascertained with the methodologies used, one can nevertheless note that metabolites no. 22 and 26 correspond to six biotrans-formation steps, whereas the more polar metabolite no. 5 (see Electronic supplementary material Fig.S3a) corresponds to seven steps.
To the best of our knowledge, many of the TAM metabo-lites reported herein have never been detected before in pa-tients’ plasma even if some were described in vitro or in animals, e.g., TAM-dihydrodiol and TAM-OH-sulfate (see ID no. 7 and in ID no. 20 in Table1).
From our previous established retention time with pure standards [27] and from literature [16,18,30], we have fully identified eight metabolites, whereas in most cases absolute configuration of identified TAM metabolites could not be established (Table1).
Other metabolites were never reported, namely: OH-TAM-COOH (ID no. 14), N-demethyl-TAM-desat (ID no. 36), TAM-desat (ID no. 39), OH-TAM-desat (ID no. 42, 45), and the three glucosides (ID no. 5, 22, and 26). The characteriza-tion of these new metabolites in patients’ plasma owes much to the high sensitivity and selectivity of HR-FS and the ease to trace potential metabolites with XIC constructions.
The four desaturated metabolites were identified from their loss of m/z = 2, most likely at the end of the–CH2CH3 side-chain, a CYP-catalyzed reaction energetically
favorable when the double bond so created is conjugated with an aromatic system, as is the case here [31]. As for glucosyl conjugates, they are seldom reported compared with glucuronides, but their existence has been known since decades [32,33]. Their formation involves the cofac-tor uridine-diphosphate glucose (UDP-glucose) and is cat-alyzed by UDP-glucuronosyltransferases (UGTs) [34]. Glucosylation has been shown to occur at alcoholic, phe-nolic and carboxylic–OH groups to yield O-glucosides and at amido and amino groups to yield N-glucosides [32–36]. In our case, glucosylation could have occurred at one of the hydroxy groups or at the primary amino group. It is also remarkable that the glucosides were produced by six and seven metabolic steps while remaining well above the de-tection limit.
Semi- and relative quantification of TAM metabolites The absolute quantification of 40 metabolites by LC-MS analysis appears to be unrealistic and to a large extend useless. However, a relative quantification of TAM metabolites (in arbitrary units), if precise (less than ±30 %), can be used to establish various associations between metabolite levels and side-effects or treatment efficacy. Such associations are key when one or a few metabolites are suspected to contribute to
0.01 0.10 1.00 10.00 100.00 1'000.00 1 2 3 4 5 6 7 8 9101112131415161718192021222324252627282930313233343536373839404142434445 IS IS IS IS N-demethyl-TAM TAM endoxifen TAM-dihydrodiol didemethyl-triOH-TAM-O-glucoside Molecule ID no. TAM-COOH didemethyl-TAM TAM-NO TAM-desat
Metabolite LC mean peak area in % of TAM mean peak area
Fig. 1 Mean peak area of TAM metabolites relatively to TAM mean area (in %; N=8 to 20 patients). Molecules are defined by their ID number presented in Table1. The mean absolute concentration of TAM was
208 ng/mL. The lowest metabolite (ID no. 20) represented 1/10,000 of TAM peak area. Log-scale representation
clinical events. This is the main goal of these metabolite relative quantifications.
In LC-MS analysis, the detection intensity of a compound is depending on its ionization yield and on the matrix effect at its retention time, both depending on sample cleanup and LC-MS. Using constant extraction procedure and LC-MS param-eters, the ionization yield can be considered as similar be-tween samples especially when weighted by internal standards.
Matrix effect was evaluated in our method with postcolumn infusion of TAM, 4-OH-TAM, N-demethyl-TAM, and endoxifen [27]. Water and different plasma extracts showed a low difference and low variability of matrix effects for TAM, 4-OH-TAM, and endoxifen with less than or equal to ±20 % during the entire chromatogram (1 to 13 min). When IS were permuted in our relative quantifications (e.g.,
metaboliteID no. 7/ISID no. 24vs. metaboliteID no. 7/ISID no. 40, etc.), no significant impact on relative quantification was observed (40 linear regressions gave determination coeffi-cients (R2)≥0.977; mean=0.990±0.005; see typical correla-tions in Electronic supplementary material Fig. S5a). The precision of the relative quantification (determined area ratios vs. predicted ratios from the correlations; N=380), remains between 85 and 117 %. Previous results [37] obtained with similar sample preparation and LC conditions showed low impact of matrix effects on relative quantification. Taking into account the precision (less than ±20 %) of our relative deter-mination of TAM metabolites, data were processed further.
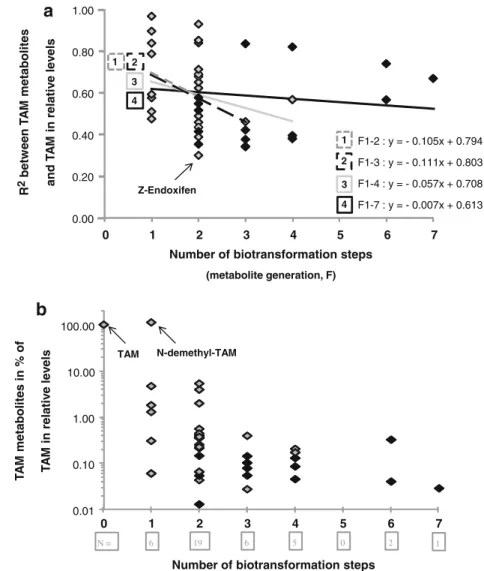
Relations between relative levels of TAM metabolites and TAM (TAM metabolite/IS against TAM/IS peak area ratios) for each metabolite gave various information. Indeed, R2 values decreased with the number of biotransformation steps
R
²
= 0.463 0.00 0.05 0.10 0.15 0.20 0.25 0.000 5.00 10.00 15.00 R²
= 0.346 0.00 0.05 0.10 0.15 0.20 0.25 0.00 5.00 10.00 15.00 R²
= 0.570 0.00 0.05 0.10 0.15 0.20 0.25 0.00 5.00 10.00 15.00 R²
= 0.305 0.0 0.2 0.4 0.6 0.8 1.0 1.2 1.4 1.6 1.8 2.0 0.00 5.00 10.00 15.00 R²
= 0.968 0.00 0.01 0.02 0.03 0.04 0.05 0.00 5.00 0.000 15.00 T A M -di hy drodi ol /I S T A M -COOH DiOH-D-T A M -O-glucoside_ 1/IS endoxifen T A M-desat/IS TAM/IS TAM/IS TAM/IS TAM/IS TAM/IS R²= 0.897 0 2 4 6 8 10 12 14 16 18 20 0.00 5.00 10.00 15.00 N-D-T A M /IS TAM/ISa
b
c
d
e
f
Fig. 2 Determination coefficient (R2) between six metabolites/IS
(ID no. 7, 8, 22, 25, 38, and 39 (a to f)) and TAM/IS peak area ratios (N≥8). Each diamond represents a metabolite/TAM ratio in a single patient. Correlations of endoxifen or TAM-desat with TAM show the lowest and highest R2values of all TAM metabolites. Table1
depicts the R2values for all identified metabolites
(= metabolite generation, F, see Fig.4a), indicating increased inter-patient variability in metabolite production with the im-plication of additional metabolizing enzymes. The decrease of R2 values was less pronounced when considering F1–F4 (linear equation; slope=−0.057) rather than F1–F2 or F1–F3 (slope=−0.105 and −0.111, respectively). This decrease was
almost abolished when all metabolite generations, F1 to F7, were taken into account (linear equation; slope =−0.007; Fig.4a). This observation could be explained by the fact that F4–F7 metabolites were produced by the same enzymes than the F1, F2, and F3 metabolites, and/or that F4–F6 metabolites were produced from previous metabolite generations in a sort 556.220 556.230 556.240 556.250 556.260 556.270
m/z
Proposal no. 1 with sulfur : A = [C37H34ON2S]+ m/z theor.= 554.23864
RIA meas. / theor.= 100%
554.2 555.2 556.2 m/z Relativ e A bundance 555.24227 556.24525 554.23888 RIA theor.= 32.5% RIA meas.= 32.3% RIA theor.= 5.1 + 1.9% RIA meas.= 5.7% FTMS + p ESI Full ms [200-600] 0 10 100 m/z meas= 556.24525 A + 2
Spectrum from HR-FS acquisitions (N=10; Rs = 85,000 at m/z = 556)
20 30 40 50 60 70 80 90 Relat iv e A b un dance (%)
a
0 10 20 30 40 50 60 70 80 90 100 R elativ e A b undance (% ) m/z theor. = 556.24270Proposal no. 2 : no sulfur: A = [C30H36O9N]+ m/z theor= 554.23846
m/z theor. = 556.24517 A + 2 = C2813C2H36O9N A + 2 = C30H36O818ON A + 2 = [C37H34ON234S]+ A + 2 = [C3513C2H34ON2S]+ 0 10 20 30 40 50 60 70 80 90 100 Relat iv e A b undance (%) m/z theor.= 556.24535 m/z theor.= 556.23443 Rmin: 100,000 Rmin: 450,000
Fig. 3 Identification of TAM glucose conjugate metabolites measured at m/z 554.23888. (a) Two possible chemical compositions, [C37H34ON2S]+
and [C30H36O9N]+, show mass accuracy (MA)=+0.4 and +0.8 ppm,
respectively. The chemical composition was elucidated with the fine isotopic distribution of (A+2) corresponding to the theoretical distribu-tions depicted as Proposals 1 and 2. The minimum resolution (Rmin) to
resolve completely [C37H34ON234S]+ and [C3513C2H34ON2S]+ or
[C2813C2H36O9N]+or [C30H36O818ON]+is 100,000 and 450,000,
respec-tively. Bottom, (A+2) spectrum. HR-MS resolution were set up at 140,000 (at m/z=200) that corresponds to 85,000 at m/z 556 (measured resolu-tion). This is sufficient to conclude to the absence of a sulfur atom in this
chemical composition. The insert (bottom right) shows the m/zmonoisotopic,
A, A+1, and A+2 of this metabolite measured in full-scan spectra. The measured and theoretical relative isotopic abundance (RIA) values are given. (b) One of the possible regioisomers (hydroxylation and glucose attachment sites) corresponding to the composition C30H36O9N and to the
proposed fragmentation pathway from HR-MS2product scan. Abbrevi-ations: i inductive cleavage, Lib fragmentation predicted using a library reaction,π ionization on pi bonds, rHBcharge site rearrangement (α,β),
rHCcharge site rearrangement (γ), rHRcharge remote rearrangement.
Additional information is given in the Electronic supplementary material
of production line of various metabolizing enzymes associated on the endoplasmic reticulum membrane. When the relative concentrations of TAM metabolites, expressed in percent of TAM levels ((TAM metabolite/IS mean peak area ratios) / (TAM/IS mean peak area ratios)), were plotted against metab-olite generation, they decreased from F1 to F3 but remained constant from F3 to F4 (Fig.4b).
In a global perspective, Fig. 4a, b underscores the importance to study in vivo drug metabolism and ther-apeutic monitoring beyond the usual first- or second-generation metabolites, as the formation to toxic/reactive metabolites is by far not restricted to the first metabolic steps [17].
Without pure standards, the semiquantitative estimation of drug metabolites can be realized by comparing UV and MS signals [6]. This can be difficult when small amounts of metabolites prevent good UV detection, or when biotransfor-mation strongly modifies UV absorbance. In this study, we have estimated the absolute level of TAM metabolites based on peak areas and TAM absolute mean level (see“Materials
and methods” for the equation). In the Electronic supplemen-tary material Fig.S5b, eight metabolite levels were given in percent of TAM absolute levels (this work and [30]) or in percent of TAM peak area. The maximum difference between these two calculations was observed with didemethyl-TAM (ID no. 35). In this case, didemethyl-TAM mean level was 5-fold underestimated when considering the relative quantifica-tion rather than the absolute levels. This is due to a lower attraction of H+ for the primary amino group (didemethyl-TAM) compared with the tertiary amino group ((didemethyl-TAM) and a lower ionization yield. The absolute levels of the seven other metabolites were only slightly underestimated by their peak area: mean=−40 % (from −80 to −10 %) (see Electronic supplementary material Fig.S5b). As most new metabolites detected in our samples show peak area between 0.1 and 1 % of TAM peak area (Fig.1; Table1), we can estimate that these metabolites are probably in the range of 0.2 to 2 ng/mL of plasma (corresponding to 0.1–1 % of TAM absolute mean level in this study). According to the blood concentrations of known toxic compounds listed by the International
O O O H O Lib, i Lib m/z 141.01824 = C6H5O4+ Lib m/z 73.02841 = C3H5O2+ , rHR, i, Lib m/z 145.06479 = C10H9O + +H+ , Lib m/z 107.04914 = C7H7O + • O H O Lib, rHR m/z 95.01276 = C5H3O2+ , Lib, rHC m/z 267.13796 = C18H19O2+ rHB, Lib, i rHB, Lib, rHB, Lib O H m/z 71.01276 = C3H3O2+ O O m/z 227.10666 = C15H15O2+ N 2H O H O O O H O H O H O H O O H O O H OH O O H m/z 554.23846 = C30H36O9N + Lib TAM : C15H13O TAM : C18H17O TAM : C10H9 TAM : C7H7 O m/z 361.17982 = C24H25O3+ O OH m/z 427.19039 = C28H27O4+ rHB, Lib, i X X C3H8N+ m/z= 58.06513 C4H10N+ m/z= 72.08078 N N C4H8N+ m/z= 70.06513 N m/z 526.24354 = C29H36O8N + O 2H O O H O H O H O H rHB, Lib
b
O OH OH O OH OH O O O OH O H • N 2H NH2 • O H Fig. 3 (continued)Association of Forensic Toxicologists (http://www.tiaft.org/) [38,39], the TAM metabolite levels estimated in this work are comparable to those of many compounds that show toxicity at very low concentrations (clenbuterol, digoxin, fentanyl, etc.). Such a comparison underscores that drug metabolites, even at low levels, can have an impact on human body homeostasis and that, when needed, clinical investigations should associate plasma metabolite concentrations with drug toxicity or efficacy.
Statistics and bioinformatics data treatment
Multivariate analysis was performed to provide an overall picture of the drug metabolism events occurring after TAM administration, by accounting for all the information provided by the 40 measured metabolites. In order to highlight charac-teristic metabolic patterns related to TAM plasma values, the TAM relative concentration was used as a response vector to be predicted as a linear combination of its metabolites using a
PLS regression model. A PLS model with three latent vari-ables fitted the dataset well, as shown by the high R2value (R2=0.97), and was selected as the optimal model size ac-cording to prediction ability evaluated by leave-on-out cross-validation (Q2=0.92, CV-ANOVA; p<0.01). The distribution of the samples on the PLS score plot revealed a clear separa-tion of the patients on the first latent variable according to the TAM dose administered, i.e., patients with a single (20 mg) or double daily dose (40 mg; data not shown). This underlines the strong effect of the dose on the measured metabolites relative concentrations (see also the correlation coefficients in Table 1). This influence was confirmed by the loadings examination, as all metabolite concentrations were increased for patients receiving a double dose compared with the single dose group (data not shown). The observed vs. predicted plot (Fig.5a) highlighted a clear trend caused by the TAM dose but additional inter-individual variabilities resulted in a well-balanced continuous distribution of TAM plasma values. The Variables Importance in Projection (VIP) scores were
0.01 0.10 1.00 10.00 100.00 0 1 2 3 4 5 6 7 T A M metabolites in % of T A M in relativ e lev e ls
Number of biotransformation steps (metabolite generation, F) 0.00 0.20 0.40 0.60 0.80 1.00 0 1 2 3 4 5 6 7 F1-2 : y = - 0.105x + 0.794 F1-3 : y = - 0.111x + 0.803 F1-4 : y = - 0.057x + 0.708 F1-7 : y = - 0.007x + 0.613 1 3 4 1 3 4 R 2betw ee n T A M metabolites and T A M in relativ e lev e ls
Number of biotransformation steps (metabolite generation, F) 2 2 TAM
a
b
6 19 6 5 0 2 1 N-demethyl-TAM Z-Endoxifen N = Fig. 4 (a) Determinationcoefficient (R2) between relative
levels of TAM metabolites and TAM (TAM metabolite/IS vs. TAM/IS peak area ratios; see Fig.2) against metabolite generation (F). Each diamond represents the R2value for a given metabolite. Trend line equations taking into account different F are depicted. (b) TAM metabolite relative levels for each metabolite (TAM metabolite/IS peak area mean in percent of and TAM/IS peak area mean) vs. metabolite generation, F. Log-scale representation. The number of TAM metabolites per generation is shown in the boxes beneath the plot. Open and filled diamonds stand for phases I and II metabolites, respectively. (E)-Tam is not depicted because it could be produced by chemical or enzymatic isomerization (F0 or F1, respectively)
then investigated to highlight characteristic metabolites related to the TAM level response. A VIP score greater than 1 indicates a potentially important variable in the model considered. As shown in Fig. 5b, the highest VIP scores were obtained for TAM_desaturated (1.31), OH-demethyl-TAM_1 (1.27), and N-demethyl-TAM (1.25). Therefore, the most characteristic metabolites of the TAM plasma concentrations could be highlighted (see also R2 values in Table 1).
To circumvent the major source of variability related to the dose when investigating the whole set of measured metabo-lites, a subset of 32 metabolites ratios was selected based on possible sequential biotransformation. This biologically driv-en selection aimed at uncovering metabolic patterns associat-ed with CYP2D6 enzymatic activity. Thus, a PCA model was then computed to assess patients’ groupings with respect to their CYP2D6 genotypes. A trend separating poor, intermedi-ate, extensive and ultra metabolizers is depicted on the first
d
Substrate metabolite ratios PC1 Loading N-demethyl-TAM Z-Endoxifen 0.301 4'-OH-TAM TAM-dihydrodiol 0.296 α-OH-TAM di-OH-TAM_3 0.267 4'-OH-TAM di-OH-TAM_3 0.252 TAM TAM-dihydrodiol 0.250 α-OH-TAM TAM-dihydrodiol 0.249 α-OH-TAM di-OH-TAM_1 0.238 α-OH-TAM TAM-COOH 0.224 α-OH-TAM di-OH-TAM_2 0.218 4'-OH-TAM di-OH-TAM_1 0.214 N-demethyl-TAM Demethyl-OH-TAM 0.194 TAM 4-OH-TAM 0.191 … …a
b
c
Observed TAM Predicted T A M 0 2 4 6 8 10 12 14 16 0 2 4 6 8 10 12 14 16 PC2 -10 -8 -6 -4 -2 0 2 4 6 8 -10 -8 -6 -4 -2 0 2 4 6 8 EM IM PM UM PC1 10 10 0.0 0.2 0.4 0.6 0.8 1.0 1.2 1.4 1.6 1.8 2.0 VIPFig. 5 PLS regression model relating plasma levels TAM to the 40 measured metabolites: (a) Observed vs. predicted plot. Patients with a single dose (20 mg) are symbolized by open triangles and patients with a double dose (40 mg) by filled triangles; (b) VIP plot. PCA Model based on
32 selected metabolic ratios (PC1 (30.3 %) vs. PC2 (19.8 %)); (c) Score plot. Symbols are related to CYP2D6 genotypes: poor, intermediate, extensive, and ultra-rapid metabolizers (PM, IM, EM, and UM, respec-tively); (d) List and values of the most contributing variables to PC1
O- or N-glucuronidation O- or N-glucosylation O-sulfation a) N-demethylation b) N-oxygenation c) O-dealkylation d) oxidation to phenol e) oxidation to phenol, dihydrodiol or catechol f) hydroxylation to alcohol g) oxidation to carboxylate h) desaturation
a
c
b
d
e
f
f
h
g
e
C H3 O N CH3 CH3Fig. 6 Overview of tamoxifen biotransformations reflected in the circulating metabolites observed in chronically treated patients
principal component, as presented on Fig.5c. Even if princi-pal components correspond to directions maximizing the var-iance without any objective of class separation, the selection of biologically relevant metabolic ratios allowed the effects of the CYP2D6 genotypic diversity to be highlighted as the major source of variability in the reduced dataset (30.3 % of the initial variance). Metabolites ratios were then associated with either poor/intermediate or extensive/ultra genotypes according to their position on the loading plot (data not shown). Interestingly, the 12 most distinctive ratio character-izing extensive and ultra metabolizers were related to 4 com-pounds, namely TAM, N-demethyl-TAM,α-OH-TAM, and 4′-OH-TAM (Fig. 5d). While the two first are known CYP2D6 substrates, these results suggest that α-OH-TAM and 4′-OH-TAM may also be biotransformed in vivo by CYP2D6. This example with TAM metabolism shows that extended drug-metabolite profiling could be applied to most drug deserving similar investigations (e.g., when a metabolite-related ADR is suspected).
Discussion and perspectives
The advantage of HR-MS allowed us to study in greater depth and with better convenience TAM metabolites in patients in parallel with the quantification of TAM and its metabolites. Such a Quan/Qual analysis could be of potential utility in in vivo drug metabolism and pharmacovigilance studies in order to reach broader insights in inter-patient drug biotrans-formation profile and relate metabolite concentrations with toxicity.
Some metabolites were detected for the first time in pa-tients’ plasma whereas others had never been described be-fore. Thus, putative trihydroxy- and didemethyl-tetrahydroxy-TAM-glucoside conjugates were identified, im-plying six and seven biotransformation steps, respectively. It is noteworthy to mention that glucosides are seldom reported in the literature compared with glucuronides. This finding underscores the potential need to determine metabolites formed by more than the usual one, two or three biotransfor-mation steps in subpopulation showing specific events. The overview of TAM biotransformations found in this study is depicted in Fig.6.
Metabolites are known to play an important role in drug toxicity, particularly chemically reactive ones, but the assess-ment of their impact in drug-related side effects has been somewhat neglected due to the considerable time and effort needed with previous MS technologies. Using the latest HR-MS techniques, this situation should evolve and allow an easier access to the production of late-generation metabolites with a view to reaching a more comprehensive understanding of the relation between metabolites and adverse effects in
patients with particular genetic traits, life style, and environ-mental exposure.
Acknowledgments The authors are thankful to Drs. Anton Kaufmann and Olaf Scheibner for fruitful discussions on the Exactive Plus-HR-MS instrument to Prof. Laurent Décosterd for laboratory issues and Dr. Hugues Henry for his kind help with laboratory and software issues.
Conflict of interest statement The authors have no conflicting finan-cial interests.
References
1. Committee on Quality of Health Care in America To Err Is Human (2000) Building a Safer Health System. In: Kohn LT, Corrigan JM, Donaldson MS (eds) National Academy Press. Washington, DC 2. Preventable Adverse Drug Reactions: A Focus on Drug Interactions.
U.S. Food and Drug Administration. Accessed 30 Oct. 2013.http:// w w w. f d a . g o v / d r u g s / d e v e l o p m e n t a p p r o v a l p r o c e s s / developmentresources/druginteractionslabeling/ucm110632.htm
3. Gautier S, Bachelet H, Bordet R, Caron J (2003) The cost of adverse drug reactions. Expert Opin Pharmacother 4:319–326
4. U.S. Food and Drug Administration. Guidance for Industry: Safety Testing of Drug Metabolites. Accessed 30 Oct. 2013.http://www.fda. gov/downloads/Drugs/GuidanceComplianceRegulatoryInformation/ Guidances/ucm079266.pdf
5. International Conference on Harmonisation. Guidance on non-clinical safety studies for the conduct of human non-clinical trials and marketing authorization for pharmaceuticals M3(R2). Accessed 30 Oct 2013. http://www.fda.gov/downloads/Drugs/ GuidanceComplianceRegulatoryInformation/Guidances/ ucm073246.pdf
6. Gao H, Obach RS (2011) Addressing MIST (Metabolites in Safety Testing): bioanalytical approaches to address metabolite exposures in humans and animals. Curr Drug Metab 12:578–586
7. Testa B, Krämer SD (2009) The biochemistry of drug metabolism— an introduction: part 5. Metabolism and bioactivity. Chem Biodivers 6:591–684
8. Stachulski AV, Baillie TA, Kevin Park B, Scott Obach R, Dalvie DK, Williams DP, Srivastava A, Regan SL, Antoine DJ, Goldring CE, Chia AJ, Kitteringham NR, Randle LE, Callan H, Castrejon JL, Farrell J, Naisbitt DJ, Lennard MS (2013) The generation, detection, and effects of reactive drug metabolites. Med Res Rev 33:985–1080 9. Guengerich FP (2011) Mechanisms of drug toxicity and relevance to pharmaceutical development. Drug Metab Pharmacokinet 26:3–14 10. Krämer SD, Testa B (2008) The biochemistry of drug metabolism—
an introduction: part 6. Inter-individual factors affecting drug metab-olism. Chem Biodivers 5:2465–2578
11. Krämer SD, Testa B (2009) The biochemistry of drug metabolism— an introduction: part 7. Intra-individual factors affecting drug metab-olism. Chem Biodivers 6:1477–1660
12. The importance of pharmacovigilance. Safety Monitoring of medic-inal products. World Health Organization 2002http://apps.who.int/ medicinedocs/pdf/s4893e/s4893e.pdf
13. Johnson MD, Zuo H, Lee KH, Trebley JP, Rae JM, Weatherman RV, Desta Z, Flockhart DA, Skaar TC (2004) Pharmacological character-ization of 4-hydroxy-N-desmethyl tamoxifen, a novel active metab-olite of tamoxifen. Breast Cancer Res Treat 85:151–159
14. Goetz MP, Rae JM, Suman VJ, Safgren SL, Ames MM, Visscher DW, Reynolds C, Couch FJ, Lingle WL, Flockhart DA, Desta Z, Perez EA, Ingle JN (2005) Pharmacogenetics of tamoxifen
biotransformation is associated with clinical outcomes of efficacy and hot flashes. J Clin Oncol 23:9312–9318
15. Rochat B (2005) Role of cytochrome P450 activity in the fate of anticancer agents and in drug resistance: focus on tamoxifen, pacli-taxel and imatinib metabolism. Clin Pharmacokinet 44:349–366 16. Teunissen SF, Rosing H, Seoane MD, Brunsveld L, Schellens JH,
Schinkel AH, Beijnen JH (2011) Investigational study of tamoxifen phase I metabolites using chromatographic and spectroscopic analyt-ical techniques. J Pharm Biomed Anal 55:518–526
17. Testa B, Pedretti A, Vistoli G (2012) Reactions and enzymes in the metabolism of drugs and other xenobiotics—a meta-analysis of the primary literature. Drug Discov Today 17:549–560
18. Teunissen SF, Rosing H, Schinkel AH, Schellens JH, Beijnen JH (2010) Bioanalytical methods for determination of tamoxifen and its phase I metabolites: a review. Anal Chim Acta 683:21–37 19. Kaufmann A, Butcher P, Maden K, Walker S, Widmer M (2011)
Quantitative and confirmative performance of liquid chromatography coupled to high-resolution mass spectrometry compared to tandem mass spectrometry. Rapid Commun Mass Spectrom 25:979–992 20. Henry H, Sobhi HR, Scheibner O, Bromirski M, Nimkar SB, Rochat
B (2012) Comparison between a high-resolution single-stage Orbitrap and a triple quadrupole mass spectrometer for quantitative analyses of drugs. Rapid Commun Mass Spectrom 26:499–509 21. Ramanathan R, Korfmacher W (2012) The emergence of
high-resolution MS as the premier analytical tool in the pharmaceutical bioanalysis arena. Bioanalysis 4:467–469
22. Rochat B, Kottelat E, McMullen J (2012) The future key role of LC-high-resolution-MS analyses in clinical laboratories: a focus on quantification. Bioanalysis 4:2939–2958
23. Kaufmann A, Butcher P, Maden K, Walker S, Widmer M (2010) Comprehensive comparison of liquid chromatography selectivity as provided by two types of liquid chromatography detectors (high resolution mass spectrometry and tandem mass spectrometry)“where is the crossover point?”. Anal Chim Acta 673:60–72
24. Rochat B (2012) Quantitative/qualitative analysis using LC-HRMS: the fundamental step forward for clinical laboratories and clinical practice. Bioanalysis 4:1709–1711
25. FDA Adverse Event Reporting System (FAERS) and European data-base of suspected adverse reaction reports. Human Drug Information. Division of Drug Information (CDER). Accessed 30 Oct. 2013.http:// www.fda.gov/Drugs/GuidanceComplianceRegulatoryInformation/ Surveillance/AdverseDrugEffects/default.htm
26. European Medicines Agency. Accessed 30 Oct. 2013.http://www. ema.europa.eu/docs/en_GB/document_library/Press_release/2012/ 05/WC500127957.pdf http://www.adrreports.eu
27. Dahmane E, Mercier T, Zanolari B, Cruchon S, Guignard N, Buclin T, Leyvraz S, Zaman K, Csajka C, Decosterd LA (2010) An ultra
performance liquid chromatography-tandem MS assay for tamoxifen metabolites profiling in plasma: first evidence of 4′-hydroxylated metabolites in breast cancer patients. J Chromatogr B Anal Technol Biomed Life Sci 878:3402–3414
28. Anari MR, Sanchez RI, Bakhtiar R, Franklin RB, Baillie TA (2004) Integration of knowledge-based metabolic predictions with liquid chromatography data-dependent tandem mass spectrometry for drug metabolism studies: application to studies on the biotransformation of indinavir. Anal Chem 76:823–832
29. Chen G, Yin S, Maiti S, Shao X (2002) 4-hydroxytamoxifen sulfation metabolism. J Biochem Mol Toxicol 16:279–285
30. Mürdter TE, Schroth W, Bacchus-Gerybadze L, Winter S, Heinkele G, Simon W, Fasching PA, Fehm T, German Tamoxifen and AI Clinicians Group, Eichelbaum M, Schwab M, Brauch H (2011) Activity levels of tamoxifen metabolites at the estrogen receptor and the impact of genetic polymorphisms of phase I and II enzymes on their concentration levels in plasma. Clin Pharmacol Ther 89:708– 717
31. Testa B, Krämer SD (2007) The biochemistry of drug metabolism— an introduction. Part 2: redox reactions and their enzymes. Chem Biodivers 4:257–405
32. Tang BK (1990) Drug glucosidation. Pharmacol Ther 46:53–56 33. Testa B, Krämer SD (2008) The biochemistry of drug metabolism—
an introduction. Part 4: reactions of conjugation and their enzymes. Chem Biodivers 5:2171–2336
34. Bock KW (2003) Vertebrate UDP-glucuronosyltransferases: functional and evolutionary aspects. Biochem Pharmacol 66: 691–696
35. Tang C, Hochman JH, Ma B, Subramanian R, Vyas KP (2003) Acyl glucuronidation and glucosidation of a new and selective endothelin ETAreceptor antagonist in human liver microsomes. Drug Metab
Dispos 31:37–45
36. Bowersox SS, Lightning LK, Rao S, Palme M, Ellis D, Coleman R, Davies AM, Kumaraswamy P, Druzgala P (2011) Metabolism and pharmacokinetics of naronapride (ATI-7505), a serotonin 5-HT4
receptor agonist for gastrointestinal motility disorders. Drug Metab Dispos 39:1170–1180
37. Rochat B, Fayet F, Widmer N, Lahrichi S, Pesse B, Décosterd L, Biollaz J (2008) Imatinib metabolite profiling in parallel to imatinib quantification in plasma of treated patients using Liquid chromatog-raphy–mass spectrometry. J Mass Spectrom 43:736–752
38. Schulz M, Iwersen-Bergmann S, Andresen H, Schmoldt A (2012) Therapeutic and toxic blood concentrations of nearly 1,000 drugs and other xenobiotics. Crit Care 16:R136–R140
39. The International Association of Forensic Toxicologists. Accessed 30 Oct. 2013. http://www.gtfch.org/cms/images/stories/Updated_ TIAFT_list_202005.pdf

![Fig. 3 Identification of TAM glucose conjugate metabolites measured at m/z 554.23888. (a) Two possible chemical compositions, [C 37 H 34 ON 2 S] + and [C 30 H 36 O 9 N] + , show mass accuracy (MA)=+0.4 and +0.8 ppm, respectively](https://thumb-eu.123doks.com/thumbv2/123doknet/14810496.611042/9.892.168.647.100.630/identification-conjugate-metabolites-measured-possible-chemical-compositions-respectively.webp)