DOI 10.1007/s00221-009-2108-7
R E S E A R C H A R T I C L E
Motor and non-motor error and the in
Xuence of error magnitude
on brain activity
Karin Graziella Nadig · Lutz Jäncke · Roger Lüchinger · Kai Lutz
Received: 8 July 2009 / Accepted: 17 November 2009 / Published online: 6 December 2009 © Springer-Verlag 2009
Abstract It has been shown that frontal cortical areas increase their activity during error perception and error processing. However, it is not yet clear whether perception of motor errors is processed in the same frontal areas as perception of errors in cognitive tasks. It is also unclear whether brain activity level is inXuenced by the magnitude of error. For this purpose, we conducted a study in which subjects were confronted with motor and non-motor errors, and had them perform a sensorimotor transformation task in which they were likely to commit motor errors of diVer-ent magnitudes (internal errors). In addition to the inter-nally committed motor errors, non-motor errors (external
errors) were added to the feedback in some trials. We
found that activity in the anterior insula, inferior frontal gyrus (IFG), cerebellum, precuneus, and posterior medial frontal cortex (pMFC) correlated positively with the magni-tude of external errors. The middle frontal gyrus (MFG) and the pMFC cortex correlated positively with the magni-tude of the total error fed back to subjects (internal plus
external). No signiWcant positive correlation between inter-nal error and brain activity could be detected. These results
indicate that motor errors have a diVerential eVect on brain activity compared with non-motor errors.
Keywords Sensorimotor transformation task · Error perception · fMRI · Internal model · Posterior medial frontal cortex
Introduction
Imagine yourself playing tennis. You throw the ball into the air, hit the ball and observe where it hits the ground. Throwing the ball, hitting it and monitoring the conse-quences are typical components of sensorimotor transfor-mation tasks. The ball may hit the ground exactly where you wanted it to, although other outcomes are also possible. The ball may hit the ground right next to the planned spot, or could hit the ground way oV the mark. There are several possible causes for such misses. A failure in precision may be due to an inappropriate movement by the agent. Alterna-tively, the ball’s Xight trajectory may have been changed (e.g. by a squall) even though the executed movement may have been fully appropriate. In the Wrst case, the cause of the failure lies with the agent (self caused error, from now on called “internal error”), while in the second case, the cause lies with the agent’s environment (externally caused error, from now on called “external error”). In most real-world situations, however, the failure will be due to a mixture of both, say a suboptimal motor action plus an additional external distortion. In any case of an error, by deWnition the intended goal does not agree with the achieved state.
The capacity to detect errors, i.e. to compare intended with actual outcome has been termed error or performance
monitoring (Botvinick et al. 2001), and its neural correlates have received great attention in cognitive neuroscience. Studies on error detection in cognitive tasks (e.g. Xanker tasks) have consistently reported activation of prefrontal K. G. Nadig (&) · L. Jäncke · K. Lutz
Department of Neuropsychology, University of Zurich, Binzmühlestrasse 14/25, 8050 Zurich, Switzerland e-mail: k.nadig@psychologie.uzh.ch
R. Lüchinger
Institute for Biomedical Engineering,
Swiss Federal Institute of Technology, ETH Zurich, Rämistrasse 10, 8091 Zurich, Switzerland
46 Exp Brain Res (2010) 202:45–54
areas, subcortical structures and parietal structures, with the anterior cingulate cortex and posterior medial frontal cortex (pMFC) playing the major role (Ridderinkhof et al. 2004; Nachev et al. 2007). The pMFC seems not only to be involved in monitoring of internal non-motor errors (Botvi-nick et al., 2001; Ullsperger and von Cramon 2001; Fiehler et al. 2004; Li et al. 2008) but also in tasks in which the errors have external causes (Holroyd et al. 2004; Ullsperger et al. 2007). In addition to this the pMFC is involved in sig-naling the need for behavioral adjustments (Kerns et al. 2004; Ullsperger and von Cramon 2004). Meanwhile, researchers investigating motor errors have focused on the cerebellum and the parietal cortex (Blakemore et al. 2001; Blakemore 2003; Imamizu et al. 2003; Imamizu et al. 2004) and have suggested the concept of internal models. These internal models consist of two parts: an inverse and a forward model. While the forward model makes predictions about the behavior of the motor system and its sensory con-sequences, the inverse model calculates the motor com-mands required to achieve a certain goal. Deviations from the predicted and the actual outcome are detected by the forward model and used to update motor commands (Wol-pert et al. 1995; Wolpert and Kawato 1998; Imamizu et al. 2007; Kawato 1999).
In the present fMRI study, we investigated perception of errors caused by an agent’s motor system and errors caused by environmental factors, thereby considering how error magnitude impacts brain activity. To investigate these fac-tors, we arranged for subjects to perform a sensorimotor transformation task in which they were likely to commit motor errors of diVerent magnitudes; in some trials they were given incorrect feedback about their performance. In view of the pertinent literature, we anticipate activation in the pMFC to correlate with magnitude of internal and total
error, as these error types reXect a general mismatch
between the intended and actual outcome. SpeciWcally for
external error we expect cerebellar and parietal activity to
correlate with their magnitude, because these external
errors cannot be predicted by the forward model, and,
therefore, there is a mismatch between expected and actual outcome—the higher the mismatch the stronger the need to update the internal model.
Materials and methods Participants
Seventeen healthy right-handed subjects (mean 24.5 years, SD 3.2, 10 males), whose handedness was assessed with the Annett Handedness-Questionnaire (Annett 1970), par-ticipated in this study. Subjects gave written informed con-sent and performed two scanning runs, which were
separated by a short break (1–2 min). They were naïve about the purpose of the experiment and received 30 CHF for participation (approximately 30 US Dollars). The study was approved by the local ethics committee and tasks and testing procedures were in accordance with institutional guidelines of the Helsinki Declaration.
Stimuli and apparatus
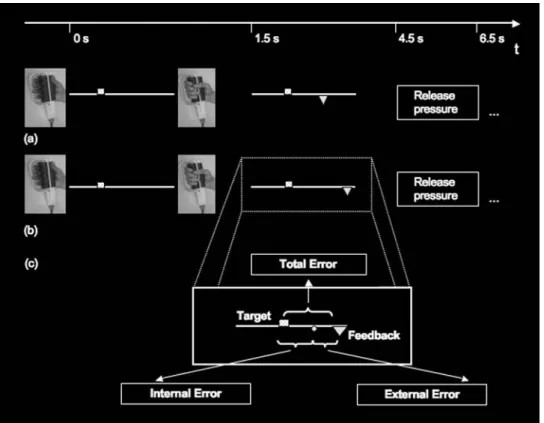
At the beginning of each trial, a yellow square (visual angle of approximately 0.1°) was presented above a horizontal line (visual angle of approximately 14°) as a target cue (Fig.1a). Its left–right position indicated the strength to be applied to a hand dynamometer (see below). Before the experiment, the position of each target was randomly cho-sen from the full range of possible positions without repeti-tions. After the movement, a triangle (visual angle of approximately 0.1°) was presented below the line as feed-back. Feedback cues were placed according to the subjects’ action. In 35% of the trials, their left–right position was additionally displaced (Fig.1b). The motor responses were recorded with an MRI-compatible isometric hand dyna-mometer (isometric Sensory-Motor Systems Laboratory, ETH Zurich and University of Zurich), which was set to measure isometric grip force with a frequency of 60 Hz from 0 to 40 N in 8-bit resolution.
Task
The task consisted of a sensorimotor transformation. Senso-rimotor transformations are usually characterized by a cer-tain relationship between sensory stimuli and motor responses. The required association between a visual stimu-lus and a motor response was set up according to previous experiments (Toni et al. 2001a, b), with the diVerence that the motor response consisted of a quasi-continuously graded application of force on a hand dynamometer (Flo-yer-Lea and Matthews 2004, 2005; Keisker et al. 2009). In our experiment, subjects had to apply a force on a hand dynamometer as indicated by the target cue, and minimize the diVerence between the positions of feedback and target cues. The force applied by the subjects on each trial was transformed into a position on the horizontal line as fol-lows: forces less than 10 N were coded by the leftmost position, whereas forces larger than 40 N were translated into the rightmost position on the line. Between 10 and 40 N, forces were transformed linearly into a corresponding position on the line.
In each trial, subjects were Wrst shown the target position (indicated as a square). They were instructed to apply a force that matched the target position to the hand dyna-mometer immediately after target presentation. The force applied was translated into a position along the horizontal
line. Feedback stimuli (indicated as triangles in the above illustration) were always shown below the line. The spatial distance between the target and the feedback cue was regarded as the motor error (Fig.1a). The motor response required manipulation of the hand dynamometer, and it was extremely unlikely that no internal motor errors would have been made, i.e. that the subject attained the desired position with a deviation of less than a pixel. After presen-tation of the feedback, a written instruction was presented to remove force from the dynamometer and a new trial sub-sequently began. Each trial lasted approximately 7 s, slightly varying due to the diVering times it took for the subjects to release pressure from the hand dynamometer. The target cue was presented for 1.5 s, feedback presenta-tion lasted for 3 s, and the request to release pressure was shown for 1.5 s. The whole experiment consisted of 280 trials, presented in two runs of 140 trials, adding up to a
total duration of approximately 35 min. The presentation times for cue and feedback were kept constant in both the correct and incorrect feedback conditions, and no measures were taken to delay motor response with respect to stimulus presentation. This approach was chosen because we were not interested in disentangling the discrete steps, but focused instead on the processing of errors. Regarding the trial as a whole allowed us to increase the number of trials in favor of statistical power, to compare trials with respect to presence or absence of external errors and to parametri-cally analyze the impact of error magnitude.
In 35% of all trials the feedback was distorted. This involved the addition of a variable extra displacement (external error) to the feedback position. Importantly, in order to prevent internal and external errors from cancel-ing each other out, we ensured that the external error always moved the feedback further away from the target.
Fig. 1 Task setup. During the scanning session, participants had to
associate a visual stimulus (position of a square above a line) with a motor response (application of force on the hand dynamometer) by tri-al and error. In each tritri-al, a target square was presented above the line. After the target cue was presented, subjects had to manipulate the hand dynamometer in order to evoke a force that matched the target’s posi-tion on the line. After 1.5 s they were given visual feedback about their performance. This took the form of a feedback triangle appearing at the location below the line, matching their applied force. The distance be-tween the square and the triangle was regarded as the motor error; the closer, the better the subjects’ motor performance. The fMRI experi-ment consisted of two sessions, each consisting of 140 trials, in which subjects were presented with incorrect feedback in 35% of the trials.
a A correct feedback trial, i.e. a trial in which the discrepancy between
the square and triangle reXects the subjects’ performance error alone (internal error). b An incorrect feedback trial. Again, subjects were only presented with the triangle as feedback of their performance and they were left naïve about the additional error component which had been added to the feedback. Adding an external error always increased the incorrect trial feedback error in comparison with the subjects’ real motor error. After presentation of the visual feedback, a further new tri-al was started. c The three measures that were subjected to a parametric analysis. The gray circle is inserted to illustrate the principle and reX-ects subjreX-ects’ performance. “Internal error” refers to the errors caused by the subject, “External error” refers to the externally added error and “Total error” describes the error fed back to subjects. This “Total er-ror” is either the result of internal errors only (65%) or internal and external errors together (35%)
48 Exp Brain Res (2010) 202:45–54
Thus, if the internal error was caused by the application of too little force (feedback triangle left of the cue), a further displacement to the left was added. If the internal error was caused by too much force (feedback triangle right of the cue), the external error was added to the right side.
The magnitude of the additional external displacement errors were randomly taken from the pool of the ten
inter-nal errors previously committed by the same subject. This
ensured that the size of the external errors was adjusted to the individual performance level, and thus external and
internal errors were comparable in magnitude. The
occur-rence of an external error could not be predicted, and the magnitude of the added external errors did not correlate with the magnitude of the internal errors. Subjects had not been informed about the existence of incorrect feedback tri-als and were naïve with regard to this experimental manipu-lation. Prior to the fMRI scanning session, the participants performed a training session including 50 trials, during which no external errors were added to the feedback. This permitted them to become familiar with the task and with the use of the hand dynamometer, and served to stabilize performance. More importantly, this allowed an internal model to build up, which enabled the subjects to predict the position where the feedback triangle was to be expected according to their dynamometer manipulation.
Experimental setup
Throughout both scanning runs, participants lay supine in the scanner. Head movement was minimized using an adjustable vacuum cushion. Visual stimuli were projected onto a mirror above the participants’ heads. The hand dyna-mometer was placed in their right hand. Stimulus presenta-tion and response collecpresenta-tion were controlled by
Presentation 11.2 software (Neurobehavioral Systems, Inc,
Albany, USA). After the experiment, subjects were asked to complete a questionnaire in which they answered ques-tions concerning their thoughts and emoques-tions during the experiment and if they had noticed anything peculiar. FMRI data acquisition
Functional magnetic resonance imaging was performed at the University Hospital of Zurich on a Philips Achieva 3-T whole-body MRI system (Philips Medical Systems, Best, The Netherlands). Three-dimensional anatomical images of the entire brain were obtained by using a T1-weighted three-dimensional spoiled gradient echo pulse sequence (180 slices, TR = 20 ms, TE = 2.3 ms, Xip angle = 20°, FOV = 220 mm £ 220 mm £ 135 mm, matrix size = 224 £ 187, voxel size = 0.98 mm £ 1.18 mm £ 0.75 mm, re-sliced to 0.86 mm £ 0.86 mm £ 0.75 mm). Functional data were obtained in 400 scans per run using 33 transverse
slices covering the whole brain in oblique orientation. Slices were acquired in interleaved order, using a sensitiv-ity encoded (SENSE, factor 2.0), single-shot echo planar imaging technique (TR = 2.5 s; TE = 35 ms; FOV = 220 mm £ 220 mm £ 132 mm; Xip angle = 78°; matrix size = 80 £ 80; voxel size = 2.75 mm £ 2.75 mm £ 4 mm, re-sliced to 1.72 mm £ 1.72 mm £ 4 mm). Three dummy scans were acquired at the beginning of each run and dis-carded in order to establish a steady state in T1 relaxation for all functional scans.
FMRI data analysis
Data analysis was performed using MATLAB 7.4.0 (Math-works Inc., Natiek, MA, USA) and SPM5 (http://fil.ion. ucl.ac.uk/spm). All images were realigned to the Wrst recorded volume, normalized into standard stereotactical space (using the EPI-template provided by the Montreal Neurological Institute, MNI brain), re-sliced to 2 mm £ 2 mm £ 2 mm voxel size and smoothed using a 6-mm full-width-at-half-maximum (FWHM) Gaussian kernel.
The general linear model (GLM) contained 11 regres-sors: four for the correct feedback trials, Wve regressors for the incorrect feedback trials, and two additional regressors common to both feedback conditions. The Wrst regressor for correct feedback trials was motor prepara-tion, which was modeled as an epoch starting from target stimulus onset and lasting until the onset of the move-ment. Thus, the duration of this epoch was variable from trial to trial. A second regressor was an event at the onset of the motor response. The third regressor was a 1.5-s epoch starting at the onset of feedback presentation. The fourth regressor was a parametric modulation of the feed-back regressor by the magnitude of internal error (Buchel and Friston 1998; Buchel et al. 1998). The incor-rect feedback trials had the same four regressors plus an additional regressor consisting of a parametric modula-tion of the feedback by external error. In the following, the term internal errors will refer to the results of a para-metric analysis of the magnitude of internally caused errors in trials, where no additional external distortion was added. The term external errors labels the results of the parametric analysis of the magnitude of externally added errors in trials with additional external distortion, while the term total error describes the sum of responses (parameter estimates) to internal and external errors in trials with both internal and external error (Fig.2c). Finally, we used two additional regressors: The Wrst was a regressor applied to both correct and incorrect feedback trials for the instruction to release force of grip that con-sisted of a 1.5-s epoch beginning with the onset of the instruction. The second was an epoch of 7 s that modeled the missed trials.
Functional data were analyzed using a GLM involving the abovementioned 11 regressors and a high-pass Wlter with a cut-oV period of 128 s. The GLM was computed for each subject and then subjected to a second-level analysis. First-level linear contrasts (against global mean) were employed to test for speciWc condition eVects for each voxel and each subject and condition (Friston et al. 1995). This results in one statistical parametric map for each sub-ject and each contrast (three contrasts): (1) parametric mod-ulation by internal error in correct feedback trials; (2) parametric modulation by external error in incorrect
feedback trials; (3) parametric modulation by total error in incorrect feedback trials. These contrast images were smoothed using an 8-mm FWHM Gaussian kernel, leading to an overall smoothing by 10-mm FWHM (62+ 82)(1/2). This was undertaken to account for inter-individual diVerences in localization of activated brain regions and to further increase statistical sensitivity by reducing the eVective number of independent observations. In order to permit population-level inferences to be made, maps of contrast coeYcients were collectively submitted to one-sample t tests against the null hypothesis of no activation for each of the Wrst level contrasts while controlling for ran-dom eVects. Activation diVerences were tested on a cluster level corrected for multiple comparisons using a statistical threshold of P < 0.05 and were reported using a cluster size of >25.
Behavioral results
Every subject performed 280 trials. Two participants were excluded from the analyses due to more than 15% missed trials, which made them outliers with respect to task pro-cessing. The Wnal sample comprised 15 participants (mean age 24.5 years, SD 3.2, 10 males). On average, these sub-jects missed 12.3 trials (SD 4.68, range 5–20) where no action on the hand dynamometer took place. The average
internally generated error magnitude was 78.84 pixels (SD
15.0, range 1–480) and the average externally added error was 78.33 pixels (SD 13.97, range 1–435). A two-tailed paired t test revealed no signiWcant diVerence in magnitude of motor error [t(14) = 0.20; P = 0.85)] for the correct and incorrect feedback trials. To identify whether subjects’ per-formance changed over time, internal error magnitude was compared in the Wrst and second half of the experiment using a paired t test. This revealed no signiWcant diVerence between the Wrst and second run (t = 0.941, df = 134,
P = 0.35).
To check for post-error-adjustment, we calculated the correlation coeYcient between the errors and the following force production per subject in four diVerent ways: (C1) correlation of the magnitude of internal error with the mag-nitude of internal error of the following trial; (C2) correla-tion of total error magnitude (internal plus external) with
internal error magnitude of the following trial; (C3)
corre-lation of externally added error with the internal error of the following trial; (C4) in order to assess any potential eVect of time on this correlation, we computed a correlation between external error and the internal error of the next trial (equivalent to C3) only for the Wrst half of the dataset. No signiWcant correlations were found between the error magnitude and the correction in the subsequent trials, suggesting that no post-error adjustment took place during the experiment.
Fig. 2 Imaging Data. Anatomical location SPM(t) of the parametric
analysis activations (a-e) detailed in Tables1 and 2, overlaid on an MNI standard brain, together with parameter estimates (§90% CI).
a, b Foci in which a BOLD response is correlated with the size of total
error. One area is located in the pMFC, while the two others are located bilaterally in the MFG. In contrast, c–f show the areas in which a BOLD signal is correlated with the size of external error. c Activity in the pMFC and sup-PC, d the ventral anterior insula (AI), e the BG and the CB, f bilateral IFG and pMFC activity. pMFC posterior medial frontal cortex; MFG middle frontal gyrus; sup-PC superior parietal cortex; AI anterior insula; BG basal ganglia; CB cerebellum
50 Exp Brain Res (2010) 202:45–54
Data from the post-experimental questionnaire revealed that 14 of 15 subjects had gained the impression that the hand dynamometer was sometimes not acting in the way they had intended.
Imaging results
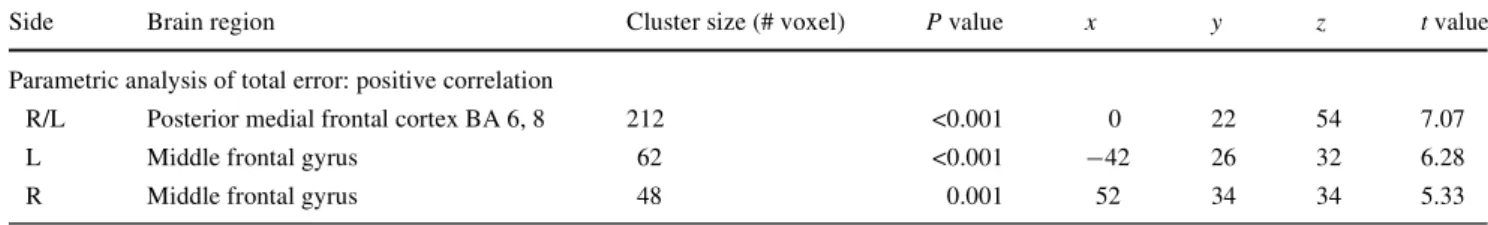
First, we looked for regional brain activity that correlated linearly with the total error fed back to the subject (com-bined internal and external), taking all trials into account (Fig.2a, b; Table1). We found activity at the upper border of the rostral cingulate zone expanding into the pre-SMA, as well as activity in the right and left medial frontal gyrus (MFG), to positively correlate with the total
error magnitude. Next, we investigated whether activity
in any region displayed a linear parametric modulation with the magnitude of internal errors. No region could be identiWed showing this relationship. Last, we looked for regions in which activity increased linearly with the size of the externally added error. This analysis revealed nine clusters that showed such a relationship (Fig.2c–f; Table2). One of these clusters contained several local maxima. The strongest local maximum was found to be located in the right inferior frontal sulcus, the second in the right inferior frontal gyrus (IFG) and the third in the
right ventral anterior insula. Left IFG/sulcus activity was also revealed. In addition, signiWcant activation was also found in the pMFC, the left inferior semilunar lobule of the cerebellum, the MFG, the basal ganglia and in the right precuneus.
Discussion
The aim of this study was to establish a relationship between neural activity and the magnitude of three types of errors: (1) motor errors committed by the agent (internal
errors) (2) non-motor errors induced by environmental
fac-tors (external errors), and (3) the sum of these (total
errors). For this purpose, a sensorimotor transformation
task was chosen in which participants committed motor errors of diVerent magnitudes (internal errors) in which incorrect feedback was given (external errors) during some trials.
We found that the activity of the MFG and the pMFC was enhanced with the magnitude of the total error fed back to the subject, while the parametric analysis of the magnitude of internal errors alone revealed no signiWcant correlation with activity in any brain region. Anterior insu-lar and lateral prefrontal areas as well as cerebelinsu-lar, parietal
Table 1 MNI coordinates of signiWcant clusters (P > 0.005, corrected
for multiple comparisons, minimum cluster size = 25 voxels), number of voxels and P value per cluster, as well as MNI coordinates and t values
of the maximally activated voxel in each cluster yielded by the parametric analysis of the magnitude of the total errors (external plus
internal errors)
Side Brain region Cluster size (# voxel) P value x y z t value
Parametric analysis of total error: positive correlation
R/L Posterior medial frontal cortex BA 6, 8 212 <0.001 0 22 54 7.07
L Middle frontal gyrus 62 <0.001 ¡42 26 32 6.28
R Middle frontal gyrus 48 0.001 52 34 34 5.33
Table 2 Anatomical
speciWcation, MNI coordinates of signiWcant clusters (P < 0.05, corrected for multiple compari-sons, minimum cluster size = 25 voxels), number of voxels per cluster, P and t values of clusters yielded by the parametric analysis of the magnitude of the
external errors
Side Brain region Cluster
size (# voxel)
P value x y z t value
Parametric analysis of external errors: positive correlation
R Inferior frontal sulcus 1,562 <0.001 40 32 16 6.28 R Inferior frontal sulcus/gyrus <0.001 50 32 12 6.26
R Anterior insula <0.001 32 26 ¡6 5.08
R Middle frontal gyrus 130 <0.001 32 54 2 3.62
R Posterior medial frontal cortex 117 <0.001 6 24 58 3.84
6 36 58 3.20
BA 6/8
R Posterior medial frontal cortex BA 8/9/32 120 <0.001 0 50 32 3.93
R Superior parietal lobe 78 0.003 4 ¡72 56 3.07
L Precuneus BA 7 56 0.031 ¡22 ¡56 46 3.63
L Inferior frontal sulcus/gyrus 334 <0.001 ¡48 30 30 3.14
L Basal ganglia 57 0.027 ¡18 ¡20 6 4.28
and pMFC (BA 6/8) activity were found to correlate positively with the magnitude of external errors.
The task used in this experiment diVered from classical non-motor error paradigms (reviewed e.g. by Ridderinkhof et al. 2004). First, this task was not composed of a two or three-alternative forced-choice task in which the answer was either correct or incorrect and was therefore not limited to a dichotomous right or wrong feedback. This novel task extended beyond a qualitative analysis of the feedback to a quantitative analysis of error magnitude. Second, the required motor responses did not depend on a pure cogni-tive evaluation of a stimulus (e.g. stimulus A present or not) but on a transformation of visual input into a graded motor response.
Total error
One aim of this study was to determine the areas in which activity correlates positively with the magnitude of total
error fed back to the subjects. The pMFC and the
MFG/sul-cus were positively correlated with total error magnitude. The source of this total error could either be of an internal nature only or a combination of internal and external
errors. The confrontation with large error feedback is likely
to induce several processes. Besides signaling an error, it may lead higher neural eVorts for the correct planning, pro-gramming, execution as well as updating of the associated motor response.
The fact that we found activity modulation within the pMFC (BA 6/8) for errors is consistent with the results from error monitoring in cognitive tasks (e.g. Botvinick et al. 2001; Ullsperger and von Cramon 2001; Holroyd et al. 2004; Ullsperger et al. 2007; Li et al. 2008). When subjects are confronted with large errors, this may activate a process that calls for improvement of the motor response. Optimization of a motor response calls for new planning, which has been shown to trigger activity in the pre-SMA (Tanji 1994; Picard and Strick 2001). Furthermore, the pMFC has also been linked to signal the need to adjust behavior (Ullsperger et al. 2004), and it has also been shown that the intensity of pMFC activity allows predic-tions to be made about the strength of future adjustments (Kerns et al. 2004; Debener et al. 2005). Importantly, how-ever, our behavioral Wndings reveal no such error adjust-ment. Thus, the interpretation that pMFC activity leads to future adjustments does not match our data. The activity we report here might instead reXect the signaling of a discrep-ancy between intended and actual outcome and thus the potential need to adjust performance. The lack of post-error adjustment might be due to the fact that our subjects had practiced the task ahead of scanning and were already sta-bly performing at their optimum therefore no update would be implemented, which is diVerent to previously described
studies in the cognitive domain where learning was involved.
In addition to pMFC activity, bilateral MFG/sulcus activity was found to correlate positively with the magni-tude of the feedback discrepancy. Since the medial and the dorsolateral prefrontal cortex are tightly linked anatomi-cally (Luppino et al. 1993) and also a strong functional con-nectivity between these areas has been shown (Chaminade and Fonlupt 2003), the dorsolateral prefrontal activity we Wnd may be considered a pMFC co-activation. It has been suggested that the pMFC acts as a monitor, while the dorso-lateral cortex as a controller (Ridderinkhof et al. 2004; Fletcher et al. 2001) or as a conXict solver (Casey et al. 2000), which interacts in the regulation of goal directed behavior. We might interpret the present activity of dorsal middle frontal cortex and anterior MFG in accordance to these studies as signaling the need to adjust behavior.
The total error corresponds to a mixture of internal and
external errors. For a cognitive system it is important to be
able to locate the source of error so that appropriate actions can be undertaken to prevent errors. For this reason, in the following we separately investigate the speciWc contribu-tion of the internal and external errors to these brain signals.
Internal errors
Another aspect of this study was to determine the areas where activity increases with the magnitude of the internal
motor errors. Interestingly, we found no signiWcant pMFC
activity to correlate with the magnitude of internal error. This is somewhat surprising, since one would expect some analogies with the error monitoring previously investigated in the cognitive domain. These earlier studies consistently show pMFC activity to be triggered by error perception (e.g. Carter et al. 1998; Botvinick et al. 2001; van Veen et al. 2004; Ullsperger et al. 2007). One reason why no relation was found between error size and pMFC activity may be provided by the internal model theory (Kawato and Wolpert 1998; Wolpert and Kawato 1998). These internal models enable the agent to form a prediction about the sen-sory consequences of a motor action and to compare the predicted outcome with the actual outcome. At the same time research into error monitoring and perception in cog-nitive tasks has pointed out that pMFC is only activated when a deviation from an expected target is detected (Knut-son and Cooper 2005; Bubic et al. 2009). Since the predic-tion of the sensory consequence of the motor command has already been made by the forward model, a deviation between target and feedback cue is not unexpected, and may therefore not trigger pMFC activity. Evidence for this line of argument may be seen in the fact that pMFC activity was only detected in trials in which external errors had
52 Exp Brain Res (2010) 202:45–54
been added in addition to the internal errors—a component that could not have been predicted by the forward model. Another hypothesis could be that correct feedback trials are the ones with the best possible outcome and that the need for adjustment could have been perceived as low. However, one should interpret these null-Wndings with caution. The absence of an eVect may be due to experimental factors such as the sample size or any non-linearities in the BOLD response that are not accounted for in the regression model. External errors
The third aim of this study was to assess the activity of brain areas positively correlating with the magnitude of the
externally added error alone. To start with, we would like to
comment on the fact that in trials including an external
error, the size of explicitly fed back error is on average
larger than in the remaining trials. However, please note, it is the size of the external error component alone, rather than the (explicitly available) total error, which shows a signiWcant correlation between activation size in several additional brain regions. Thus, this external error compo-nent elicits signiWcant reactions in the brain, which are dis-cussed below.
Similar to the total error, the external error was also correlated with activity in the pMFC (BA 6/8), which con-forms with results obtained from error monitoring in cogni-tive tasks (Botvinick et al. 2001; Ullsperger and von Cramon 2001; Fiehler et al. 2004; Holroyd et al. 2004; Ullsperger et al. 2007). In the incorrect feedback condition, feedback is distorted, and the outcome could therefore not be predicted correctly. We argue that the unexpected out-come triggered pMFC activity, which, in turn, may have signaled the need to change behavior for outcome optimiza-tion. The same line of argumentation may also hold for the internal models, and we have indeed found cerebellar and parietal activity, as would have been predicted according to the work of several authors (Blakemore et al. 2001; Blakemore and Sirigu 2003; Imamizu et al. 2003; Imamizu et al. 2004; Imamizu and Kawato 2009).
Besides regions of the error network, we additionally found brain regions known to be involved in aVective processes, such as anterior insula and lateral prefrontal cortex. Our analysis revealed IFG and anterior insular activity to increase with external error magnitude. The IFG is part of the lateral prefrontal cortex that supports the cog-nitive regulation of feelings and thoughts (Hariri et al. 2000; Kuchinke et al. 2005; Koelsch et al. 2006; Levesque et al. 2003; Ochsner et al. 2004; Baumgartner et al. 2006; Chiu et al. 2008). Furthermore, it has been proposed that the insula, which is part of the ventral emotional system, is important for the identiWcation of the emotional signiW-cance of the stimuli, the production of aVective state
responses and (as the IFG) involved in autonomic regula-tion of emoregula-tional responses (Lane et al. 1997; Buchel et al. 1999; Phelps et al. 2001; Phan et al. 2002; Phillips et al. 2003; Jabbi et al. 2008). Several studies dealing with nega-tive emotions such as omission of social reward (Siegrist et al. 2005), unfairness (Sanfey et al. 2003) or frustration (Abler et al. 2005) report insular as well as IFG activity as observed in the current study. The magnitude of external
errors in our study reXects the degree to which the
individ-ual performance has been distorted by external inXuences. This external feedback may be perceived as unfair
feed-back, e.g. in the study of Abler et al. (2005) participants were promised money when performing a task correctly, but the reward was omitted in some trials. In their study as well as in ours, subjects were presented with a worse out-come than would be expected from performance. They interpreted insular and IFG activation as being due to frus-tration and the need to regulate or inhibit pain distress and negative emotion.
In light of the abovementioned studies, a tentative expla-nation could be that adding external errors to the perfor-mance feedback results in emotional disturbance—the more so, the bigger the external error is. The question, however, arises whether such emotional consequences of distorted performance feedback depend on the subjects’ conscious perception of a faulty feedback, or may be trig-gered by a feeling of uncertainty regarding performance outcome. Subjects were not always conscious of an external manipulation, but it is obvious from the statements gath-ered in the post experiment questionnaire that being con-fronted with error induced negative emotions in the subjects. Answers to the question “what was your reaction to an error?” ranged from “I tell myself to do better in the next trial”, “the device must be out of whack”, “frowning”, “being annoyed”, “upset”, “irritated” to “frustrated”. This is comparable to a tennis player who gets emotionally agi-tated after missing a ball and might either attribute the fail-ure to environmental causes or to his skills. From our verbal reports alone, it is diYcult to specify the attributional style, or locus of error, subjects have assumed in each trial. We abstained from asking subjects about their reactions after every trial, since that would undoubtedly have intro-duced bias in the subject’s manner of dealing with errors, and the focus of this study was to investigate whether the brain reacts diVerently to errors from diVerent sources. Thus, in our study subjects might have occasionally felt that they were unable to inXuence the result and to adjust their behavior in order to avoid these errors. However, this will have only been true for a small subset of trials because external errors ranged from very small and unnoticeable to very large and clearly noticeable.
In a task with unpredictable and infrequent events, such as external errors, these may be perceived as deviants.
Taking this into account, we would like to shortly discuss common aspects of oddball paradigms and the present experiment. At unpredictable times, subjects are confronted with unexpected stimuli, which in oddball settings have been shown to consistently activate a large network includ-ing parietal, medial and lateral frontal areas (Kiehl and Lid-dle 2001; Huettel and McCarthy 2004; Brazdil et al. 2007). Being confronted with unexpected stimulation may have induced an attentional modulation in our experiment com-parable with oddball experiments. This activity pattern classical to oddball paradigms is largely consistent with ours. However, our task diVers in several aspects from odd-ball paradigms. First, the successful manipulation relies on an active sensorimotor integration of visual stimuli into a motor response, which induced a sense of agency not com-mon to oddball paradigms. Second, in order to optimize behavior, the output has to be monitored and in case of a mismatch between expected and actual outcome, the source of such a mismatch has to be located. Additionally, in the present study, reactions to unexpected stimuli evoke emo-tional responses going beyond classical oddball tasks. Therefore, despite common aspects, our task interpretation cannot be equaled to one of oddball paradigms.
In summary, we can postulate that anterior insular and IFG activity reXects the emotion induced by the external
errors, that the pMFC results from exposure to an
unex-pected event and, Wnally, that cerebellar-parietal activity may reXect adjustments of the internal model. To explicitly address the issue of awareness of the source of error, a future study is planned.
Conclusion
Our experiment yields three major conclusions: (1) pMFC (BA 6/8) and bilateral MFG activity correlates positively with the magnitude of total errors. The larger the errors subjects were confronted with the higher the perceived need to adjust behavior or an internal model relating action to expected outcome. (2) Activity in pMFC (BA 6/8), ante-rior insula, cerebellum, precuneus and IFG correlates with the magnitude of external errors. Presumably, these regions reXect a negative emotional response evoked while facing unexpected and potentially unfair feedback. (3) pMFC activity does not signiWcantly correlate with the size of internal errors. The fact that pMFC correlates with
external errors and with total errors but not with internal errors leads us to assume that internal motor errors are
processed diVerently from non-motor errors. One explana-tion for this may be given by the framework of internal models. These internal models enable the sensory conse-quences of motor commands to be predicted, and these errors are therefore not unexpected. Detection of motor and
non-motor errors apparently relies on diVerent neural networks.
Acknowledgments The study was supported by Swiss National Science Foundation (320000-111777). The authors are grateful to Stefan Bode for helpful comments on earlier drafts and to Marcus Cheetham for proofreading this manuscript.
References
Abler B, Walter H, Erk S (2005) Neural correlates of frustration. Neuroreport 16:669–672
Annett M (1970) A classiWcation of hand preference by association analysis. Br J Psychol 61:303–321
Baumgartner T, Lutz K, Schmidt CF, Jancke L (2006) The emotional power of music: how music enhances the feeling of aVective pictures. Brain Res 1075:151–164
Blakemore SJ (2003) Deluding the motor system. Conscious Cogn 12:647–655
Blakemore SJ, Sirigu A (2003) Action prediction in the cerebellum and in the parietal lobe. Exp Brain Res 153:239–245
Blakemore SJ, Frith CD, Wolpert DM (2001) The cerebellum is involved in predicting the sensory consequences of action. Neuroreport 12:1879–1884
Botvinick MM, Braver TS, Barch DM, Carter CS, Cohen JD (2001) Con-Xict monitoring and cognitive control. Psychol Rev 108:624–652 Brazdil M, Mikl M, Marecek R, Krupa P, Rektor I (2007) EVective
connectivity in target stimulus processing: a dynamic causal mod-eling study of visual oddball task. Neuroimage 35:827–835 Bubic A, von Cramon DY, Jacobsen T, Schroger E, Schubotz RI
(2009) Violation of expectation: neural correlates reXect bases of prediction. J Cogn Neurosci 21:155–168
Buchel C, Friston KJ (1998) Dynamic changes in eVective connectiv-ity characterized by variable parameter regression and Kalman Wltering. Hum Brain Mapp 6:403–408
Buchel C, Holmes AP, Rees G, Friston KJ (1998) Characterizing stim-ulus-response functions using nonlinear regressors in parametric fMRI experiments. Neuroimage 8:140–148
Buchel C, Dolan RJ, Armony JL, Friston KJ (1999) Amygdala-hippocampal involvement in human aversive trace conditioning revealed through event-related functional magnetic resonance imaging. J Neurosci 19:10869–10876
Carter CS, Braver TS, Barch DM, Botvinick MM, Noll D, Cohen JD (1998) Anterior cingulate cortex, error detection, and the online monitoring of performance. Science 280:747–749
Casey BJ, Thomas KM, Welsh TF, Badgaiyan RD, Eccard CH, Jennings JR, Crone EA (2000) Dissociation of response conXict, attentional selection, and expectancy with functional magnetic resonance imaging. Proc Natl Acad Sci USA 97:8728–8733 Chaminade T, Fonlupt P (2003) Changes of eVective connectivity
between the lateral and medial parts of the prefrontal cortex during a visual task. Eur J Neurosci 18:675–679
Chiu PH, Holmes AJ, Pizzagalli DA (2008) Dissociable recruitment of rostral anterior cingulate and inferior frontal cortex in emotional response inhibition. Neuroimage 42:988–997
Debener S, Ullsperger M, Siegel M, Fiehler K, von Cramon DY, Engel AK (2005) Trial-by-trial coupling of concurrent electroencephalo-gram and functional magnetic resonance imaging identiWes the dynamics of performance monitoring. J Neurosci 25:11730–11737 Fiehler K, Ullsperger M, von Cramon DY (2004) Neural correlates of error detection and error correction: is there a common neuroana-tomical substrate? Eur J Neurosci 19:3081–3087
Fletcher PC, Anderson JM, Shanks DR, Honey R, Carpenter TA, Donovan T, Papadakis N, Bullmore ET (2001) Responses of
54 Exp Brain Res (2010) 202:45–54
human frontal cortex to surprising events are predicted by formal associative learning theory. Nat Neurosci 4:1043–1048
Floyer-Lea A, Matthews PM (2004) Changing brain networks for visuomotor control with increased movement automaticity. J Neurophysiol 92:2405–2412
Floyer-Lea A, Matthews PM (2005) Distinguishable brain activation networks for short- and long-term motor skill learning. J Neuro-physiol 94:512–518
Friston KJ, Frith CD, Turner R, Frackowiak RS (1995) Characterizing evoked hemodynamics with fMRI. Neuroimage 2:157–165 Hariri AR, Bookheimer SY, Mazziotta JC (2000) Modulating
emo-tional responses: eVects of a neocortical network on the limbic system. Neuroreport 11:43–48
Holroyd CB, Nieuwenhuis S, Yeung N, Nystrom L, Mars RB, Coles MG, Cohen JD (2004) Dorsal anterior cingulate cortex shows fMRI response to internal and external error signals. Nat Neurosci 7:497–498
Huettel SA, McCarthy G (2004) What is odd in the oddball task? Prefrontal cortex is activated by dynamic changes in response strategy. Neuropsychologia 42:379–386
Imamizu H, Kawato M (2009) Brain mechanisms for predictive con-trol by switching internal models: implications for higher-order cognitive functions. Psychol Res 73(4):527–544
Imamizu H, Kuroda T, Miyauchi S, Yoshioka T, Kawato M (2003) Modular organization of internal models of tools in the human cerebellum. Proc Natl Acad Sci USA 100:5461–5466
Imamizu H, Kuroda T, Yoshioka T, Kawato M (2004) Functional magnetic resonance imaging examination of two modular archi-tectures for switching multiple internal models. J Neurosci 24:1173–1181
Imamizu H, Higuchi S, Toda A, Kawato M (2007) Reorganization of brain activity for multiple internal models after short but intensive training. Cortex 43:338–349
Jabbi M, Bastiaansen J, Keysers C (2008) A common anterior insula representation of disgust observation, experience and imagination shows divergent functional connectivity pathways. PLoS One 3:e2939
Kawato M (1999) Internal models for motor control and trajectory planning. Curr Opin Neurobiol 9:718–727
Kawato M, Wolpert D (1998) Internal models for motor control. Novartis Found Symp 218:291–304 discussion 304–307 Keisker B, Hepp-Reymond MC, Blickenstorfer A, Meyer M, Kollias SS
(2009) DiVerential force scaling of Wne-graded power grip force in the sensorimotor network. Hum Brain Mapp 30(8):2453–2465 Kerns JG, Cohen JD, AWr MacDonald, Cho RY, Stenger VA, Carter
CS (2004) Anterior cingulate conXict monitoring and adjustments in control. Science 303:1023–1026
Kiehl KA, Liddle PF (2001) An event-related functional magnetic res-onance imaging study of an auditory oddball task in schizophre-nia. Schizophr Res 48:159–171
Knutson B, Cooper JC (2005) Functional magnetic resonance imaging of reward prediction. Curr Opin Neurol 18:411–417
Koelsch S, Fritz T, von Cramon DY, Muller K, Friederici AD (2006) Investigating emotion with music: an fMRI study. Hum Brain Mapp 27:239–250
Kuchinke L, Jacobs AM, Grubich C, Vo ML, Conrad M, Herrmann M (2005) Incidental eVects of emotional valence in single word pro-cessing: an fMRI study. Neuroimage 28:1022–1032
Lane RD, Reiman EM, Ahern GL, Schwartz GE, Davidson RJ (1997) Neuroanatomical correlates of happiness, sadness, and disgust. Am J Psychiatry 154:926–933
Levesque J, Joanette Y, Mensour B, Beaudoin G, Leroux JM, Bourg-ouin P, Beauregard M (2003) Neural correlates of sad feelings in healthy girls. Neuroscience 121:545–551
Li CS, Yan P, Chao HH, Sinha R, Paliwal P, Constable RT, Zhang S, Lee TW (2008) Error-speciWc medial cortical and subcortical activity during the stop signal task: a functional magnetic reso-nance imaging study. Neuroscience 155:1142–1151
Luppino G, Matelli M, Camarda R, Rizzolatti G (1993) Corticocortical connections of area F3 (SMA-proper) and area F6 (pre-SMA) in the macaque monkey. J Comp Neurol 338:114–140
Nachev P, Wydell H, O’neill K, Husain M, Kennard C (2007) The role of the pre-supplementary motor area in the control of action. Neuroimage 36(Suppl 2):T155–T163
Ochsner KN, Ray RD, Cooper JC, Robertson ER, Chopra S, Gabrieli JD, Gross JJ (2004) For better or for worse: neural systems supporting the cognitive down- and up-regulation of negative emotion. Neuroimage 23:483–499
Phan KL, Wager T, Taylor SF, Liberzon I (2002) Functional neuro-anatomy of emotion: a meta-analysis of emotion activation stud-ies in PET and fMRI. Neuroimage 16:331–348
Phelps EA, O’Connor KJ, Gatenby JC, Gore JC, Grillon C, Davis M (2001) Activation of the left amygdala to a cognitive representa-tion of fear. Nat Neurosci 4:437–441
Phillips ML, Drevets WC, Rauch SL, Lane R (2003) Neurobiology of emotion perception. I: The neural basis of normal emotion perception. Biol Psychiatry 54:504–514
Picard N, Strick PL (2001) Imaging the premotor areas. Curr Opin Neurobiol 11:663–672
Ridderinkhof KR, Ullsperger M, Crone EA, Nieuwenhuis S (2004) The role of the medial frontal cortex in cognitive control. Science 306:443–447
Sanfey AG, Rilling JK, Aronson JA, Nystrom LE, Cohen JD (2003) The neural basis of economic decision-making in the Ultimatum Game. Science 300:1755–1758
Siegrist J, Menrath I, Stocker T, Klein M, Kellermann T, Shah NJ, Zilles K, Schneider F (2005) DiVerential brain activation according to chronic social reward frustration. Neuroreport 16:1899–1903
Tanji J (1994) The supplementary motor area in the cerebral cortex. Neurosci Res 19:251–268
Toni I, Ramnani N, Josephs O, Ashburner J, Passingham RE (2001a) Learning arbitrary visuomotor associations: temporal dynamic of brain activity. Neuroimage 14:1048–1057
Toni I, Rushworth MF, Passingham RE (2001b) Neural correlates of visuomotor associations. Spatial rules compared with arbitrary rules. Exp Brain Res 141:359–369
Ullsperger M, von Cramon DY (2001) Subprocesses of performance monitoring: a dissociation of error processing and response com-petition revealed by event-related fMRI and ERPs. Neuroimage 14:1387–1401
Ullsperger M, von Cramon DY (2004) Neuroimaging of performance monitoring: error detection and beyond. Cortex 40:593–604 Ullsperger M, Volz KG, von Cramon DY (2004) A common neural
system signaling the need for behavioral changes. Trends Cogn Sci 8:445–446 author reply 446–447
Ullsperger M, Nittono H, von Cramon DY (2007) When goals are missed: dealing with self-generated and externally induced fail-ure. Neuroimage 35:1356–1364
van Veen V, Holroyd CB, Cohen JD, Stenger VA, Carter CS (2004) Errors without conXict: implications for performance monitoring theories of anterior cingulate cortex. Brain Cogn 56:267–276 Wolpert DM, Kawato M (1998) Multiple paired forward and inverse
models for motor control. Neural Netw 11:1317–1329
Wolpert DM, Ghahramani Z, Jordan MI (1995) An internal model for sensorimotor integration. Science 269:1880–1882