ORIGINAL ARTICLE
12-Month color stability of enamel, dentine,
and enamel
–dentine samples after bleaching
Annette Wiegand&Steffi Drebenstedt& Malgorzata Roos&Ana Carolina Magalhães& Thomas Attin
Received: 17 December 2007 / Accepted: 25 February 2008 / Published online: 28 March 2008
# Springer-Verlag 2008
Abstract The study aimed to quantify the color regression of enamel (E), dentine (D), and combined enamel–dentine (ED) of differently bleached ED specimens over a period of 12 months in vitro. Two ED samples were obtained from the labial surfaces of bovine teeth and prepared to a standardized thickness with the enamel and dentine layer each 1 mm. The ED samples were distributed on four groups (each n=80), in which the different bleaching
products were applied on enamel (1, Whitestrips; 2,
Illuminé 15%; 3, Opalescence Xtra Boost) or dentine surfaces (4, mixture of sodium perborate/distilled water). Eighty ED samples were not bleached (control). Color (L*a*b*) of ED was assessed at baseline, subsequently
after bleaching and at 3, 6, and 12 months of storage after bleaching (each 20 samples/group). E and D samples were prepared by removing the dentine or enamel layer of ED samples to allow for separate color analysis. Bleaching resulted in a significant color change (ΔE) of ED
speci-mens. Within the observation period, ΔL but not Δb
declined to baseline. L* values of E and D samples also declined and were not significantly different from control samples after 12 months, whileb* values did not decrease to baseline. Generally, no differences between the bleaching agents could be observed. Color change of enamel, dentine, and combined ED of in vitro bleached tooth samples is not stable over time with regard to lightness. However, yellow-ness did not return to baseline within 1 year.
Keywords Bleaching . Color . Enamel . Dentine
Introduction
Bleaching of vital and non-vital teeth has become an essential component of conservative esthetic dentistry, as it is a non-restorative treatment for whitening of discolored teeth. The current bleaching mechanisms are based on the application of hydrogen-peroxide-releasing agents on ex-ternal tooth surfaces (in-office- or at-home-bleaching methods) or in the pulp chamber (only for non-vital teeth, walking-bleach technique) to penetrate the tooth and produce free radicals that oxidize organic stains.
Several laboratory and clinical studies have demonstrat-ed carbamide peroxide or hydrogen peroxide bleaching solutions to be effective in whitening of discolored teeth [2,
4,6,16,26,27]. Thereby, efficacy might be related to the concentration of the active bleaching ingredient, the application time of the agents, and the potential to penetrate
DOI 10.1007/s00784-008-0195-7
A. Wiegand (*)
:
A. C. Magalhães:
T. AttinClinic for Preventive Dentistry, Periodontology and Cariology, University of Zürich,
Plattenstrasse 11, 8032 Zürich, Switzerland
e-mail: [email protected] S. Drebenstedt
Department of Operative Dentistry, Preventive Dentistry and Periodontology, Georg-August-University of Göttingen, Robert-Koch-Str. 40,
37075 Göttingen, Germany M. Roos
Biostatistics Unit, Institute of Social and Preventive Medicine, University of Zurich,
Hirschengraben 84, 8001 Zurich, Switzerland A. C. Magalhães
Department of Pediatric and Social Dentistry, School of Dentistry of Araçatuba, UNESP, Sao Paulo State University,
dental hard tissues [10,15,22,23]. The substantial increase of lightness and decrease of chroma observed directly after bleaching is, however, often followed by a decrease of whitening in the post-bleaching period, indicating that the bleaching effect might not be stable over time. After an initial reduction of lightening possibly due to rehydration processes in the first weeks after bleaching [17,19,26], a further color regression toward baseline shades might occur. Two-year evaluation of non-vital tooth whitening revealed a 19% reduction compared to tooth color directly after bleaching [4]. Long-time follow-up of nightguard vital bleaching revealed color regression in 37% of patients after 3 years and 58% after 7 years [14].
Due to the numerous products used and the great variation in application protocols, comparison of the results of clinical studies with regard to bleaching efficacy and especially color retention is difficult. While the short-term efficacy of different bleaching agents and techniques has been compared in vitro under standardized conditions [5], the color stability of different bleaching techniques has not been investigated systematically as yet. However, to allow for comparison and assessment of the different treatment modalities, efficacy of bleaching has to be analyzed not only directly after completion of bleaching but also after several months [5]. Therefore, the present study aimed to analyze the color retention after simulation of different bleaching techniques (home-bleaching, in-office-bleaching, walking-bleach technique) using established agents in the 12 months post-treatment period. As the efficacy of bleaching is not only related to the whitening of the superficial dental hard tissue but also to the potential to penetrate the tooth and bleach the subsurface enamel or dentin [5,24], the color regression of enamel (E), dentine (D), and combined enamel–dentine (ED) was investigated. The null hypothesis tested were (a) the color change of E and D, and the combined ED samples of differently
bleached ED specimens over a period of 12 months is not stable over time; (b) there were no significant differences among the different bleaching techniques in the color stability.
Materials and methods Sample preparation
Two hundred freshly extracted, non-damaged bovine intact incisors were stored in 0.1% thymol solution at room temperature. The labial surfaces were carefully cleaned with pumice and polished with prophylaxis paste (RDA 40, CCS AB, Borlänge, Sweden) using a polishing brush (Hawe Neos, Biggio, Switzerland) that was mounted in a contra-angle (1,200 rpm). Two ED samples (3 mm in diameter) were prepared from the labial surface of each tooth by means of a trephine mill (Komet, Lemgo, Germany). The labial and pulpal sides of each ED specimen were ground flat and polished with water-cooled carborundum discs (500, 800, 1,000, 1,200, 2,400, and 4,000 grits Water Proof Silicon carbide Paper, Stuers, Erkrat, Germany) in a polishing device (DP-U3, Struers, Denmark). Thereby, the ED samples were trimmed to a thickness of 2 mm, with the enamel and dentine section each 1 mm thick.
BaselineL* values of both ED specimens of each tooth were assessed under standardized ambient conditions according to the CIE-Lab* system using a dental colorim-eter (Shade Eye®, Shofu, Kyoto, Japan). MeanL* value of each two ED specimens was used for stratified allocation among five groups with groups 1 to 4 (1, Whitestrips; 2, Illuminé 15%; 3, Opalescence Xtra Boost; 4, sodium perborate; Table 1) each n=80 (40×2 ED) samples and the control group n=80 (40×2 ED) samples. Within each group from 1 to 4, the samples were divided into four
Table 1 Active bleaching ingredients, hydrogen peroxide concentration, pH value, and application protocol of the bleaching agents Group Bleaching agent/manufacturer Active bleaching
ingredient
Hydrogen peroxide concentration
pH value Frequency and duration of application
1 WhitestripsTM (Procter & Gamble, Egham, UK)
6% H2O2 6% H2O2 6.4 Twice 30 min, each day on enamel surfaces
2 Illuminé 15% (Dentsply DeTrey, Konstanz, Germany)
15% carbamide peroxide
5.4% H2O2 6 2 h each day on enamel surfaces 3 Opalescence Xtra Boost
(Ultradent Products, South Jordan, Utah, USA)
38% H2O2 38% H2O2 7 30 min on days 1, 5, 10, 15, and 20 on enamel surfaces
4 Sodium perborate/distilled water (2 g/1 ml)
– 16.3% H2O2 11–12 Remained on the dentin surface during the whole experiment, but changed on days 5, 10, 15 and 20
The data of products 1 to 3 are given according to the manufacturer’s information. The hydrogen peroxide concentration and the pH value of the sodium perborate mixture (4) were evaluated as described in“Materials and methods.”
subgroups (A to D, corresponding to the timepoint of
measurement; see below) with each n=20 (10×2 ED)
specimens. After preparation, the specimens were stored in artificial saliva.
To allow for separate color measurement of enamel and dentine sections within the experiment, removal of the dentine layer of the first and the enamel layer of the second ED specimen of each tooth was necessary. Therefore, after color measurement of the ED specimens, the dentine or enamel layer, respectively, was completely removed by grinding and polishing resulting in one enamel sample (E) and one dentine sample (D). Samples E and D of the control group were prepared accordingly.
Bleaching treatment and post-bleaching period
Specimens of the control group were not bleached and prepared for separate color evaluation of E and D speci-mens at the respective timepoints.
Eighty ED specimens of each group from 1 to 4 were submitted to a 21-day whitening procedure for simulation of external (1, Whitestrips; 2, Illuminé 15%; 3, Opalescence Xtra Boost) or internal (4, sodium perborate mixture) bleaching treatment. The active bleaching ingredients of the products under evaluation and their application protocol are described in Table1.
For simulation of external bleaching procedures, the samples were treated with different home-bleaching (groups 1 and 2) and in-office-bleaching (group 3) agents according to manufacturers’ instructions for 21 days. The bleaching agents were applied in a humid atmosphere at 37°C on the enamel surfaces of the ED samples:
1. Whitestrips. The enamel surfaces were covered with a strip twice daily for 30 min each with storage time in saliva of 12 h in between treatments.
2. Illuminé 15%. The specimens were covered with a
layer of 2 mm of the whitening gel for 2 h each day and were stored in artificial saliva between treatments.
3. Opalescence Xtra Boost. The enamel surfaces were
treated with a 2-mm-thick layer for 30 min on days 1, 5, 10, 15, and 20, and were stored in artificial saliva between treatments.
In group 4, sodium perborate mixed with distilled water in a ratio of 2 g of powder to 1 ml of liquid was applied on the dentine surfaces of the ED specimens to simulate internal bleaching treatment of devital teeth. The mixture was applied as 2-mm-thick layer in a humid atmosphere at 37°C. This layer remained on the surface during the whole bleaching period and was renewed on days 5, 10, 15, and 20. The hydrogen peroxide concentration of the sodium perborate mixture was determined photometrically as described in detail previously [7,8]. The method is based
on the reaction of 4-aminoantipyrin and phenol with hydrogen peroxide catalyzed by peroxidase. Inorganic peroxide is oxidized by peroxidase, releasing oxygen that oxidise achromatic chromogenic hydrogen donors. Absor-bance of the coloring product (chinonimin) was measured at 510 nm. The pH value of the sodium perborate bleaching agent was measured subsequently after mixing using pH-indicator strips (Merck, Darmstadt, Germany).
For whitening treatment, the ED specimens were embedded in Teflon moulds (3-mm diameter), which allow only the enamel (groups 1 to 3) or dentine (group 4) surfaces to be covered by the bleaching agent, while the respective bottom of the specimen (groups 1–3, dentine surface; group 4, enamel surface) was placed in contact with artificial saliva to avoid dehydration. After treatment, the specimens were washed with tap water and re-immersed in artificial saliva. The artificial saliva was prepared according to the formulation of Klimek et al. [11] and was renewed 10 days each. In the 12-month post-bleaching period, the samples were stored in artificial saliva and alternately exposed to dark conditions or 12 h daylight for 14 days, respectively. The control teeth were not bleached but stored in artificial saliva for 21 days and also alternately exposed to dark conditions and daylight for 14 days in the post-bleaching period.
Color measurement
Before the experiment, baseline color of each ED specimen was assessed using a dental colorimeter (Shade Eye®, Shofu, Kyoto, Japan). Post-bleaching measurement was performed subsequently after bleaching (groups 1A to 4A) and 3 months (groups 1B to 4B), 6 months (1C to 4C), and 12 months (1D to 4D) after the bleaching treatment. Color of the 20 ED specimens of each subgroup was evaluated as described below. Thereafter, the dentine or enamel layer of the ED specimens was removed as described above resulting in ten enamel (E) and ten dentine (D) samples, which were submitted to color measurement.
The samples were carefully dried (not desiccated) and placed into individually prepared silicone moulds (Presi-dent, Coltène/Whaledent AG, Altstätten, Switzerland) that allow for exact and repeatable positioning of each specimen and color measurement under standardized ambient con-ditions. The colorimeter’s light sensor was set at right angles to the samples’ surfaces and could be fixed directly on the enamel surface as the diameter of the samples corresponds to the diameter of the colorimeter head. To maintain repeatable orientation of the test surface with the colorimeter, a line was scratched on the margin side of each sample to correspond with a line on the colorimeter head. The color of each sample was measured five times and averaged. The results of color measurement were quantified
in terms of three coordinate values (L*, a*, b*) established by the Commission International de l’Eclariage (CIE), which locate color of an object in a three-dimensional color space. TheL* axis represents the degree of lightness within a sample and ranges from 0 (black) to 100 (white). Thea* plane represents the degree of green/red color, while theb* plane represents the degree of blue/yellow within the sample.
The color of the ED samples at the respective timepoints was calculated in reference to the baseline values (ΔL, Δa, and Δb), with the following color definitions of the respective positive (+) and negative (−) value: ΔL = (+) white, (−) black; Δa = (+) red, (−) green; Δb = (+) yellow, (−) blue [7]. For determination of the overall color change ΔE, the following formula was used:
ΔE ¼ ΔLhð Þ2þ Δað Þ2þ Δað Þ2i1=2:
As the respective baseline color of the E and D samples
could not be assessed, L*a*b* values of the E and D
samples of the unbleached control group served as reference and was evaluated at baseline (0 months) and after 3, 6, and 12 months.
Statistical analysis
Mean differences inL*a*b* of the baseline and the respective post-bleaching values (subgroups A–D) of ED samples in groups 1 to 4 were calculated and used for determination of ΔE. For E and D specimens, L*a*b* values were submitted to the statistical analysis and compared with the reference values of the control group. The data of the ED specimens were statistically analyzed by one-way analysis of variance (ANOVA) followed by Bonferroni-adjusted post hoc tests. For statistical analysis of E and D specimens, one-way ANOVA followed by Dunnett-adjusted and Bonferroni-adjusted post hoc tests were applied. The overall level of significance was set atp<0.05.
Results
The mean overall color changeΔE (±standard deviation) of
ED specimens in groups 1–4 is presented in Fig. 1.
Bleaching treatment led to a significant color change of ED specimens compared to baseline values. Thereby,ΔE values of groups 1–4 amounted to 8.9 to 15.9 subsequently after bleaching (Fig.1). In all groups, a significant increase ofL* values (Fig.2a) and decrease ofb* values (Fig.2b) could be observed, indicating a shift in the direction of white and less yellow. With regard to Δa, only small changes amounting to 0.2 to 2.7 could be observed after bleaching treatment. After 12 months,a* values fell below
the baseline values in all groups. As the variance of a* values has a minor influence on total color change, the results of thea* values were not put into graphs.
Within the observation period,L* values of ED samples declined toward baseline. After 12 months, L* values of groups 1 and 2 (p>0.09) were not significantly different compared to the baseline, while lightness of groups 3 and 4 was still slightly increased (p<0.01, Fig. 2a). In contrast, Δb was still significantly decreased at the end of the observation period in all groups (p<0.001, Fig. 2b). Compared to the baseline, the overall color change of ED specimens also did not achieve the baseline values (p< 0.001) but declined and then rebounded within the observation period (Fig. 1).
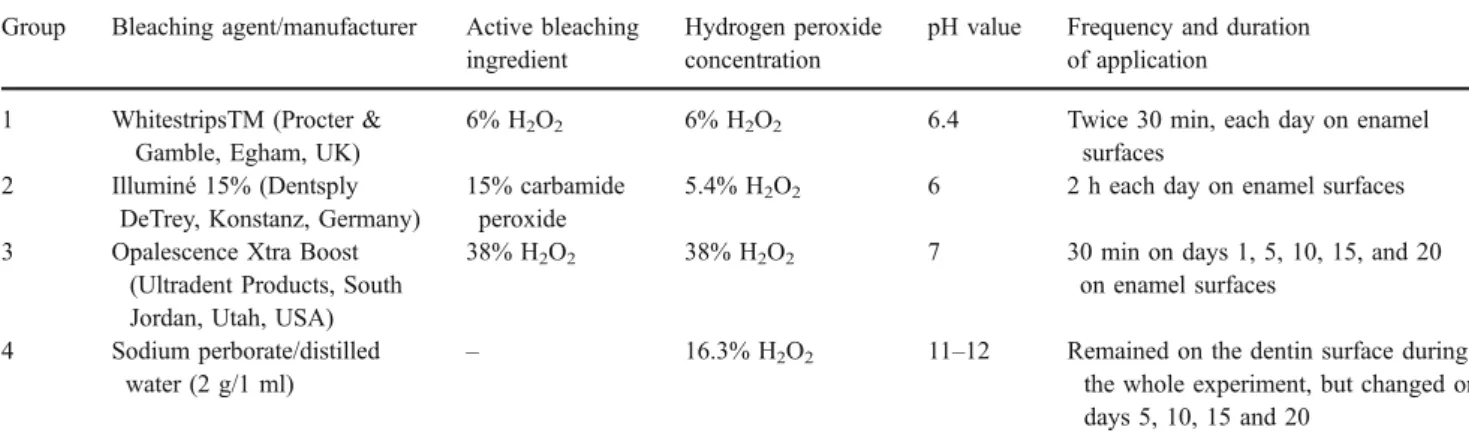
L* and b* values of the separated E and D samples are shown in Figs.3 and4 compared to the respective control values. Statistical analysis of the E and D control samples found no significant differences ofL* and b* values after 0, 3, 6, and 12 months.
With regard to E samples (Fig. 3), bleaching treatment resulted in significantly higher L* and lower b* values compared to the control. In all groups, color regression was characterized by a drop of L* values toward the control values within the observation period. L* values were not significantly different from the controls after 12 months, with exception for the L* values of groups 1 and 4. In contrast, b* values of all groups were significantly lower from the b* value of the enamel control throughout the whole observation period. Bleaching treatment led to small changes of thea values (1.1 to 1.6 units) compared to the control. After 12 months,a* values of all groups decreased to or below the control group.
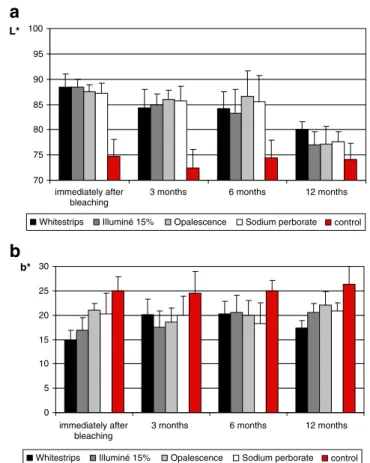
Color analysis of D samples (Fig. 4) revealed signifi-cantly higher L* of bleached specimens compared to the unbleached controls at the beginning of the observation period. Except for group 3 (Opalescence Extra Boost),
0 5 10 15 20 25 immediately after bleaching
3 months 6 months 12 months ∆ E
Whitestrips Illuminé 15% Opalescence Sodium perborate Fig. 1 Overall color change (mean ± SD) of enamel–dentine (ED) samples within the observation period. Color values at time“0” were obtained subsequently after 21 days bleaching treatment (baseline)
bleaching also resulted in significantly lower b* values compared to the control. After 12 months,L* and b* values of bleached samples decreased to or below the control values, except forb* values of groups 1 (Whitestrips) and 4 (sodium perborate), which still showed a significant shift into less yellow. As for the ED and E samples, bleaching treatment led to small changes of thea values (0.6 to 2.7 units) of the D samples compared to the control. After 12 months,a* values of all groups decreased to or below the control group.
The results of the between-group comparisons of color values at the beginning (0 months) and the end (12 months) of the observation period are presented in Tables2,3, and4. Overall, the external (Whitestrips, Illuminé 15%, and Opalescence Xtra Boost) and internal (sodium perborate mixture) bleaching agents performed similar regarding bleaching efficacy and color stability. While the statistical analysis of ED samples (Table2) revealed some significant differences between groups 1–4, between-group compari-son of E and D specimens mostly showed no differences (Tables3and 4).
Discussion
To allow for a systematic analysis of bleaching efficacy and color stability under standardized conditions, an in vitro model was applied using the preexisting color of bovine teeth [10]. The use of bovine teeth allowed the preparation of samples having a standardized size, which is compatible to the dimension of the colorimeter and an anatomically relevant tissue thickness. As found by Harris and Hicks [9] and Murray et al. [20], the average thickness of enamel and dentine in human maxillary incisors amounted to approx-imately 1 mm each. Due to the size of the bovine crown, two ED samples could be obtained from each tooth, which allow for preparation of one enamel (E) and dentine (D) sample from the same origin. The bleaching agents were applied according to the manufacturers’ information and to the techniques (at-home-, in-office-, walking-bleach tech-nique) to be simulated. Therefore, groups 1 and 2 aimed to simulate at-home-bleaching techniques with the application of whitening strips (group 1, 6% H2O2) or tray-based 15% -5 0 5 10 15 20 immediately after bleaching
3 months 6 months 12 months
immediately after
bleaching 3 months 6 months 12 months ∆ L
Whitestrips Illuminé 15% Opalescence Sodium perborate
-20 -15 -10 -5 0 ∆ b
Whitestrips Illuminé 15% Opalescence Sodium perborate
a
b
Fig. 2 a, b Changes ofL* and b* values (mean ± SD) of enamel– dentine (ED) samples within the observation period. Color values at time“0” were obtained subsequently after 21 day bleaching treatment (baseline) 70 75 80 85 90 95 100 L* 0 5 10 15 20 25 30 b* immediately after bleaching
3 months 6 months 12 months
immediately after bleaching
3 months 6 months 12 months
Whitestrips Illuminé 15% Opalescence Sodium perborate control Whitestrips Illuminé 15% Opalescence Sodium perborate control
a
b
Fig. 3 a, bL* and b* values (mean ± SD) of enamel (E) samples within the observation period compared to the respective control. Within the control samples, no significant differences in color values after 0 (subsequently after bleaching treatment), 3, 6, and 12 months could be observed. At the end of the observation period,L* values of groups 2 and 3, andb* values of groups 1–4 were still significantly different compared to the control values
carbamide peroxide gels (group 2) on enamel surfaces. In group 3, the highly concentrated hydrogen peroxide gel was applied five times for 30 min, imitating chair-side in-office bleaching treatment. For simulation of the walking-bleach technique (group 4), the mixture of sodium perborate and distilled water was applied on dentine surfaces as
recom-mended by Attin et al. [1]. Between the treatments and during the post-treatment observation period, the samples were stored in artificial saliva and exposed alternately to dark conditions or daylight to simulate clinical conditions in the oral cavity. As the L*a*b* values of the control samples remained unchanged throughout the whole obser-vation period, the in vitro model used represents a reliable tool for long-time determination of bleached teeth. How-ever, it has to be taken into consideration that the results obtained from in vitro studies cannot be directly applied to the clinical situation.
In all groups, bleaching treatment resulted in a significant overall color change (ΔE) of ED samples distinctly above the limit of visible discrimination of color differences, which is reported to be from one to three units [12,21]. As expected, the most pronounced changes could be observed inL* and b* values, which reflected the increase of lightness and reduction in yellowness by bleaching treatment. With regard
to a* values, only minimal changes in the red–green
direction occurred within the observation period. This is consistent with the results of Lenhard [13], indicating that the variance in a* values had a minor influence on total tooth-color change. The overall color change of ED samples is also reflected by the color change of E and D samples, which also showed an increase of lightness and a reduction in yellowness. As the external (groups 1–3) and internal (group 4) bleaching techniques performed similar with regard to the whitening effects of enamel (E) or dentine (D) samples, respectively, it might be assumed that the ED specimens were penetrated and bleached uniformly irrespec-tive of the agents’ hydrogen peroxide concentration and whether the agent was applied on enamel or dentine.
Within the observation period, the color changes of ED, E, and D samples due to the bleaching treatment were significantly reduced. Color regression might be the result of the previously oxidized substance that might become chemically reduced and causes the samples to reflect the old coloration of enamel or dentine. In vitro, organic substances of the artificial saliva might contribute to the 70 75 80 85 90 95 100 L*
Whitestrips Illuminé 15% Opalescence Sodium perborate control
0 5 10 15 20 25 30 b* immediately after bleaching
3 months 6 months 12 months
immediately after bleaching
3 months 6 months 12 months
Whitestrips Illuminé 15% Opalescence Sodium perborate control
a
b
Fig. 4 a, bL* and b* values (mean ± SD) of dentine (D) samples within the observation period compared to the respective control. Within the control samples, no significant differences in color values after 0 (subsequently after bleaching), 3, 6, and 12 months could be observed. At the end of the observation period, only b* values of groups 1 (Whitestrips) and 4 (sodium perborate) were significantly decreased compared to the controls
Table 2 Results of the Bonferroni-adjusted post hoc tests (p values) for between-group comparisons of enamel–dentin (ED) color values after 0 (subsequently after bleaching) and 12 months
Color value ΔE ΔL Δb
Observation period/months 0 12 0 12 0 12
Whitestrips–Illuminé 15% <0.0001* 0.0004* <0.0001* 0.3176 <0.0001* <0.0001* Whitestrips–Opalescence Xtra Boost <0.0001* <0.0001* 0.0643 0.0058* <0.0001* <0.0001* Whitestrips–sodium perborate <0.0001* 0.0046* <0.0001* 0.0187 <0.0001* 0.0135 Illuminé 15%–Opalescence Xtra Boost 0.6466 0.3502 0.0358 0.0002* 0.5585 0.6884 Illuminé 15%–sodium perborate 0.0269 0.4323 0.9067 0.0010* 0.0450 0.2746 Opalescence Xtra Boost–sodium perborate <0.0081* 0.0878 0.0271 0.6651 0.1509 0.1370 Comparisons in this table are not significant unless the correspondingp value is less than 0.0083. Significant differences were marked by an asterisk.
color regression. In the clinical situation, external chrom-ogens (coffee, wine, nicotine, metallic ions) might contrib-ute to the color regression of whitened teeth. This might explain the results of some in vivo studies, which showed that long-term color retention of bleached teeth is less stable. Matis et al. [18] found a meanΔE reversal of 65% after 6 weeks [18] and of 50% after 6 months post-bleaching [17]. In contrast, other studies reported only slight color changes of bleached teeth in the 6 months post-bleaching period [3,25].
Remarkably, in E and D samples, the decrease of yellowness due to bleaching remained nearly constant over time, even resulting in a persistent overall color changeΔE of ED samples above baseline values. After 12 months,ΔE of ED samples was decreased compared to the color at the beginning of the observation period but still increased above the limit for visible discrimination compared to the pre-bleaching values. It might be speculated that bleaching led to an irreversible degradation of organic substances contributing to the reduction of yellowness of the teeth.
ΔE and especially Δb of ED samples showed some fluctuations within the observation period, which cannot be explained by information of the current literature. Maybe, bleaching treatment induces some alterations within the dental hard tissues, which in turn are not stable but
subjected to continuous reorganization over time. However, as the colorimeter was calibrated accordingly to the manufacturers’ recommendation before each measurement and the control samples did not change over time, an error in measurement can be excluded.
However, for most instances, color regression of enamel, dentine, and combined enamel–dentine was characterized by a decrease of lightness. Thus, the results indicate that color regression of bleached teeth (combined enamel– dentine) is mostly provoked by the reversal of enamel and dentine lightness.
Moreover, the bleaching techniques applied and the differently concentrated bleaching agents seem to be equally effective under standardized in vitro conditions. However, it cannot be excluded that differences in bleaching efficacy or color stability might occur when bleaching would be performed on stained samples or when samples were stored in a staining solution in the post-bleaching period.
Conclusion
The whitening effects of in vitro bleached tooth samples are not stable in the 12-month observation period. Color change of enamel, dentine, and combined enamel–dentine is mostly
Table 3 Results of the Bonferroni-adjusted post hoc tests (p values) for between-group comparisons of enamel (E) color values after 0 (subsequently after bleaching) and 12 months
Color value L b
Observation period/months 0 12 0 12
Whitestrips–Illuminé 15% 0.9923 0.0321 0.1748 0.0107
Whitestrips–Opalescence Xtra Boost 0.4519 0.0333 <0.0001* 0.0003*
Whitestrips–sodium perborate 0.3015 0.0773 0.0005* 0.0055
Illuminé 15%–Opalescence Xtra Boost 0.4462 0.9872 0.0055 0.2202
Illuminé 15%–sodium perborate 0.2970 0.6915 0.0226 0.8052
Opalescence Xtra Boost–sodium perborate 0.7763 0.7033 0.5907 0.3254 Comparisons in this table are not significant unless the correspondingp value is less than 0.005. Significant differences were marked by an asterisk.
Table 4 Results of the Bonferroni-adjusted post hoc tests (p values) for between-group comparisons of dentin (D) colour values after 0 (subsequently after bleaching) and 12 months
Color value L b
Observation period/months 0 12 0 12
Whitestrips–Illuminé 15% 0.9642 0.9276 0.9455 <0.0001*
Whitestrips–Opalescence Xtra Boost 0.1440 0.1335 <0.0001* <0.0001*
Whitestrips–sodium perborate 0.0353 0.8768 0.1893 0.0350
Illuminé 15%–Opalescence Xtra Boost 0.1564 0.1122 <0.0001* 0.9520
Illuminé 15%–sodium perborate 0.0391 0.8058 0.2128 0.0100
Opalescence Xtra Boost–sodium perborate 0.5017 0.1771 0.0009* 0.0085 Comparisons in this table are not significant unless the correspondingp value is less than 0.005. Significant differences were marked by an asterisk.
characterized by a decrease of lightness. However, even after 12 months, overall color change ΔE did not achieve baseline values of unbleached samples. Bleaching efficacy of the different bleaching agents or bleaching techniques, respec-tively, was not different under standardized in vitro con-ditions. Thus, the formulated null hypotheses were accepted.
References
1. Attin T, Paqué F, Ajam F, Lennon AM (2003) Review of the current status of tooth whitening with the walking bleach technique. Int Endod J 36:313–329
2. Auschill TM, Hellwig E, Schmidale S, Sculean A, Arweiler NB (2005) Efficacy, side-effects and patients’ acceptance of different bleaching techniques (OTC, in-office, at-home). Oper Dent 30:156–163
3. Brunton PA, Ellwood R, Davies R (2004) A six-month study of two self-applied tooth whitening products containing carbamide peroxide. Oper Dent 29:623–626
4. Deliperi S, Bardwell DN (2005) Two-year clinical evaluation of nonvital tooth whitening and resin composite restorations. J Esthet Restor Dent 17:369–378
5. Dietschi D, Rossier S, Krejci I (2006) In vitro colorimetric evaluation of the efficacy of various bleaching methods and products. Quintessence Int 37:515–526
6. Hannig C, Lindner D, Attin T (2007) Efficacy and tolerability of two home bleaching systems having different peroxide delivery. Clin Oral Investig 11:321–329
7. Hannig C, Willenbücher S, Becker K, Attin T (2006) Recovery of peroxides in saliva during home bleaching—influence of smok-ing. J Oral Rehabil 33:533–541
8. Hannig C, Zech R, Henze E, Dorr-Tolui R, Attin T (2003) Determination of peroxides in saliva—kinetics of peroxide release into saliva during home-bleaching with Whitestrips and Vivastyle. Arch Oral Biol 48:559–566
9. Harris EF, Hicks JD (1998) A radiographic assessment of enamel thickness in human maxillary incisors. Arch Oral Biol 43:825–831 10. Joiner A (2006) The bleaching of teeth: a review of the literature.
J Dent 34:412–419
11. Klimek J, Hellwig E, Ahrens G (1982) Fluoride taken up by plaque, by the underlying enamel and by clean enamel from three fluoride compounds in vitro. Caries Res 16:156–161
12. Kuehni FG, Marcus RT (1979) An experiment in visual scanning of small color differences. Color Res Appl 4:83–91
13. Lenhard M (1996) Assessing tooth colour change after repeated bleaching in vitro with a ten percent carbamide peroxide gel. J Am Dent Assoc 127:1618–1624
14. Leonard RH (2000) Nighguard vital bleaching: dark stains and long-term results. Compend Contin Educ Dent Suppl 28:S18–27 15. Leonard RH, Sharma A, Haywood VB (1998) Use of different
concentration of carbamide peroxide for bleaching teeth: an in vitro study. Quintessence Int 29:507
16. Lim MY, Lum SO, Poh RS, Lee GP, Lim KC (2004) An in vitro comparison of the bleaching efficacy of 35% carbamide peroxide with established intracoronal bleaching agents. Int Endod J 37:483–488
17. Matis BA, Cochran MA, Eckert G, Carlson TJ (1998) The efficacy and safety of a 10% carbamide peroxide bleaching gel. Quintessence Int 29:555–563
18. Matis BA, Cochran MA, Franco M, Al-Ammar W, Eckert GJ, Stropes M (2007) Eight in-office tooth whitening systems evaluated in vivo: a pilot study. Oper Dent 32:322–327 19. Matis BA, Mousa HN, Cochran MA, Eckert GJ (2000) Clinical
evaluation of bleaching agents of different concentrations. Quintessence Int 31:303–310
20. Murray PE, Stanley HR, Matthews JB, Sloan AJ, Smith AJ (2002) Age-related odontometric changes of human teeth. Oral Surg Oral Med Oral Pathol Oral Radiol Endod 93:474–482
21. Ruyter IE, Nilnu K, Moller B (1987) Color stability of dental composite resin materials for crown and bridge veneers. Dent Mater 3:246–251
22. Shin DH, Summitt JB (2002) The whitening effect of bleaching agents on tetracycline-stained rat teeth. Oper Dent 27:66–72 23. Sulieman M, Addy M, MacDonal E, Rees JS (2004) The effect of
hydrogen peroxide concentration on the outcome of tooth whitening: an in vitro study. J Dent 32:295–299
24. Wiegand A, Vollmer D, Foitzik M, Attin R, Attin T (2005) Efficacy of different whitening modalities on bovine enamel and dentin. Clin Oral Investig 9:91–97
25. Zantner C, Derdilopolou F, Martus P, Kielbassa AM (2006) Randomized clinical trial on the efficacy of 2 over-the-counter whitening systems. Quintessence Int 37:695–706
26. Zantner C, Derdilopolou F, Martus P, Kielbassa AM (2006) Randomized clinical trial on the efficacy of a new bleaching lacquer for self-application. Oper Dent 31:308–331
27. Ziebolz D, Helms K, Hannig C, Attin T (2007) Efficacy and oral side effects of two highly concentrated tray-based bleaching systems. Clin Oral Investig 11:267–275