S U P P L E M E N T A R T I C L E
HIV Drug Resistance Early Warning Indicators
in Cohorts of Individuals Starting Antiretroviral
Therapy Between 2004 and 2009: World Health
Organization Global Report From 50 Countries
Diane E. Bennett,1Michael R. Jordan,2,3Silvia Bertagnolio,2Steven Y. Hong,3Giovanni Ravasi,4James H. McMahon,5Ahmed Saadani,2and Karen F. Kelley2
1US Centers for Disease Control and Prevention, Atlanta, Georgia;2World Health Organization, Geneva, Switzerland;3Tufts University School of
Medicine, Boston, Massachussetts;4Pan American Health Organization, Brasilia, Brazil; and5Department of Infectious Diseases, Alfred Hospital,
Melbourne, Australia
The World Health Organization developed a set of human immunodeficiency virus drug resistance (HIVDR) early warning indicators (EWIs) to assess antiretroviral therapy clinic and program factors associated with HIVDR. EWIs are monitored by abstracting data routinely recorded in clinical records, and the results enable clinics and program managers to identify problems that should be addressed to minimize preventable emergence of HIVDR in clinic populations. As of June 2011, 50 countries monitored EWIs, covering 131 686 patients initiating antiretroviral treatment between 2004 and 2009 at 2107 clinics. HIVDR prevention is associated with patient care (appropriate prescribing and patient monitoring), patient behavior (adherence), and clinic/program management efforts to reduce treatment interruptions (follow up, retention on first-line ART, procurement and supply management of antiretroviral drugs). EWIs measure these factors and the results have been used to optimize patient and population treatment outcomes.
The rapid scale-up of antiretroviral therapy (ART) for human immunodeficiency virus (HIV) in resource-limited settings (RLSs) is an international healthcare priority. By December 2010, 6.6 million people living with HIV in low- and middle-income countries were receiving ART, representing an increase of .1.4 million people from December 2009 and a 22-fold increase in 10 years [1]. The public health approach to scaling up ART in RLSs includes standardized and simplified treatment regimens consistent with international stand-ards and appropriate to local circumstances [2].
Treatment of millions of HIV-infected patients will inevitably be accompanied by the emergence and
transmission of HIV drug resistance (HIVDR). The human and financial implications of HIVDR are significant; HIVDR limits treatment options and necessitates switching to second-line regimens that produce more long-term toxicity [3–6]. Moreover, the annual cost of a second-line protease inhibitor– based regimen is 4–8 times higher than that of cur-rently recommended first-line nonnucleoside reverse transcriptase inhibitor (NNRTI)–based regimens [7]. Although the proportion of patients on second-line ART is currently small in most RLSs (,3%) [8], the number of patients requiring second-line drugs will increase.
In most RLSs, HIVDR testing is neither routinely available nor recommended for individual patient man-agement. Genotyping is expensive and complex, and the alternative regimens currently available in most RLSs limit possible treatment options. However, the mon-itoring of patient and clinic factors associated with the emergence of preventable HIVDR is comparatively
Correspondence: Diane Bennett, MD, MPH, Centers for Disease Control and Prevention, Mailstop E46, Atlanta, GA 30333 (dib1@cdc.gov).
Clinical Infectious Diseases 2012;54(S4):S280–9
Published by Oxford University Press on behalf of the Infectious Diseases Society of America 2012.
inexpensive and can be used to identify these factors and reduce their harmful consequences [9,10].
The World Health Organization (WHO) developed a set of HIVDR early warning indicators (EWIs) that assess ART, pa-tient, clinic, and program factors associated with HIVDR emergence and provide targets for optimal functioning of clinics and programs. Emergence of HIVDR in treated populations is associated with factors related to patient care (appropriate pre-scribing and viral load [VL] suppression at 12 months), patient behavior (adherence), and clinic-level and program manage-ment (follow-up, retention on first-line ART, and procuremanage-ment and supply management of antiretrovirals [ARVs]). HIVDR EWIs monitor these factors and provide evidence for action to be taken at clinic or program levels to optimize population treatment outcomes [11]. WHO HIVDR EWIs and corre-sponding targets are listed inTable 1.
EWI 1 assesses prescribing practices. Four of the 7 EWIs serve as proxies for treatment interruptions: EWI 2 (patient loss to follow-up), EWI 4 (on-time ARV pickups), EWI 5 (on time ART clinic appointment keeping), and EWI 6 (ARV stock-outs). EWI 3 (retention on first-line ART at 12 months) as-sesses clinic and program management functioning, and EWI 7 monitors ART adherence using standardized measures such as pill count or visual analogue scale. EWI 8 measures HIV RNA suppression (VL ,1000 copies/mL) at 12 months.
Prescribing practices are closely associated with the emer-gence of HIVDR. For example, the prescribing of mono- and dual-ART are treatment approaches that are not recommended by international guidelines due to the rapid selection of drug-resistant HIV [12–16]. Likewise, inappropriate dosing in pediatric populations may lead to insufficient drug pressure to effect VL suppression, leading to the selection of drug-resistant virus.
A challenge to long-term ART programmatic success is maintaining populations of patients on ART without treatment interruptions. Treatment interruptions may arise due to poor patient adherence or may occur as an unintended conse-quence of ARV supply interruption at ART clinic dispensaries [17–20]. Notably, ART interruptions of $48 hours in patients receiving NNRTI-based regimens are associated with the selec-tion of drug-resistant HIV [19, 21,22]. Pharmacy-based esti-mates of adherence such as on-time ARV pickups predict virological and HIVDR outcomes [23–26]. Significantly, ARV stockouts are linked to the emergence of HIVDR in adult and pediatric populations [17–20,23,27,28].
By routinely monitoring ART prescribing practices, loss to follow-up, retention on first-line ART, on-time drug pickups and appointment keeping, ARV supply continuity, and VL suppression of ART patients, clinics and programs may make necessary adjustments to minimize factors associated with HIVDR emergence.
EWIs are monitored using a standardized methodology that first samples patients consecutively according to ART start date, depending on the total number of patients at each site starting ART during the target year or years and then abstracts the data from medical or pharmacy records on these patients [9, 11]. WHO recommends standardized EWI definitions and targets, supported by abstraction tools. National ART programs select HIVDR EWIs for monitoring based on national priorities and the feasibility of data abstraction. EWI results are generalizable to the population of patients starting or receiving ART at the clinic during the year assessed. Because data routinely recorded in patients’ medical and pharmacy records are used to calculate HIVDR EWIs, EWI monitoring is easily integrated into existing national ART monitoring and evaluation programs.
WHO recommends that EWIs be monitored annually at all ART clinics within a country or at a large number of repre-sentative clinics [9, 11]. HIVDR EWIs are recommended for both adult and pediatric populations and should be moni-tored separately even if both pediatric and adult patients are treated at the same clinic. Data abstraction is identical in both populations except that pediatric EWIs monitor the appro-priate dosing for weight and the availability of pediatric ARV formulations.
In order to minimize potential bias associated with clinic self-reports, current WHO EWI guidance recommends that in the
Table 1. World Health Organization HIV Drug Resistance Early
Warning Indicators and Associated Targets
EWI EWI Target (%)
1. Prescribing practices (% of initial ART prescriptions congruent with national/ WHO guidelines)
100
2. Loss to follow-up (% of patients lost to follow-up at 12 mo)
#20 3. Retention on first-line ART (% of patients
retained on first-line ART at 12 mo)
$70 4. On-time pill pickup (% of patients with
100% on-time drug pickups during the first 12 mo of ART, or during a specified time period)
$90
5. On-time clinic appointment keeping (% of patients who attended all appointments on time during the first 12 mo of ART, or during a specified time period)
$80
6. Drug supply continuity (% of clinics with antiretroviral drug supply continuity during a 12-mo period)
100
7. Adherence as measured by pill count (% patient adherence to ARVs by pill count or other standardized measure)
$90
8. Viral load suppression 12 mo after ART initiation (% of patients with viral load ,1000 copies/mL at 12 mo)
$70
Abbreviations: ART, antiretroviral therapy; EWI, early warning indicator; HIV, human immunodeficiency virus; WHO, World Health Organization.
first 1–2 years of EWI monitoring, data abstraction and analysis be performed by teams coordinated by a country’s Ministry of Health and not by staff from the clinics that are being monitored [11]. Once analyzed, clinic-specific results are communicated to participating clinics through supervisory visits or national workshops. Annually, EWI results are disseminated nationally and globally through WHO.
METHODS
Adult and pediatric EWI monitoring results are reported yearly to WHO by participating countries from 5 WHO regions: the African region; the Pan-American region, which includes Latin America and the Caribbean (LAC); the Southeast Asia region; the Western Pacific region; and the European region. The results were analyzed by region and by the year of treatment initiation of the cohort surveyed. For regional analyses, the total number of clinics meeting the target for each EWI was calculated as a percentage of all the clinics monitored in the region. For analyses based on year, cohorts bridging more than 1 year were reported in the latest cohort start year. We calculated 2-sided 95% exact binomial confidence intervals using SAS software, version 9.2 (SAS Institute, Cary, North Carolina). The countries in the Western Pacific and Southeast Asia regions were combined. Data from the Ukraine were ex-cluded from regional analyses, as the Ukraine was the sole country monitoring EWIs in Europe. Trends over time within countries and regions were not assessed owing to different clinics and countries reporting data each year.
RESULTS
As of June 2011, a total of 50 countries reported results from cohorts of patients initiating ART during 2004–2009, assessing 131 686 patients at 2107 ART clinics (Africa: 907 clinics in 25 countries; Asia: 1048 clinics in 6 countries; LAC: 148 clinics in 18 countries; and Europe: 4 clinics in 1 country).
Adult EWIs
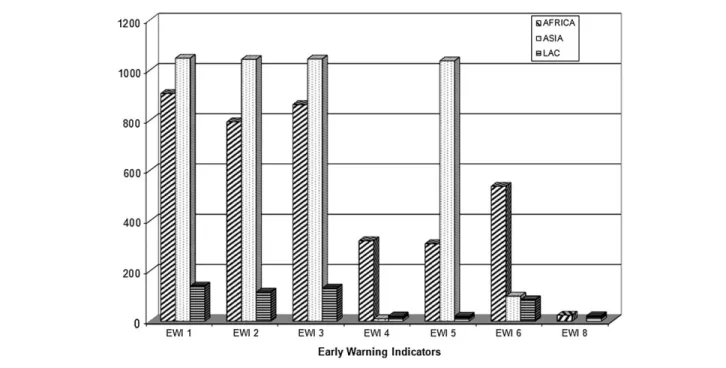
Figure 1shows the number of clinics monitoring each EWI in adults. EWIs 1–3 (prescribing practices, loss to follow-up, and retention on first-line ART at 12 months, respectively) were monitored at 93%–99% of clinics. EWI 5 (on-time appointment keeping) was monitored in 65% of clinics, and EWIs 4 and 6 (on-time ARV pickup and ARV supply continuity, respectively) at a minority of clinics (17% and 34%, respectively). EWI 8 (VL suppression at 12 months) was monitored in only 2% of clinics. EWI 7 (adherence assessed through pill count) was monitored by only 2 countries (,1% of clinics) and the data for EWI 7 were excluded in these analyses. Adult EWI results by country and by year are reported inSupplementary Table 1A. Results by region and year of adult cohort ART starting with 95% confidence intervals are reported inTable 2.
The percentages of clinics meeting WHO targets by EWI and region are presented inFigure 2. Aggregate data are summarized below.
d EWI 1 (prescribing of ART congruent with national/WHO guidelines): globally, 75% of clinics monitored met the target of 100% of patients receiving prescriptions for ART congruent
with national/WHO guidelines. Among participating clinics, 74% in Africa, 80% in Asia, and 46% in LAC met this target. d EWI 2 (loss to follow-up at 12 months): overall, 69% of clinics met the target of #20% patients lost to follow-up at 12 months with 59%, 75%, and 85% of clinics meeting the target in Africa, Asia, and LAC, respectively.
d EWI 3 (retention on first-line ART): 67% of clinics met the target of $70% of patients retained on first-line ART at 12 months with 61%, 72%, and 71% of clinics meeting the target in Africa, Asia, and LAC, respectively.
d EWI 4 (on-time drug pickup): 17% of 352 clinics met the target of $90% of patients picking up their ARV on time 100% of the time with 15%, 0%, and 57% of clinics meeting the target in Africa, Asia, and LAC, respectively.
d EWI 5 (on-time appointment keeping): globally, 58% of clinics met the target of $80% of patients keeping 100% of clinical appointments on time with 43%, 64%, and 15% of clinics meeting the target in Africa, Asia, and LAC, respectively. d EWI 6 (ARV supply continuity): 65% of clinics met the EWI 6 target of 100% ARV supply continuity with 63%, 89%, and 51% of clinics meeting the target in Africa, Asia, and LAC, respectively.
d EWI 8 (VL suppression ,1000 copies/mL at 12 months): only 6 countries from all regions reported this indicator. Of the 46 clinics reporting, 85% of clinics met the target of $70% of patients showing VL suppression 12 months after ART initiation, with 96% and 73% of clinics meeting the target in countries reporting from Africa and LAC, respectively. Pediatric EWIs
In cohorts of patients starting ART between 2006 and 2009, 6 countries monitored pediatric EWI at 359 clinics (Africa: 21 clinics in 2 countries; Asia: 334 clinics in 3 countries; LAC: 4 clinics in 1 country). Of these 359 clinics, 296 (82%) were in Thailand. All 6 countries monitored EWIs 1 and 3; 5 monitored EWI 2; 2 countries monitored EWI 6, and no country moni-tored EWI 4 or 8.
Results of pediatric EWI monitoring are presented in
Supplementary Table 1B by country and by year. For EWI 1, the percentages of clinics meeting the target ranged from 50% (in Zimbabwe) to 100% (in Cambodia and Botswana); for EWI 2, from 74% (Thailand) to 100% (Cambodia, Vietnam, Zimbabwe); for EWI 3, from 50% (Zimbabwe) to 100% (Dominican Republic, Vietnam); for EWI 5, from 67% (Thailand) to 75% (Cambodia, Vietnam); and for EWI 6, from 88% (Cambodia) to 100% (Dominican Republic). DISCUSSION
Emergence of HIVDR in treated patients increases the cost of ART in all countries. In low- and middle-income settings, this
burden can limit the pace of ART scale-up and the number of patients receiving treatment. For a country providing services for a growing number of treatment-eligible patients, the annual cost of providing second-line ART to a single patient equals the cost of maintaining 3–4 people on first-line ART [7]. For populations being treated in these settings, drug resistance se-verely restricts the already limited regimen options.
The number of adult patients on second-line ART continues to be low in most regions, with the exception of LAC, where nearly 28% were on second-line and 3% were on salvage regimens in 2010 [8]. However, it is not clear to what extent the limited capacity of countries to timely diagnose treatment failure or the limited availability and high cost of second-line drugs contribute to continued small percentages of patients on second-line treatment in most countries.
As ART roll-out continues, increased rates of HIVDR may occur. Recent WHO data document moderate (5%–15%) levels of transmitted HIVDR in specific geographic regions [29], underscoring the importance of addressing and minimizing HIVDR at both the national program and clinic levels.
Analysis of HIVDR EWI monitoring in 50 countries led to many valuable observations. Most countries, except in LAC, had relatively few clinics that did not meet the 100% target for prescribing first-line regimens congruent with national/ WHO guidelines (EWI 1). EWI 1 assesses a clinic’s use of simplified highly active first-line combination regimens that support viral suppression. Treatment with ,3 drugs or with a nonpotent 3-drug regimen can lead to virologic failure [12,14,16] and HIVDR [15,30]. An unintended limitation of this indicator was that even though first-line regimens that contained protease inhibitors, or under certain circumstances, tenofovir, would not have selected for HIVDR, they were classified as inappropriate if not recommended by national guidelines. For example, nonstandard prescribing practices reported in LAC countries may have resulted from a more individualized ART approach rather than a public health ap-proach based on standardized regimens [31].
Globally, 69% of clinics that were assessed met the targets for retention on first-line ART at 12 months. Retention of patients on first-line ART at 12 months after ART initiation (EWI 3) is important in RLS because many clinics have only 1 second-line regimen available, and no salvage regimens. Thus, optimizing patient adherence to first-line ART and minimizing inappropriate switching to second-line ART during the first 12 months is critical to the long-term success of population-based ART.
Only 21 of 50 countries (42%) had records enabling ab-straction of on-time ARV pickups (EWI 4) and many countries performed poorly on this indicator: in countries reporting from Africa, only 15% of 321 adult clinics met the target; in Asia, 0% of 10 adult clinics met the target; and in Latin HIVDR EWIs: 50-Country Summary Report d CID 2012:54 (Suppl 4) d S283
Table 2. Number of Clinics Monitored and the Percentage Meeting the Target by Early Warning Indicator, Region, and Year of Adult Cohort Antiretroviral Therapy Start Region Year Cohort Started ART EWI 1 (Prescribing Practices), No. (%) 95% CI EWI 2 (Loss to Follow-up), No. (%) 95% CI EWI 3 (Retention on First-Line ART 12 Mo), No. (%) 95% CI EWI 4 (On-Time ARV Pickup), No. (%) 95% CI EWI 5 (On-Time Clinic Appointment Keeping), No. (%) 95% CI EWI 6 (Drug Supply Continuity), No. (%) 95% CI EWI 8 (Viral Load Suppression), No. (%) 95% CI Africa 2005–2006 193 80.9–91.0 191 74.3–86.0 191 47.1–61.7 10 .3–44.5 55 09.1–30.9 147 69.2–83.4 (86.5) (80.6) (54.5) (10.0) (18.2) (76.9)
6 countries 6 countries 6 countries 1 country 3 countries 3 countries
Asia 2005–2006 22 65.1–97.1 22 84.6–100 22 65.1–76.4 4 .0–60.2 18 52.4–93.6 18 65.3–98.6
(86.4) (100) (86.4) (00.0) (77.7) (88.9)
2 countries 2 countries 2 countries 2 countries 1 country 1 country
LAC 2004–2006 18 45.7–90.3 21 83.9–100 2 21.8–66.0 13 54.6–98.1 11 .0–28.5 18 21.5–69.2 1 2.5–100
(72.2) (100) (42.9) (84.6) (00.0) (44.4) (100)
5 countries 8 countries 9 countries 2 countries 1 country 8 countries 1 country
Africa 2007 309 70.2–80.0 281 58.5–70.0 285 65.6–76.4 120 16.1–31.9 139 16.3–30.9 226 52.2–65.8
(75.4) (64.4) (71.2) (23.3) (23.0) (59.3)
14 countries 13 countries 12 countries 7 countries 4 countries 10 countries
Asia 2007 47 79.6–97.0 47 79.6–97.6 47 66.7–90.9 4 .0–60.2 45 58.1–85.4 41 70.8–94.4
(91.5) (91.5) (80.9) (00.0) (73.3) (85.4)
3 countries 3 countries 3 countries 1 country 3 countries 3 countries
LAC 2007 41 32.9–64.9 41 65.1–91.2 42 52.9–82.4 1 .0–97.5 1 .0–97.5 32 26.4–62.3 7 29.2–100
(48.8) (80.5) (69.1) (00.0) (00.0) (43.8) (100)
11 countries 12 countries 9 countries 1 country 1 country 4 countries 3 countries
Africa 2008 180 77.7–88.9 174 39.5–54.8 167 21.8–66.0 125 06.9–19.0 41 26.3–57.9 124 48.1–66.1
(83.9) (47.1) (53.3) (12.0) (41.46) (57.3)
12 countries 11 countries 10 countries 12 countries 4 countries 8 countries
Asia 2008 943a 76.0–81.4 941a 69.5–75.3 943a 68.0–73.9 943a 59.9–66.2 41 80.1–98.5 (78.8) (72.5) (71.1) (63.1) (92.7)
2 countries 2 countries 2 countries 2 countries 1 country
LAC 2008 50 33.7–62.6 43 64.0–90.0 44 52.4–81.4 5 .0–52.2 5 .5–71.6 27 53.7–89.0 11 16.8–76.2
(48.0) (79.1) (68.2) (00.0) (20.0) (74.1) (45.5)
13 countries 9 countries 13 countries 2 countries 2 countries 7 countries 4 countries
Africa 2009 225 45.7–59.1 148 27.5–43.4 220 51.4–64.8 66 01.0–12.7 74 92.7–99.9 40 31.5–63.9 24 78.9–99.9
(52.4) (35.1) (58.2) (04.6) (98.7) (47.5) (95.8)
7 countries 5 countries 5 countries 4 countries 1 country 1 country 1 country
Asia 2009 36 90.26–100 33 84.6–100 33 75.7–98.1 2 .0–84.2 31 59.9–66.2
(100) (100) (90.9) (00.0) (64.5)
2 countries 1 country 2 countries 2 countries 1 country
LAC 2009 32 09.3–40.0 11 58.7–99.8 25 86.3–100 2 01.3–98.7 3 09.4–99.2 9 02.8–60.0 3 29.2–100 S284 d CID 2012:54 (Suppl 4) d Bennett et al
America and the Caribbean, 57% of 21 adult clinics met the target. It is important that barriers to on-time ARV pickups, such as the cost of services at the clinic [20, 28, 32–37], transportation availability [38–40], and long waiting times at the pharmacy be addressed [38].
Clinical appointment keeping (EWI 5) has been correlated with other measures of ART adherence [38, 41]. Only 16 countries monitored this indicator for adults, and only 3, all in Asia, monitored it for pediatric patients. Low percentages of pediatric clinics met the EWI 5 target. Clinic appointments are not recorded in records in many clinics, limiting the country’s ability to monitor this EWI.
Ideally, clinics should follow up patients who miss ap-pointments (EWI 5) within 48 hours. Although the ability to track defaulters is crucial to ensuring uninterrupted ART, and will become even more important as more individuals are started on ART at higher CD4 cell counts, most clinics do not have the resources for tracking and linking patients back into treatment. Examples of country efforts to improve patient tracing are described below.
The extent to which stockouts of routinely used ARVs (EWI 6) were reported is worrisome in all regions although slightly better in countries reporting from Asia, where 89% of 100 clinics in 4 countries met the target. As ART is scaled up and decentralized with increasing numbers of patients starting ART at higher CD4 cell counts, strengthened drug forecasting, procurement, and supply distribution must be prioritized to prevent ARV stockouts.
EWI 8 directly measures VL suppression at 12 months, but few clinics in our sample were able to monitor this EWI in-dicating that capacity to perform VL testing remains limited in the majority of settings monitored. As VL testing is scaled up, it is anticipated that this indicator will become the cor-nerstone of EWI monitoring. Individuals with suppressed VL by definition are not failing due to HIVDR. Multiple studies were identified reporting HIVDR outcomes after 12 months ART in RLS. These include three randomised control trials reporting the development of HIVDR in $ 70% patients with virological failure [42,43,44].
Very few countries monitored pediatric EWIs, probably be-cause the proportion of children on ART is a small fraction of the adult ART patient population in most countries [8]. Despite the low number of clinics monitored, most results are encour-aging. As pediatric ART expands with early infant diagnosis and the new WHO HIV treatment guidelines recommending ART for all HIV-infected children ,24 months of age [45] re-gardless of clinical or immunological conditions, the proportion of children on ART will increase and the monitoring of pediatric HIVDR EWIs should be prioritized in national HIV programs. Monitoring of HIVDR EWIs is an important component of global and national strategies to minimize the emergence of
Ta bl e 2 c onti n u ed. Region Year Coho rt Star ted ART EWI 1 (Presc ribing Practi ces), No. (% ) 95% CI EWI 2 (Los s to Fo llow-up ), No. (% ) 9 5 % CI EWI 3 (Retentio n o n First -Line AR T 1 2 M o), No. (%) 95% CI EWI 4 (O n-Time ARV Picku p), No. (% ) 95% CI EWI 5 (On-Tim e Cli nic Appoi ntmen t Ke eping), No. (% ) 95% CI EWI 6 (Dru g Supply Contin uity), No. (%) 95% CI EWI 8 (Viral Load Su ppress ion), N o . (%) 95% CI Africa All y ears 907 70.8–76.6 794 55.6–62.5 863 57.4–64.0 321 11.0–19.0 309 37.1–48.4 537 5 8.5–66.9 2 4 78.9–99.9 (73.8) (59.1) (60.7) (14.6) (42.7) (62.8) (95.8) Asia All y ears 1048 a 37.3–54.3 1043 a 71.8–77.2 1045 a 69.6–75.1 1 0 .0–30.9 1037 a 60.8–66.8 100 8 1.2–94.4 (80.3) (74.6) (72.4) (00.0) (63.8) (89.0) LAC All y ears 141 37.3–54.4 116 76.6–90.5 132 61.9–78.1 2 1 34.0–78.2 20 03.2–37.9 86 40.1–62.1 2 2 49.8–89.3 (45.7) (84.5) (70.5) (57.1) (15.0) (51.2) (72.7) Total, all regions All y ears 2095 a 73.2–77.0 1953 a 66.8–70.9 2040 a 65.3–69.4 352 13.0–21.1 1393 a 55.7–61.0 723 6 1.4–68.5 4 6 71.1–93.7 (75.1) (68.9) (67.4) (16.8) (58.4) (65.0) (84.8) No. is the n umber of clinics monitored a nd % is the percentage o f clinics meeting the target. Asia includes countries in the World Health Organization W estern Pacific and Southeast Asia regions. Abbreviations: ART, antiretroviral therapy; C I, confidence interval; EWI, e arly warning indicator; LAC, Latin American and the Caribbean. a In 2008, EWIs were reported from 902 sites in T hailand and 3 9–41sites in C ambodia.
preventable HIVDR. EWI monitoring identifies weaknesses at the ART clinic and program level that may result in suboptimal treatment or treatment interruptions in patients, potentially causing HIVDR emergence. EWI monitoring also identifies successful clinics that could serve as best practice models to other clinics. Many countries have used EWI monitoring re-sults to improve patient and clinic management.
EWI monitoring in several countries has highlighted weaknesses in patient information systems resulting in the inability to monitor specific EWIs such as EWI 4 and EWI 6. Reported weaknesses in current data systems include in-complete records, missing data, use of nonstandardized re-cords, and intra- and interclinic variability in data recording. In specific cases, limitations identified as a result of EWI moni-toring have prompted improvements in medical and pharmacy record keeping systems, including implementation of stan-dardized records and data recording procedures [46].
Based on EWI results documenting high rates of patient loss to follow-up, missed appointments, or failure to pick up ARVs on time, countries worked to improve patient tracking mecha-nisms. Improvements include reinforcing the capacity of ART clinics to monitor patient referrals and follow-up with de-faulters to minimize losses to follow-up. In Kenya, where none of the 18 clinics monitored met the target for on-time ap-pointment attendance for patients starting ART in 2007, a community health worker system to track defaulters was implemented in 2008. The Ministry of Health and Social Services in Namibia, which identified migrant workers as
being at risk of treatment interruptions, has planned an in-tensification of existing defaulter tracking systems through im-provements in its electronic record keeping system, the establishment of a national patient database with unique identifiers, and increased mobilization and redistribution of human resources [46].
In China, future pharmacy records will allow the calculation of patients’ medication possession ratio [24], which will provide a more accurate estimate of adherence. Pilot EWI results suggest that further investigation into reasons for drug pickup delays and increased operational research leading to adherence support are warranted [47]. In Papua New Guinea, after detailed discussions with clinic staff, important actions were taken to strengthen ART services and improve clinic per-formance: (1) establishment of a formalized referral system that includes compulsory documentation of patient transfers between clinics to ensure the transfer of medical records between clinics and providers, (2) regular review of patient clinic attendance and drug pickups for the purpose of identifying patients at risk for suboptimal adherence to ART and (3) identification of ways to remove barriers to on-time pill pickup by providing subsidies for transportation and food for those in need [48].
Several countries have implemented follow-up surveys to assess factors influencing EWI results (WHO, unpublished data). These surveys have investigated the influence of a range of factors known to be associated with ART adherence, including costs for treatment or drugs [12,14,16,46], travel distances and Figure 2. Percentage of adult clinics achieving the World Health Organization targets by early warning indicator (EWI) and region, with 95% confidence intervals, 2004–2009. Abbreviation: LAC, Latin America and the Caribbean.
lack of affordable transportation [20, 23, 24], long waiting times at the pharmacy [20], and stigma [46], all of which are important programmatic barriers to continuous ART access in RLSs.
This global report of HIVDR EWI includes results from the first country experiences with EWI monitoring and includes countries with very different health systems and resource availability that may have influenced their EWI findings. The monitoring sample varied according to resources available, with some countries sampling a small proportion of ART clinics while others canvassed most or all of them. Regional and global data were thus heavily influenced by country-specific data; for example, Thailand’s EWI monitoring contributed 902 of 2107 adult clinics (43%) in this analysis, and 296 of 331 pediatric clinics (89%). In addition, in the first year of data abstraction, clinic sampling was not representative of ART clinics nationally. While these data are unlikely to represent the countries or regions included, they provide background on the prevalence of factors associated with HIVDR emer-gence in ART patients. In 2011, EWI definitions, sampling and targets were revised and further simplified by WHO. The new guidance document and abstraction tools will be available on the WHO HIVDR web site in 2012 (http://www.who.int/hiv/ topics/drugresistance/en/index.html).
CONCLUSIONS
This is the first global report on WHO HIVDR EWI monitoring that summarizes results from 50 countries in .2000 clinics, assessing .130 000 patients receiving ART in RLSs between 2004 and 2009. HIVDR EWI monitoring is the foundation of global and national HIVDR surveillance activities in RLSs. It provides evidence of how well ART clinics function to mini-mize HIVDR and supports public health actions at both the ART clinic and national program levels to improve the quality of care for patients being treated. In addition, EWI results provide the necessary local ART program context to interpret laboratory-based surveys of transmitted and acquired HIVDR. At present, WHO recommends that EWI data be abstracted and analyzed by central teams coordinated by the Ministry of Health. However, as clinics become more familiar with EWI monitoring, it will be necessary for data abstraction, analysis, and reporting to be performed directly by clinic staff in order to achieve greater and routine implementation of EWIs.
If EWI results indicate challenges at a clinic, it is crucial that these be assessed and addressed by clinic, district, and national program managers. It will become increasingly apparent that the EWI results are valuable for program management and that EWI monitoring should be integrated into routine clinic monitoring to support quality assurance activities and optimization of patient care.
Supplementary Data
Supplementary materials are available at Clinical Infectious Diseases online (http://www.oxfordjournals.org/our_journals/cid/). Supplemen-tary materialsconsist of data provided by the author that are published to benefit the reader. The posted materials are not copyedited. The contents of all supplementary data are the sole responsibility of the authors. Questions or messages regarding errors should be addressed to the author.
Notes
Acknowledgments. The authors acknowledge the significant efforts of Ministries of Health in the countries whose data are reported here, and the National Health Security Office of Thailand. We also acknowledge the support of Drs Sherri Pals and Drew Baughman of the Centers for Disease Control and Prevention for statistical analyses.
Disclaimer. The conclusions and opinions expressed in this article are those of the authors and do not reflect those of their respective organ-izations, including the Centers for Disease Control and Prevention, the US Department of Health and Human Services, and the World Health Organization.
Financial support. EWI monitoring in countries was supported by grants from The Bill & Melinda Gates Foundation (38180), the Public Health Agency of Canada (6962-15-2008/8360001), the Spanish government (AF/NAM/BBA/701/XU/08), the Global Fund to fight AIDS, Tuberculosis and Malaria, the President’s Emergency Plan for AIDS Relief, the National Institutes of Health (K23 AI074423-05 to M. R. J. and L30 AI080268-02 to S. Y. H.), and the Lifespan/Tufts/Brown Center for AIDS Research (P30AI4853 to J. H. M.).
Supplement sponsorship. This article was published as part of a sup-plement entitled ‘‘The World Health Organization HIV Drug Resistance Prevention and Assessment Strategy: Global, Regional, and Country Progress,’’ sponsored by The Bill & Melinda Gates Foundation (38180).
Potential conflicts of interest. All authors: No reported conflicts. All authors have submitted the ICMJE Form for Disclosure of Potential Conflicts of Interest. Conflicts that the editors consider relevant to the content of the manuscript have been disclosed.
References
1. UNAIDS. AIDS at 30: nations at a crossroad. Available at: http:// www.unaids.org/unaids_resources/aidsat30/aids-at-30.pdf. Accessed 10 June 2011.
2. Gilks CF, Crowley S, Ekpini R, et al. The WHO public-health approach to antiretroviral treatment against HIV in resource-limited settings. Lancet 2006; 368:505–10.
3. Boesecke C, Cooper DA. Toxicity of HIV protease inhibitors: clinical considerations. Curr Opin HIV AIDS 2008; 3:653–9.
4. Haubrich RH, Riddler SA, DiRienzo AG, et al. Metabolic outcomes in a randomized trial of nucleoside, nonnucleoside and protease in-hibitor-sparing regimens for initial HIV treatment. AIDS 2009; 23:1109–18.
5. Murphy RA, Sunpath H, Kuritzkes DR, Venter F, Gandhi RT. Anti-retroviral therapy-associated toxicities in the resource-poor world: the challenge of a limited formulary. J Infect Dis 2007; 196(Suppl 3): S449–56.
6. Bruno R, Sacchi P, Maiocchi L, Patruno S, Filice G. Hepatotoxicity and antiretroviral therapy with protease inhibitors: a review. Dig Liver Dis 2006; 38:363–73.
7. Me´decins Sans Frontie`res. Untangling the web of antiretroviral price reductions, special report. Available at: http://utw.msfaccess.org/. Accessed 20 February 2012.
8. WHO/UNICEF/UNAIDS. Global HIV/AIDS Response: epidemic up-date and health sector progress towards universal access. Available
at: http://www.who.int/hiv/pub/progress_report2011/en/. Accessed 19 January 2012.
9. Bennett DE, Bertagnolio S, Sutherland D, Gilks CF. The World Health Organization’s global strategy for prevention and assessment of HIV drug resistance. Antivir Ther 2008; 13(Suppl 2):1–13.
10. Jordan MR. Assessments of HIV drug resistance mutations in resource-limited settings. Clin Infect Dis 2011; 52:1058–60.
11. World Health Organization. HIV drug resistance early warning in-dicators. World Health Organization indicators to monitor HIV drug resistance prevention at antiretroviral treatment sites. June 2010 up-date. Geneva, Switzerland: World Health Organization, 2010. 12. D’Aquila RT, Hughes MD, Johnson VA, et al. Nevirapine, zidovudine,
and didanosine compared with zidovudine and didanosine in patients with HIV-1 infection. A randomized, double-blind, placebo-controlled trial. National Institute of Allergy and Infectious Diseases AIDS Clinical Trials Group Protocol 241 Investigators. Ann Intern Med 1996; 124:1019–30.
13. Hammer SM, Katzenstein DA, Hughes MD, et al. A trial comparing nucleoside monotherapy with combination therapy in HIV-infected adults with CD4 cell counts from 200 to 500 per cubic millimeter. AIDS Clinical Trials Group Study 175 Study Team. N Engl J Med 1996; 335:1081–90.
14. Hammer SM, Squires KE, Hughes MD, et al. A controlled trial of two nucleoside analogues plus indinavir in persons with human immu-nodeficiency virus infection and CD4 cell counts of 200 per cubic millimeter or less. AIDS Clinical Trials Group 320 Study Team. N Engl J Med 1997; 337:725–33.
15. Larder BA, Darby G, Richman DD. HIV with reduced sensitivity to zidovudine (AZT) isolated during prolonged therapy. Science 1989; 243:1731–4.
16. Montaner JS, Reiss P, Cooper D, et al. A randomized, double-blind trial comparing combinations of nevirapine, didanosine, and zidovudine for HIV-infected patients: the INCAS Trial. Italy, the Netherlands, Canada and Australia Study. JAMA 1998; 279:930–7.
17. Nachega JB, Knowlton AR, Deluca A, et al. Treatment supporter to improve adherence to antiretroviral therapy in HIV-infected South African adults. A qualitative study. J Acquir Immune Defic Syndr 2006; 43(Suppl 1):S127–33.
18. Pasquet A, Messou E, Gabillard D, et al. Impact of drug stock-outs on death and retention to care among HIV-infected patients on combi-nation antiretroviral therapy in Abidjan, Cote d’Ivoire. PLoS One 2010; 5:e13414.
19. Oyugi JH, Byakika-Tusiime J, Ragland K, et al. Treatment inter-ruptions predict resistance in HIV-positive individuals purchasing fixed-dose combination antiretroviral therapy in Kampala, Uganda. AIDS 2007; 21:965–71.
20. Marcellin F, Boyer S, Protopopescu C, et al. Determinants of un-planned antiretroviral treatment interruptions among people living with HIV in Yaounde´, Cameroon (EVAL survey, ANRS 12-116). Trop Med Int Health 2008; 13:1470–8.
21. Parienti JJ, Das-Douglas M, Massari V, et al. Not all missed doses are the same: sustained NNRTI treatment interruptions predict HIV rebound at low-to-moderate adherence levels. PLoS One 2008; 3:e2783.
22. Parienti JJ, Massari V, Descamps D, et al. Predictors of virologic failure and resistance in HIV-infected patients treated with nevirapine- or efavirenz-based antiretroviral therapy. Clin Infect Dis 2004; 38:1311–6. 23. Boyer S, Clerc I, Bonono CR, Marcellin F, Bile PC, Ventelou B. Non-adherence to antiretroviral treatment and unplanned treat-ment interruption among people living with HIV/AIDS in Came-roon: individual and healthcare supply-related factors. Soc Sci Med 2011; 72:1383–92.
24. McMahon J, Jordan M, Kelley K, et al. Pharmacy adherence measures to assess adherence to antiretroviral therapy: review of the literature and implications for treatment monitoring. Clin Infect Dis 2011; 52:493–506.
25. Messou E, Chaix M-L, Gabillard D, et al. Association between med-ication possession ratio, virologic failure and drug resistance in HIV-1–infected adults on antiretroviral therapy in Cote d’Ivoire. J Acquir Immune Defic Syndr 2011; 56:356–64.
26. Bisson GP, Gross R, Bellamy S, et al. Pharmacy refill adherence compared with CD4 count changes for monitoring HIV-infected adults on antiretroviral therapy. PLoS Med 2008; 5:e109, Public Library of Science.
27. Polisset J, Ametonou F, Arrive E, Aho A, Perez F. Correlates of ad-herence to antiretroviral therapy in HIV-infected children in Lome, Togo, West Africa. AIDS Behav 2009; 13:23–32.
28. Fassinou P, Elenga N, Rouet F, et al. Highly active antiretroviral therapies among HIV-1-infected children in Abidjan, Cote d’Ivoire. AIDS 2004; 18:1905–13.
29. Bertagnolio S, Kelley K, Saadani Hassani A, Obeng-Aduasare Y, Jordan M. Surveillance of transmitted and acquired HIV drug resistance using WHO surveys in resource-limited settings [abstract 52]. In: Programs and abstracts of the 18th Conference on Retroviruses and Opportu-nistic Infections. Boston, MA: CROI, 2011.
30. Cheeseman SH, Havlir D, McLaughlin MM, et al. Phase I/II evaluation of nevirapine alone and in combination with zidovudine for infection with human immunodeficiency virus. J Acquir Immune Defic Syndr Hum Retrovirol 1995; 8:141–51.
31. Jack N, Ravasi G, Schrooten W. Implementing early-warning indicators of HIV drug resistance in the Caribbean. Clin Infect Dis 2012; 54(Suppl 4):S290–3.
32. Tuller DM, Bangsberg DR, Senkungu J, Ware NC, Emenyonu N, Weiser SD. Transportation costs impede sustained adherence and ac-cess to HAART in a clinic population in southwestern Uganda: a qualitative study. AIDS Behav 2010; 14:778–84.
33. Weiser S, Wolfe W, Bangsberg D, et al. Barriers to antiretroviral adherence for patients living with HIV infection and AIDS in Bot-swana. J Acquir Immune Defic Syndr 2003; 34:281–8.
34. Brigido LF, Rodrigues R, Casseb J, et al. Impact of adherence to anti-retroviral therapy in HIV-1-infected patients at a university public service in Brazil. AIDS Patient Care STDs 2001; 15:587–93.
35. Muko KN, Ngwa VC, Chigang LC, Ngwa IG, Meiburg A, Shu EN. Willingness to pay for treatment with highly active antiretroviral (HAART) drugs: a rural case study in Cameroon. SAHARA J 2004; 1:107–13.
36. Harvey KM, Carrington D, Duncan J, et al. Evaluation of adherence to highly active antiretroviral therapy in adults in Jamaica. West Indian Med J 2008; 57:293–7.
37. Crane JT, Kawuma A, Oyugi JH, et al. The price of adherence: quali-tative findings from HIVpositive individuals purchasing fixed-dose combination generic HIV antiretroviral therapy in Kampala, Uganda. AIDS Behav 2006; 10:437–42.
38. Chalker JC, Andualem T, Gitau LN, et al. Measuring adherence to antiretroviral treatment in resource-poor settings: the feasibility of collecting routine data for key indicators. BMC Health Serv Res 2010; 10:43.
39. Pearson CR, Micek M, Simoni JM, Matediana E, Martin DP, Gloyd S. Modified directly observed therapy to facilitate highly active antiretro-viral therapy adherence in Beira, Mozambique. Development and im-plementation. J Acquir Immune Defic Syndr 2006; 43(Suppl 1):S134–41. 40. Mills EJ, Nachega JB, Bangsberg DR, et al. Adherence to HAART: a systematic review of developed and developing nation patient-reported barriers and facilitators. PLoS Med 2006; 3:e438.
41. White YR, Pierre RB, Steel-Duncan J, et al. Adherence to antiretroviral drug therapy in children with HIV/AIDS in Jamaica. West Indian Med J 2008; 57:231–7.
42. Bussmann H, Wester CW, Thomas A, et al. Response to zidovudine/ didanosine-containing combination antiretroviral therapy among HIV-1 subtype C-infected adults in Botswana: two-year outcomes from a randomized clinical trial. Journal of Acquired Immune Deficiency Syndromes: JAIDS 2009; 51:37–46.
43. Lyagoba F, Dunn DT, Pillay D, et al. Evolution of drug resistance during 48 weeks of zidovudine/lamivudine/tenofovir in the absence of real-time viral load monitoring. Journal of Acquired Immune De-ficiency Syndromes: JAIDS 2010; 55:277–83.
44. Ndembi N, Goodall RL, Dunn DT, et al. Viral rebound and emergence of drug resistance in the absence of viral load testing: a randomized comparison between zidovudine-lamivudine plus Nevirapine and zi-dovudine-lamivudine plus Abacavir. J Infect Dis 2010; 201:106–13. 45. World Health Organization. Antiretroviral therapy of HIV infection in
infants and children: towards universal access: recommendations for a public health approach - 2010 revision. Available at:http://www.who. int/hiv/pub/paediatric/infants2010/en. Accessed 20 May 2011.
46. Ramadhani HO, Thielman NM, Landman KZ, et al. Predictors of in-complete adherence, virologic failure, and antiviral drug resistance among HIV-infected adults receiving antiretroviral therapy in Tanzania. Clin Infect Dis 2007; 45:1492–8.
47. Ma Y, Zhang F, Li H. Monitoring HIV drug resistance using early warning indicators in China: results from a pilot survey conducted in 2008. Clin Infect Dis 2012; 54(Suppl 4):S300–2.
48. Daoni E, Kitur U, Parunga A. Experience in piloting HIV drug re-sistance early warning indicators to improve the antiretroviral program in Papua New Guinea. Clin Infect Dis 2012; 54(Suppl 4):S303–5.