HAL Id: hal-00023312
https://hal-insu.archives-ouvertes.fr/hal-00023312
Submitted on 24 Apr 2006
HAL is a multi-disciplinary open access
archive for the deposit and dissemination of sci-entific research documents, whether they are pub-lished or not. The documents may come from teaching and research institutions in France or abroad, or from public or private research centers.
L’archive ouverte pluridisciplinaire HAL, est destinée au dépôt et à la diffusion de documents scientifiques de niveau recherche, publiés ou non, émanant des établissements d’enseignement et de recherche français ou étrangers, des laboratoires publics ou privés.
Chapitre 10 : Preliminary grouping of soils
Ary Bruand
To cite this version:
Ary Bruand. Chapitre 10 : Preliminary grouping of soils. Developments in Soil Science, Elsevier, pp.159-174, 2006. �hal-00023312�
2.9 Preliminary grouping of soils
1 2
Ary Bruand 3
Institut des Sciences de la Terre d'Orléans (ISTO) 4
UMR 6113 CNRS UO 5
Géosciences - Université d'Orléans BP 6759 6
45067 Orléans Cedex 2 - FRANCE 7
8 9 10 11
2.9.1. Origin of the variability and grouping strategy
12 13
Grouping soils appeared very early as a way to increase the reliability and applicability of 14
PTFs. Indeed, as noticed by Hodnett and Tomasella (2002), it might be never possible to 15
develop a very reliable “universal” PTF for all soils because the worldwide range of soil 16
properties is so great. Grouping emerged as a strategy to stratify the resulting variability, thus 17
enabling the development of closer PTFs between hydraulic properties and easily available 18
basic soil properties. 19
Most studies used an a priori grouping, without any analysis of the variability of hydraulic 20
properties prior grouping. Few works discussed the variability observed prior to grouping and 21
PTFs development. Williams et al. (1983) examined the variability of water retention curves 22
for 78 horizons from Australian soils and then developed eight groups of water retention curves 23
(Figure 1). They identified the soil characteristics that provided the grouping. In particular, they 24
showed that grade of structure and particle size distribution were the soil properties most 25
consistently associated with the groups of soil having similar water retention curves. On the 1
other hand, the size and shape of the peds had only weak association with the differences in the 2
water retention. Williams et al. (1983) developed PTFs separately for each of the groups. Data 3
of water retention for 1448 soils in the United States were analiyzed by Cosby et al. (1984) to 4
construct a grouping based on the soil hydraulic behavior analogous to the texture 5
classification. Cosby et al. (1984) also discussed the variability of water retention and showed 6
that, besides soil texture, the size and the shape of the structure accounted for the highest 7
percentage of variance. The moist consistency alone accounted for similar variance to structure 8
while the land use, the drainage class, the slope, and the root abundance accounted for very 9
little proportion of variance. The position in the soil profile (horizons A, B and C) accounted 10
for intermediate proportion of variance. Wösten et al. (1986) analyzed the variability of the 11
hydraulic properties according to soil functioning. They measured the water retention 12
properties, the saturated and the unsaturated hydraulic conductivity in 25 C horizons with sand 13
texture and 23 C horizons with a clay loam and silty clay loam texture, as distinguished in the 14
Dutch soil survey. Two groups of horizons were distinguished based on three functional 15
properties: (i) the travel time from soil surface to water table, (ii) the water table allowing a 16
defined upward-flux density, and (iii) the downward-flux density at a defined air content, they 17
found two groups of horizons. 18
The small number of studies examining the origin of the variability in hydraulic properties 19
and its consequences for PTF development can be easily explained. Water retention and 20
conductivity are closely related to the geometry of the pore network, the latter depending on the 21
nature and assemblage of the elementary soil particles. Based on that premise, most researchers 22
used preliminary grouping by particle-size distribution characteristics (texture as a global 23
expression of the particle size distribution, clay, silt and sand content) and then by structure 24
characteristics (structure type and grade, bulk density, consistency) without any discussion of 1
the pertinence of the criteria used. 2 3 2.9.2. Grouping criteria 4 5 2.9.2.1 Genetic grouping 6 7
Developing PTFs for soils in a climatic region is the grouping that is implicitly based on 8
genetic criteria. It can be considered at world scale. Thus, analyzing data of soils from West 9
Africa and Brazil, Gaiser et al. (2000) established PTFs for water retention at –33 and –1500 10
kPa of soils in semiarid tropical regions and showed the significance of clay mineralogy. 11
Tomasella and Hodnett (1998) studied the water retention of 613 soils from the Brazilian 12
Amazonia and developed PTFs that predict the Brooks and Corey parameters. The authors 13
suggested that these PTFs would be more adapted to soils under the tropics than most PTFs 14
already published and developed for soils from temperate regions. Using water retention data 15
from the IGBP-DIS database, Hodnett and Tomasella (2002) selected 771 horizons from 249 16
soil profiles in 22 countries under the tropics. They showed that averaged parameters of the van 17
Genuchten model (1980) were significantly different for most textural classes when compared 18
to those recorded for soils from the temperate regions. Hodnett and Tomasella (2002) used 19
these averaged values and multiple linear regression to establish class and continuous PTFs, 20
respectively. Their results imply that PTFs might be developed for other climatic regions. 21
The PTFs developed for soils in a country located within a single climatic region can be 22
considered as PTFs that are established for soils developed under similar climatic conditions 23
and showing pedological similarities. Several studies were carried out for particular groups of 24
soils within a single country. Thus, Pidgeon (1972) and Jamagne et al. (1977) developed PTFs 25
enabling prediction of water at field capacity and permanent wilting point for ferrallitic soils in 1
Uganda and Luvisols and Cambisols in France, respectively. On the other hand, Bruand (1990) 2
showed less variability of the water retention properties of French clayey soils when grouping 3
the soils by soil family, i.e. having the same pedogenetic origin and developed from a specific 4
parent material. 5
Van den Berg et al. (1997) reviewed literature on PTFs for Ferralsols and discussed the 6
necessity to have PTFs for soil groupings at world level. To exemplify such approach, they 7
investigated water retention at –10 kPa and –1500 kPa of Ferralsols and related soils from 8
South America, Africa and South East Asia, and developed PTFs using the multiple linear 9
regression. On the other hand, Tomasella and Hodnett (1997) showed that for Kunsat of
10
Brazilian soils the parameters of the generalized Kozeny-Carman equation and Brooks-Corey 11
equation derived in temperate soils could be applied to most soil studied. Tomasella and 12
Hodnett (1997) suggested the possibility of generalizing the hydraulic conductivity PTFs for a 13
greater variety of soils, and even across great soil groups. That appears to be less probable for 14
the water retention PTFs. Indeed, as indicated above, Hodnett and Tomasella (2002) showed 15
that averaging van Genuchten parameters across textural class led to significant differences 16
between tropical and temperate soils for most textures. They also showed that continuous PTFs 17
developed for tropical soils without any grouping performed better than class PTFs based on 18
soil types. Hodnett and Tomasella (2002) suggested that such difference in performance was 19
observed because the continuous PTFs took into account a minimum of six soil variables while 20
the soil type PTFs used only the averaged parameters for the van Genuchten model (1980). 21
22
2.9.2.2 Horizon-based grouping
23 24
Because elementary constituents and structure vary with depth, grouping by horizon type 1
has been used in several studies. Petersen et al. (1968) studied Pennsylvania soils and showed 2
that water contents retained at –33 kPa and –1500 kPa were generally the greatest in the A, less 3
in the B and the smallest in the C horizon. No significant difference between the water 4
retention of cultivated and uncultivated horizons was found. Differences in structure grade, 5
gleying and clay accumulation intensity also did not seem to case differences in water 6
retention. The authors concluded that their results were more reflection of coarse fragment 7
content than of the other horizon characteristics studied. Reeve et al. (1973) examined the 8
available water capacity of 158 horizons from soils of England and Wales grouped in 5 textural 9
classes. They observed a decrease in available water capacity in B and C horizons whereas in A 10
horizons the available water capacity tended to increase with bulk density, silty soils being an 11
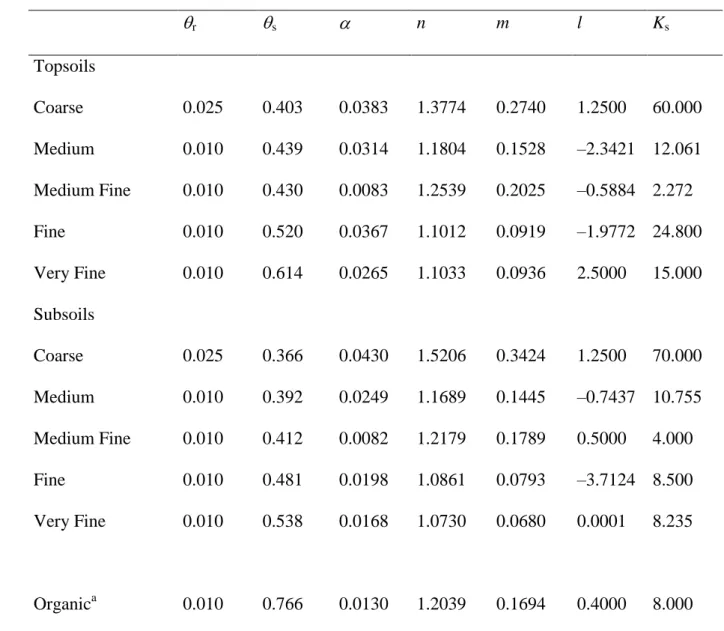
exception. Hall et al. (1977) grouped topsoils (A horizons) and subsoils (E, B and C horizons) 12
and developed PTFs for water retention at 5 values of pressure head for –5 h –1500 kPa. 13
These PTFs were regression equations with clay, silt, sand and organic carbon content, and 14
bulk density as input variables (Table 1). The regression intercept was greater in topsoils and 15
the regression coefficients for the clay and silt content were smaller as compared with subsoil. 16
Other coefficients did not demonstrate a systematic differences between the two groups. 17
Grouping by separating topsoils and subsoils was justified by Hall et al. (1977) by invoking 18
differences of structure that give different parameters in the regression equations. Working at 19
the scale of the 1:50,000 mapping unit, Wösten et al. (1995) measured hydraulic properties of 20
the soils classified as sandy, siliceous, mesic Typic Haplaquods. They grouped topsoils (A 21
horizons) and subsoils (B and C horizons) and developed PTFs for (h) and K(h). 22
Pachepsky et al. (1996) used data on the water contents at 8 pressure heads for 100 Aquic 23
Ustoll soil samples. They showed that grouping of data according to three horizon classes 24
(horizons A, B and C) increases the precision of water retention estimates. Using the 5521 25
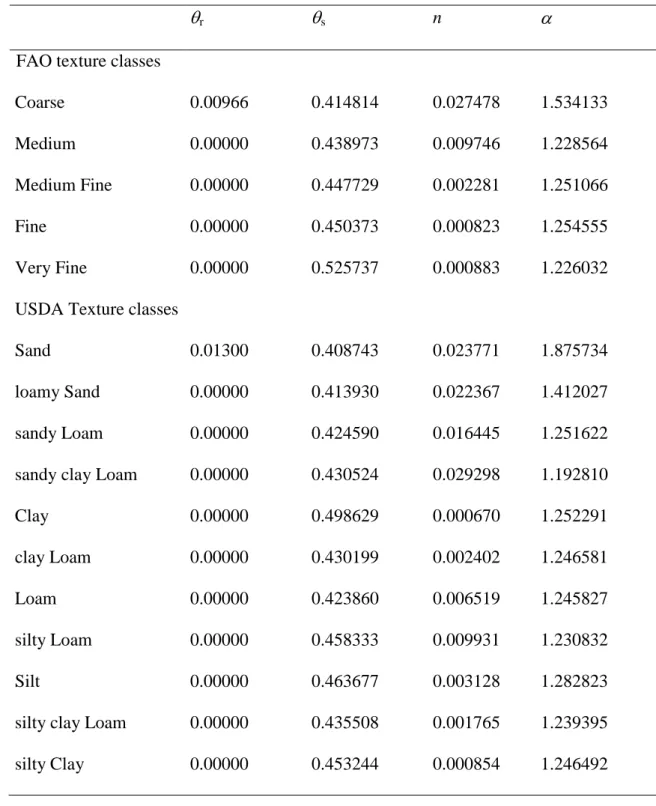
hydraulic properties from 1777 soils of the European database HYPRES 1
(http://www.macaulay.ac.uk/hypres/), Wösten et al. (1999) used separating topsoil from subsoil 2
as primary grouping. Then the groups were further subdivided by texture to develop PTFs for 3
the Mualem-vanGenuchten parameters (van Genuchten, 1980) of the (h) and K(h) 4
relationships (Table 2). The optimized Mualem-van Genuchten parameters were determined to 5
fit the geometric mean values of and K at 14 pressure heads within each of the 11 classes. No 6
distinction of horizon type and texture was made for organic soils that correspond to the Histic 7
layers as defined in the FAO guidelines (FAO, 1990). There was no difference of r between
8
topsoils and subsoils for any of the textural classes. Values of s were greater in topsoils, , n
9
and m were smaller in topsoils for the coarse texture and greater for the other textures as 10
compared with subsoils. Differences in values of l and Ksat, could not associated with the
11 horizon. 12 13 2.9.2.3 Texture grouping 14 15
Texture grouping is the most common grouping found in literature. The early PTFs were 16
developed by grouping soils by texture and enabled prediction of permeability (Diebold, 1954) 17
or available water capacity solely (Reeve et al., 1973). Jamagne et al. (1977) used 18
measurements of water retention for soils from Northern France and proposed values of 19
volumetric water content at field capacity and –1500 kPa for the 15 textural classes of the Soil 20
Survey of France. The study by Petersen et al (1968) on water retention at –33 kPa and –1500 21
kPa for Pennnsylvania soils is also among the earliest works where PTFs have been generated 22
for several pressure heads after grouping by texture. Hall et al. (1977) used topsoil and subsoil 23
as primary grouping criteria and then texture to develop PTFs that predict single value of the 24
volumetric water content at – 5 and –1500 kPa for the 10 textural classes of the Soil Survey of 25
England and Wales. Rawls et al. (1982) used data from 1 323 soils with about 5350 horizons, 1
from 32 states of USA, to develop PTFs for the water retention curve and the saturated 2
hydraulic conductivity (Ksat) after grouping soil samples according to the 11 USDA texture
3
classes. Those PTFs were the averaged values for the parameters of the Brooks and Corey 4
equation (1964) and Ks. Saxton et al. (1986) divided the texture triangle into grids of 10 % sand
5
and 10 % clay increments. They used the resulting 55 grid midpoints to generate PTFs that 6
corresponded to averaged water contents for 10 pressure heads from –10 to –15000 kPa for 44 7
of the 55 sections of the texture triangle. 8
Researchers also used grouping by broad textural classes to develop PTFs. Working on 9
Portuguese soils, Gonçalves et al. (1997) showed that grouping using the three main textural 10
classes of the FAO triangle significantly increased the prediction accuracy for the water 11
retention and unsaturated hydraulic conductivity. Williams et al. (1997)used the Gregson et al. 12
(1987) one-parameter function and proposed average p and q values for four texture groups. 13
They obtained estimates of the water retention that were better than those from the regression 14
models using texture and bulk density. Bruand et al. (2002 and 2003) developed class-PTFs for 15
the water retention properties of French soils after grouping by texture and proposed fitted 16
parameters for the van Genuchten model (1980) (Figure 9.2.2). Texture grouping was also used 17
smaller areas. Salchow et al. (1996) developed PTFs for water content at – 33 and – 1500 kPa 18
using 108 horizons of alluvial soils in southern Ohio. Horizons were first grouped in four 19
USDA textural classes. Then PTFs that enabled prediction of the field capacity, permanent 20
wilting point, available water capacity and Ks were developed using sand, silt, clay, organic
21
matter content and bulk density as predictor. 22
Databases of hydraulic properties that were developed with data from one or several 23
countries were used to group the soil using texture prior to PTFs development. Leij et al. 24
(1997) used 780 horizons of the International Unsaturated Soil Database (UNSODA) 25
(http://www.ussl.ars.usda.gov) (Leij et al., 1996 ; Nemes et al., 2001) and proposed average 1
parameters s, r , , n and Ks for the eleven classes of the USDA soil textural triangle. Those
2
authors also showed that uncertainty of errors in hydraulic properties was exacerbated because 3
data were collected, compiled and applied by different individuals. Large databases are 4
particularly well adapted to the application of grouping techniques prior to PTFs development, 5
but Leij et al. (1997) have pointed out the difficulty to gather a large number of consistently 6
measured hydraulic properties and to avoid large volume of incorrect data. Using the 5521 7
hydraulic properties from 1777 soils of the European database HYPRES 8
(http://www.macaulay.ac.uk/hypres/), Wösten et al. (1999) developed class PTFs for the 9
Mualem-van Genuchten parameters of the the (h) and K(h) relationships after grouping by 10
texture (Table 2.9.2) (see section Horizon-based grouping). The database of hydraulic 11
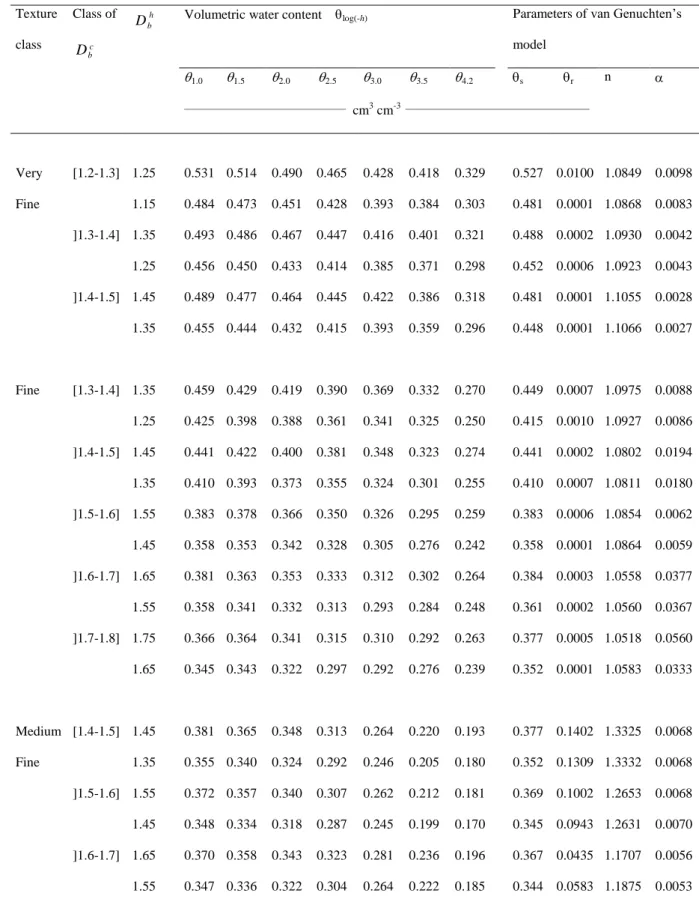
properties of Hungarian soils (HUNSODA) was used by Nemes (2002) to propose class PTFs 12
for the van Genuchten parameters of the the (h) relationship (Table 2.9.3). After preliminary 13
grouping by separating topsoils and subsoils, values of s, r , and n were proposed for the 5
14
textural classes of the FAO triangle and the 11 textural classes of the USDA triangle. 15
16
2.9.2.4 Grouping based on structure and bulk density
17 18
Williams et al. (1992) developed PTFs for the parameters of the Campbell (1974) water 19
retention model for a wide range of soils from Australia and United States,. They separated 20
massive and structured soils before grouping by texture. Danatalos et al. (1994) showed that 21
separating well structured horizons from structureless to weakly structured horizons on the 22
other led to close relationship between the clay content and the parameter of the Driessen and 23
Konijn equation (1992) for the water retention curve. Incorporating other soil properties in the 24
regression analyses produced only slightly greater R2-value. Lin et al. (1997) measured the in 25
situ steady-state infiltration for 96 horizons of Texas soils and showed that PTFs could be 1
developed incorporating morphological features. They did not group the horizons using these 2
morphological features but their results showed clearly that a quantification of morphological 3
features and their combination might result in promising grouping criteria. Lilly (2000) 4
developed PTFs for field-Ksat by grouping soils using soil structure. A total of 627 field-Ksat
5
measured for various soils of Scotland were distributed among 49 structure groups, each 6
corresponding to a unique combination of primary and secondary structures according to the 7
terminology and classes of the FAO Guidelines (FAO, 1990). The PTFs proposed by Lilly 8
(2000) are geometric means of Ksat, that vary from 0.06 to 1036.8 cm day-1, with quartile
9
ranges attached for each of the 49 classes of structure. 10
Bulk density was very early recognized as significant for water retention (Petersen et al., 11
1968) and hydraulic conductivity (Diebold, 1954). Considering the effect of bulk density of the 12
water retention of French soils, Bruand et al. (1996) developed PTFs for clayey soils (clay 13
content > 30 %) using bulk density as single predictor variable. The clod bulk density was 14
superior to the horizon bulk density because the latter included macropores that do not 15
intervene in water retention and vary in tilled topsoils with time and management (Bruand et 16
al., 2003). Thus, the clod bulk density was used as grouping criteria within every texture class 17
(Figure 9.2.3). This enabled to propose class PTFs using information about texture and 18
structure as grouping criteria. 19
McKenzie and Jacquier (1997) measured Ksat on 99 horizons from 36 soils in South-Eastern
20
Australia. They showed that grouping soils by visual estimation of the areal porosity using pore 21
charts enabled satisfactory prediction of Ksat . A more quantitative system of measurement
22
provided only slightly better predictions. They also showed that regression trees gave more 23
plausible predictive models than standard multiple regressions and suggested that it was 24
because regression trees provided a realistic portrayal of the non-additive and conditional 1
nature of the relationships between morphology and Ksat.
2 3
2.9.2.5 Parent Material grouping
4 5
Parent material was rarely used as grouping criteria. Jamagne et al. (1977) separated soils 6
developed in sedimentary clays from those developed in clays resulting from weathering within 7
the heavy clay class of the French texture triangle. Puckett et al. (1985) established PTFs for 8
Ultisols developed in unconsolidated sediments of the Lower Coastal Plain of Alabama in 9
which the clay fraction consisted mainly in vermiculite, kaolinite and gibbsite. The authors 10
suggested that these PTFs can be used for soils developed in this type of parent material with 11
similar mineralogical composition. Bastet (1999) grouped 597 soils from France by type of 12
parent material. Among parent materials, Bastet (1999) proposed PTFs for soils developed in 13
recent quaternary alluviums, old quaternary alluviums, marly limestones, marls, aeolian loams, 14
sandstones, clays resulting from decarbonatation, molasses and detritical sediments. 15
16
2.9.2.6 Consecutive grouping
17 18
As already mentioned above, numerous studies used combined grouping. Most used 19
preliminary grouping by horizon type and then by texture or by texture and then by bulk 20
density. 21
Thus, Williams et al. (1983) examined the relative importance of texture, structure, organic 22
matter and clay mineralogy to group the water retention curves over a pressure head range –4 23
to –1507 kPa for an extensive group of Australian soils. They studied 78 horizons from 17 24
profiles representing 12 Australian Great Soil Groups as defined in Prebble (1970). Structure 25
development and texture had the greatest importance to group the water retention curves in 8 26
groups. For each group, Williams et al. (1983) developed PTFs that are parameters of a power 1
law relationship between h and . Rawls et al. (1997) accumulated and analyzed the US 2
national database of about 1000 data sets on Ks values. Results of grouping these data by 3
texture and then into two porosities classes are shown in Figure 2.9.4. 4
Wösten et al. (1999) separated topsoils and subsoils and then proposed class PTFs for the 5
parameters of the Mualem-van Genuchten model for the five texture classes of the FAO 6
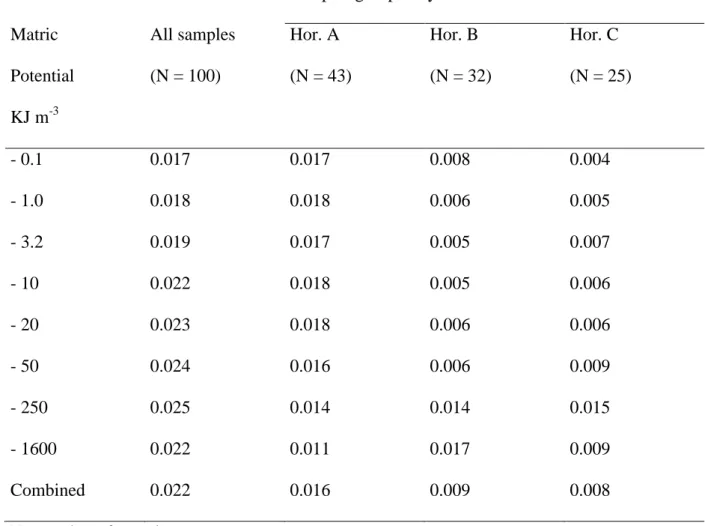
triangle. Bruand et al. (2002) studied water retention of French soils and developed class PTFs 7
by grouping soils by texture (8 classes based on the 13 classes of the French triangle) and then 8
by bulk density within every texture class. Values of at seven pressure heads and 9
van Genuchten fitted parameters were proposed (Table 2.9.4). Using a similar approach, 10
Bruand et al. (2003) developed class PTFs using preliminary grouping by texture according to 11
five classes of the FAO triangle. 12
13
2.9.3. Grouping decreases the number of predictors
14 15
Grouping leads to less variability within each resulting group of soils and, as a 16
consequence, results in PTFs using a smaller number of soils characteristics as predictors. 17
Danalatos et al. (1994) showed that their PTFs developed for representative Greek soils with 6 18
soil characteristics could be simplified into PTFs with clay content as single predictor if the 19
applicability of the PTFs was restricted to group of soils with similar mineralogy. Bruand 20
(1990) determined the water retention at h = –33 and –1500 kPa of 40 French clayey B 21
horizons. Among the latter, 18 horizons originated from various contrasting soil families, 13 22
were Bt horizons from one soil family and 9 were Bw horizons from another soil family.
23
Bruand (1990) showed that, for horizons originating from contrasting soil families, accurate 24
PTFs were developed with the reciprocal of bulk density as single predictor because it enabled 25
to take both clay content and clay fabric into account. For horizons originating from a single 1
soil family, accurate PTFs were established with either the reciprocal of the bulk density or the 2
clay content as single predictor because of the close relationship between the bulk density and 3
the clay content in the absence of clay fabric variation. The applicability of those PTFs was 4
shown by Bruand et al. (1994) for another group of Bt horizons originating from a single soil 5
family with clay content and bulk density ranging from 50 to 73 % and from 1.30 to 1.47, 6
respectively. Arrouays and Jamagne (1993) also showed that at –1500 kPa could be 7
accurately estimated using the clay content as single predictor for soils from the South-West of 8
France. 9
10
2.9.4 Comparison of groupings and improvement of prediction after grouping
11 12
King and Franzmeier (1981) determined Ksat in situ with the piezometer method for 25 soil
13
series in Indiana. Grouping using both texture and soil structure was compared to grouping 14
using texture, origin of the parent material and type of genetic horizon. The second grouping 15
resulted in more homogeneous classes. Salchow et al. (1996) improved the closeness of PTFs 16
after grouping into four textural classes (silty clay loam, silt loam, loam and sandy loam). 17
Pachepsky et al. (1996) showed for Aquic Ustoll that grouping by horizon type (A, B and C 18
horizon) increase the precision of water retention estimates when compared to absence of 19
grouping (Table 5). They suggested that improvement was related to differences in organic 20
matter content among horizons that are known to affect soil water retention. Pachepsky and 21
Rawls (1999) studied water retention at –33 kPa and –1500 kPa and compared four criteria to 22
group 447 soils from the Oklahoma National Resource Service Database: (i) soil great group, 23
(ii) soil moisture regime, soil temperature regime, and (iv) soil textural class. Results showed 24
that grouping improved the accuracy of PTFs in most cases but none of the grouping criteria 25
could be considered to be the best. However, there was no improvement of reliability for PTFs 1
developed in groups when compared to PTFs developed from the whole database. Bruand et al. 2
(2003) established PTFs after grouping by texture and after grouping by both texture and bulk 3
density. They showed smaller mean error of prediction and standard deviation of prediction 4
with the PTFs developed after grouping by both texture and bulk density. 5
6
2.9.5 Conclusion
7 8
Grouping enables a decrease in the variability of soil characteristics such as mineralogy, 9
organic matter composition and type and development of structure, and thus leads to closer 10
relationship between the hydraulic properties and the remaining variability of soil 11
characteristics. Among soil characteristics used as grouping criteria, texture and bulk density 12
appear to be the most efficient criteria to improve accuracy of PTFs; texture provides 13
information on the size and reactivity of the elementary particles, and bulk density on the 14
arrangement of the elementary particles. Thus, preliminary grouping by texture, even by using 15
a limited number of texture classes, and then by bulk density can be recommended. Finally, 16
several studies also show that parent material could be also used as grouping criteria in order to 17
improve PTFs accuracy and reliability. 18
19
REFERENCES 20
21
Arrouays, D. and Jamagne, M., 1993. Sur la possibilité d’estimer les propriétés de retention en 22
eau de sols limoneux lessivés hydromorphes du Sud-Ouest de la France à partir de leurs 23
caractéristiques de constitution. Compte Rendu de l’Académie d’Agriculture de France, 24
79:111-121. 25
Bastet, G., 1999. Estimation des propriétés de rétention en eau des sols à l’aide de fonctions de 1
pédotransfert: développement de nouvelles approches. Thèse de Doctorat de l’Université 2
d’Orléans. Orléans. France. 3
Brooks, R.H. and Corey, A.T., 1964. Hydraulic properties of porous media. Colorado State 4
University Hydrology, Paper No. 3, 27 pp. 5
Bruand, A., 1990. Improved prediction of water-retention properties of clayey soils by 6
pedological stratification. J. Soil Sci., 41: 491-497. 7
Bruand, A., Baize, D. and Hardy, M., 1994. Predicting of water retention properties of clayey 8
soil using a single soil characteristic. Soil Use Manag., 10: 99-103. 9
Bruand, A., Duval, O., Gaillard, H., Darthout, R. and Jamagne, M., 1996. Variabilité des 10
propriétés de retention en eau des sols: importance de la densité apparente. Etude et Gestion 11
des Sols, 3:27-40. 12
Bruand, A., Pérez Fernàndez, P. and Duval, O., 2003. Use of class pedotransfer functions based 13
on texture and bulk density of clods to generate water retention curves. Soil Use Manag., 14
19: 232-242. 15
Bruand, A., Pérez Fernàndez, P., Duval, O., Quétin, P., Nicoullaud, B., Gaillard, H., Raison, L., 16
Pessaud, J.F. and Prud’Homme, L., 2002. Estimation des propriétés de rétention en eau des 17
sols : Utilisation de classes de pédotransfert après stratification texturale et texturo-18
structurale. Etude et Gestion des Sols, 9:105-125. 19
Campbell, G.S., 1974. A simple model for determining unsaturated conductivity from moisture 20
retention data. Soil Sci., 117:311-314. 21
Cosby, B. J., Hornberger, G.M., Clapp, R.B. and Ginn, T.R., 1984. A statistical exploration of 22
the relationships of soil moisture characteristics to the physical properties of soils. Water 23
Resour Res., 20:682-690. 24
Danalatos, N.G., Kosmas, C.S., Driessen, P.M. and Yassoglou, N., 1994. Estimation of the 25
draining soil moisture characteristics from standard data as recorded in soil surveys. 1
Geoderma, 64: 155-165. 2
Diebold, C.H., 1954. Permeability and intake rates of medium textures soils in relation to silt 3
content and degree of compaction. Soil Sci. Soc. Am. Proc., 18: 339-343. 4
Driesen, P.M. and Loebel, K., 1992. Land-Use Systems Analysis. INRES, Agric. Univ. of 5
Wageningen, 230 pp. 6
Food and Agriculture Organisation (FAO). 1990. (3rd Ed.) Guidelines for soil description. 7
FAO/ISRIC, Rome. 8
Gaiser, Th., Graef, F., Carvalho Cordiero, J., 2000. Water retention characteristics of soils with 9
contrasting clay mineral composition in semiarid tropical regions. Aust. J. Soil Res., 38: 10
523-536. 11
Gonçalves, M.C., Pereira, L.S. and Leij, F.J., 1997. Pedo-transfer for estimating unsaturated 12
hydraulic properties of Portuguese soils. Eur. J. Soil Sci., 48: 387-400. 13
Gregson, K., Hector, D.J. and McGowan, M., 1987. A one-parameter model for the soil water 14
characteristic. J. Soil Sci., 38:483-486. 15
Hall, D.G.M., Reeve, M.J., Thomasson, A.J. and Wright, V.F., 1977. Water retention, porosity 16
and density of field soils. Technical Monograph. N°9. Soil Survey of England & Wales, 17
Harpenden, 75 pp. 18
Hodnett, M.G. and Tomasella, J., 2002. Marked differences between van Genuchten soil water-19
retention parameters for temperate and tropical soils: a new water retention pedo-transfer 20
functions developed for tropical soils. Geoderma, 108: 155-180. 21
Jamagne, M., Bétrémieux, R., Bégon, J.C. and Mori, A., 1977. Quelques données sur la 22
variabilité dans le milieu naturel de la réserve en eau des sols. Bulletin d’Information 23
Technique, 324-325: 627-641. 24
King, J. J. and Franzmeier, D.P., 1981. Estimation of saturated hydraulic conductivity from soil 25
morphological and genetic information. Soil Sci. Soc. Am. J., 45:1153-1156. 1
Lin, H.S., McInnes, K.J., Wilding, L.P. and Hallmark, C.T., 1997. Low tension water flow in 2
structured soils. Can. J. Soil Sci., 77:649-654. 3
Lilly, A., 2000. The relationship between field-saturated hydraulic conductivity and soil 4
structure : development of class pedotransfer functions. Soil Use Manag., 16: 56-60. 5
Leij, F., Alves, W.J., van Genuchten, M.Th. and Williams, J.R., 1996. The UNSODA 6
unsaturated soil hydraulic database. User's manual version 1.0. EPA/600/R-96/095. 7
National Risk Management Laboratory, Office of Research and Development, Cincinnati, 8
OH. 9
Leij, F., Alves, W.J., van Genuchten, M.Th. and Williams, J.R., 1996. The UNSODA 10
unsaturated soil hydraulic database. In: M. Th. Van Genuchten, F.J. Leij and L. Wu 11
(Editors), Proceedings of the International Workshop on Characterization and Measurement 12
of the Hydraulic Properties of Unsaturated Porous Media, Riverside, California, October 13
22-24, 1997, pp. 1269-1281. 14
McKenzie, N. and Jacquier, D., 1997. Improving the field estimation of saturated hydraulic 15
conductivity. Aust. J. Soil Res., 35:803-825. 16
Nemes, A., 2002. Unsaturated soil hydraulic database of Hungary: HUNSODA. Agrokémia és 17
Talajtan. 51:17-26. 18
Nemes, A., Schaap, M.G., Leij, F.J. and Wösten, J.H.M., 2001. Description of the unsaturated 19
soil hydraulic database UNSODA Version 2.0. J. Hydr., 251: 151-162. 20
Pachepsky, Y.A. and Rawls, W.J., 1999. Acuracy and reliability of pedotransfer function as 21
affected by grouping soils. Soil Sci. Soc. Am. J., 63: 1748-1759. 22
Pachepsky, Y.A. and Rawls, W.J., 2003. Soil structure and pedotransfer functions. Eur. J. Soil 23
Sci., 54 : 443-452. 24
Pachepsky, Y.A., Timlin, D. and Varallyay, G., 1996. Artificial neural networks to estimate 25
soil water retention from easily measurable data. Soil Sci. Soc. Am. J., 60: 727-733. 1
Petersen, G. W., Cunningham, R.L. and Matelski, R.P., 1968. Moisture characteristics of 2
Pennsylvania soils. II. Soil factors affecting moisture retention within a textural class-silt 3
loam. Soil Sci. Soc. Am. Proc., 32:866-870. 4
Pidgeon, J.D., 1972. The measurement and prediction of available water capacity of Ferralitic 5
soils in Uganda. J. Soil Sci., 23: 431- 441. 6
Prebble, R.E., 1970. Physical properties from 17 soil groups in Queensland. CSIRO Australian 7
Division of Soils, technical Memorandum 10/70. 8
Puckett, W.E., Dane, J.H. and Hajek, B.F., 1985. Physical and mineralogical data to determine 9
soil hydraulic properties. Soil Sci. Soc. Am. J., 49: 831-836. 10
Rawls, W.J., Brakensiek, D.L. and Saxton, K.E., 1982. Estimation of soil water properties. 11
Trans. Amer. Soc. of Agric. Eng., 25: 1316-1328. 12
Rawls, W.J., Giménez, D. and Grossman, R., 1998. Use of soil texture, bulk density and slope 13
of the water retention curve to predict saturated hydraulic conductivity. Trans. ASAE 41: 14
983-988. 15
Rawls, W.J., Pachepsky, Y.A., Gimenez, D. and Elliott, R., 1997. Development of STATGO 16
Pedotransfer functions using a group method data. In: M.Th. Van Genuchten, F.J. Leij and 17
L. Wu (Editors), Proceedings of the International Workshop on Characterization and 18
Measurement of the Hydraulic Properties of Unsaturated Porous Media, Riverside, 19
California, October 22-24, 1997, pp. 1333-1342. 20
Reeve, M.J., Smith, P.D and Thomasson, A.J., 1973. The effect of density on water retention 21
properties of field soils. J. Soil Sci., 24:355-367. 22
Salchow, E., Lal, R., Fausey, N.R. and Ward A., 1996. Pedotransfer functions for variable 23
alluvial soils in southern Ohio. Geoderma, 73:165-181. 24
Tomasella, J. and Hodnett, M.G., 1997. Estimating unsaturated hydraulic conductivity of 25
Brazilian soils using soil-water retention data. Soil Sci., 162: 703- 712. 1
Tomasella, J., Hodnett, M.G., 1998. Estimating soil water retention characteristics from limited 2
data in Brazilian Amazonia. Soil Sci., 163:190-202. 3
Van den Berg, M., Klant, E., van Reeuwijk, L.P. and Sombroek, G., 1997. Pedotransfer 4
functions for the estimation of moisture retention characteristics of Ferralsols and related 5
soils. Geoderma, 78: 161-180. 6
Van Genuchten, M. Th., 1980. A closed-form equation for predicting the hydraulic 7
conductivity of unsaturated soils. Soil Sci. Soc. Am. J., 44: 892-898. 8
Williams, R.D., Ahuja, L.R. and Rawls, W.J., 1997. Estimating soil water retention using the 9
Gregson One-parameter function. In: M.Th. Van Genuchten, F.J. Leij and L. Wu (Editors), 10
Proceedings of the International Workshop on Characterization and Measurement of the 11
Hydraulic Properties of Unsaturated Porous Media, Riverside, California, October 22-24, 12
1997, pp. 1011-1018. 13
Williams, J. R., Prebble, E., Williams, W.T. and Hignett, C.T., 1983. The influence of texture, 14
structure and clay mineralogy on the soil moisture characteristic. Aust. J. Soil Res., 21:15-15
31. 16
Wösten J.H.M., M.H. Bannink, J.J. De Gruijter, and J. Bouma. 1986. A procedure to identify 17
different groups of hydraulic-conductivity and moisture-retention curves for soil horizons. 18
J. Hydr., 86: 133-145. 19
Wösten, J.H.M., Finke, P.A. and Jansen, M.J.W., 1995. Comparison of class and continous 20
pedotransfer functions to generate soil hydraulic characteristics. Geoderma, 66: 227-237. 21
Wösten, J.H.M., Lilly, A., Nemes, A. and Le Bas, C., 1999. Development and use of a database 22
of hydraulic properties of European soils. Geoderma, 90: 169-185. 23
24 25
1
Table 1: Regression equations developed for topsoils and subsoils, and corresponding to PTFs 2
for the water content at –50 hPa (50), –100 hPa (100),, –400 hPa(400),, –2000 hPa (2000), and
3
–15000 hPa (15000) (modified after Hall et al., 1977).
4 Regression equations Topsoils 50 = 47.00 + 0.25 (%cl) + 0.10 (%si) + 1.12 (OC) – 16.52 Db 100 = 37.47 + 0.32 (%cl) + 0.12 (%si) + 1.15 (OC) – 1.25 Db 400 = 26.66 + 0.36 (%cl) + 0.12 (%si) + 1.00 (OC) – 7.64 Db 2000 = 8.70 + 0.45 (%cl) + 0.11 (%si) + 1.03 (OC) 15000 = 2.94 + 0.83 (%cl) – 0.0054 (%cl)2 Subsoils 50 = 37.20 + 0.35 (%cl) + 0.12 (%si) – 11.73 Db 100 = 27.87 + 0.41 (%cl) + 0.15 (%si) – 8.32 Db 400 = 20.81 + 0.45 (%cl) + 0.13 (%si) – 5.96 Db 2000 = 7.57 + 0.48 (%cl) + 0.11 (%si) 15000 = 1.48 + 0.84 (%cl) – 0.0054 (%cl)2
%cl: clay content as percentage, %si: silt content as percentage, OC: organic carbon content as 5
percentage, Db: bulk density
6 7 8 9
Table 2. Class PTFs developed for topsoils and subsoils according to the texture classes of the 1
FAO guidelines (FAO, 1990) using the European database HYPRES (Mualem-van Genuchten 2
parameters for the fits on the geometric mean values of and K at 14 pressure heads, after 3 Wösten et al., 1999). 4 r s n m l Ks Topsoils Coarse 0.025 0.403 0.0383 1.3774 0.2740 1.2500 60.000 Medium 0.010 0.439 0.0314 1.1804 0.1528 –2.3421 12.061 Medium Fine 0.010 0.430 0.0083 1.2539 0.2025 –0.5884 2.272 Fine 0.010 0.520 0.0367 1.1012 0.0919 –1.9772 24.800 Very Fine 0.010 0.614 0.0265 1.1033 0.0936 2.5000 15.000 Subsoils Coarse 0.025 0.366 0.0430 1.5206 0.3424 1.2500 70.000 Medium 0.010 0.392 0.0249 1.1689 0.1445 –0.7437 10.755 Medium Fine 0.010 0.412 0.0082 1.2179 0.1789 0.5000 4.000 Fine 0.010 0.481 0.0198 1.0861 0.0793 –3.7124 8.500 Very Fine 0.010 0.538 0.0168 1.0730 0.0680 0.0001 8.235 Organica 0.010 0.766 0.0130 1.2039 0.1694 0.4000 8.000 a
No distinction is made between topsoils and subsoils for organic soils (Histic layers, FAO, 5
1990). 6
7 8
1
Table 3. Van Genuchten parameters for Hungarian soils after grouping according to the FAO 2
and the USDA texture classes (after Nemes et al., 2002). 3
r s n
FAO texture classes
Coarse 0.00966 0.414814 0.027478 1.534133
Medium 0.00000 0.438973 0.009746 1.228564
Medium Fine 0.00000 0.447729 0.002281 1.251066
Fine 0.00000 0.450373 0.000823 1.254555
Very Fine 0.00000 0.525737 0.000883 1.226032
USDA Texture classes
Sand 0.01300 0.408743 0.023771 1.875734
loamy Sand 0.00000 0.413930 0.022367 1.412027
sandy Loam 0.00000 0.424590 0.016445 1.251622
sandy clay Loam 0.00000 0.430524 0.029298 1.192810
Clay 0.00000 0.498629 0.000670 1.252291
clay Loam 0.00000 0.430199 0.002402 1.246581
Loam 0.00000 0.423860 0.006519 1.245827
silty Loam 0.00000 0.458333 0.009931 1.230832
Silt 0.00000 0.463677 0.003128 1.282823
silty clay Loam 0.00000 0.435508 0.001765 1.239395
silty Clay 0.00000 0.453244 0.000854 1.246492
4 5
6
1
Table 4. Class PTFs based on combined grouping using the texture according to the FAO 2
texture triangle and the clod bulk density (modified after Bruand et al., 2003). 3 Texture class Class of c b D h b
D Volumetric water content log(-h) Parameters of van Genuchten’s
model 1.0 1.5 2.0 2.5 3.0 3.5 4.2 s r n ____________________________________ cm3 cm-3 _________________________________________ Very [1.2-1.3] 1.25 0.531 0.514 0.490 0.465 0.428 0.418 0.329 0.527 0.0100 1.0849 0.0098 Fine 1.15 0.484 0.473 0.451 0.428 0.393 0.384 0.303 0.481 0.0001 1.0868 0.0083 ]1.3-1.4] 1.35 0.493 0.486 0.467 0.447 0.416 0.401 0.321 0.488 0.0002 1.0930 0.0042 1.25 0.456 0.450 0.433 0.414 0.385 0.371 0.298 0.452 0.0006 1.0923 0.0043 ]1.4-1.5] 1.45 0.489 0.477 0.464 0.445 0.422 0.386 0.318 0.481 0.0001 1.1055 0.0028 1.35 0.455 0.444 0.432 0.415 0.393 0.359 0.296 0.448 0.0001 1.1066 0.0027 Fine [1.3-1.4] 1.35 0.459 0.429 0.419 0.390 0.369 0.332 0.270 0.449 0.0007 1.0975 0.0088 1.25 0.425 0.398 0.388 0.361 0.341 0.325 0.250 0.415 0.0010 1.0927 0.0086 ]1.4-1.5] 1.45 0.441 0.422 0.400 0.381 0.348 0.323 0.274 0.441 0.0002 1.0802 0.0194 1.35 0.410 0.393 0.373 0.355 0.324 0.301 0.255 0.410 0.0007 1.0811 0.0180 ]1.5-1.6] 1.55 0.383 0.378 0.366 0.350 0.326 0.295 0.259 0.383 0.0006 1.0854 0.0062 1.45 0.358 0.353 0.342 0.328 0.305 0.276 0.242 0.358 0.0001 1.0864 0.0059 ]1.6-1.7] 1.65 0.381 0.363 0.353 0.333 0.312 0.302 0.264 0.384 0.0003 1.0558 0.0377 1.55 0.358 0.341 0.332 0.313 0.293 0.284 0.248 0.361 0.0002 1.0560 0.0367 ]1.7-1.8] 1.75 0.366 0.364 0.341 0.315 0.310 0.292 0.263 0.377 0.0005 1.0518 0.0560 1.65 0.345 0.343 0.322 0.297 0.292 0.276 0.239 0.352 0.0001 1.0583 0.0333 Medium [1.4-1.5] 1.45 0.381 0.365 0.348 0.313 0.264 0.220 0.193 0.377 0.1402 1.3325 0.0068 Fine 1.35 0.355 0.340 0.324 0.292 0.246 0.205 0.180 0.352 0.1309 1.3332 0.0068 ]1.5-1.6] 1.55 0.372 0.357 0.340 0.307 0.262 0.212 0.181 0.369 0.1002 1.2653 0.0068 1.45 0.348 0.334 0.318 0.287 0.245 0.199 0.170 0.345 0.0943 1.2631 0.0070 ]1.6-1.7] 1.65 0.370 0.358 0.343 0.323 0.281 0.236 0.196 0.367 0.0435 1.1707 0.0056 1.55 0.347 0.336 0.322 0.304 0.264 0.222 0.185 0.344 0.0583 1.1875 0.0053
Medium [1.5-1.6] 1.55 0.356 0.340 0.312 0.274 0.231 0.206 0.175 0.360 0.1125 1.2472 0.0170 1.45 0.334 0.318 0.292 0.257 0.216 0.193 0.164 0.338 0.1036 1.2423 0.0176 ]1.6-1.7] 1.65 0.350 0.338 0.319 0.286 0.241 0.193 0.152 0.350 0.0120 1.1862 0.0078 1.55 0.329 0.318 0.299 0.268 0.226 0.181 0.143 0.329 0.0088 1.1820 0.0082 ]1.7-1.8] 1.75 0.322 0.310 0.299 0.282 0.261 0.226 0.184 0.317 0.0002 1.1231 0.0049 1.65 0.304 0.292 0.282 0.266 0.246 0.212 0.173 0.299 0.0005 1.1245 0.0048 [1.8-1.9] 1.85 0.311 0.300 0.287 0.272 0.265 0.239 0.181 0.302 0.0003 1.1276 0.0026 1.75 0.294 0.284 0.271 0.257 0.250 0.226 0.172 0.286 0.0009 1.1240 0.0028 Coarse ]1.6-1.7] 1.65 0.315 0.277 0.210 0.182 0.142 0.114 0.089 0.352 0.0334 1.2429 0.0843 1.55 0.296 0.260 0.197 0.171 0.133 0.121 0.084 0.339 0.0328 1.2286 0.1123 ]1.7-1.8] 1.75 0.280 0.252 0.193 0.154 0.121 0.100 0.086 0.294 0.0695 1.4180 0.0339 1.65 0.264 0.238 0.193 0.154 0.100 0.094 0.081 0.272 0.0711 1.5179 0.0257 [1.8-1.9] 1.85 0.303 0.281 0.257 0.226 0.183 0.165 0.128 0.310 0.0008 1.1434 0.0304 1.75 0.287 0.266 0.243 0.214 0.173 0.156 0.121 0.294 0.0008 1.1435 0.0307 c b
D : bulk density of centimetric sized clods; Dbh: bulk density of the horizon.
1 2 3
1
Table 5. Mean root square errors of the water content (m3 m-3) estimates before and after 2
grouping samples by horizon for Aquic Ustoll soils. Artificial neural networks with seven 3
hidden units were used in all estimations (after Pachepsky et al., 1996). 4
Samples grouped by horizons Matric Potential KJ m-3 All samples (N = 100) Hor. A (N = 43) Hor. B (N = 32) Hor. C (N = 25) - 0.1 0.017 0.017 0.008 0.004 - 1.0 0.018 0.018 0.006 0.005 - 3.2 0.019 0.017 0.005 0.007 - 10 0.022 0.018 0.005 0.006 - 20 0.023 0.018 0.006 0.006 - 50 0.024 0.016 0.006 0.009 - 250 0.025 0.014 0.014 0.015 - 1600 0.022 0.011 0.017 0.009 Combined 0.022 0.016 0.009 0.008 N =number of samples. 5 6 7
1
CAPTIONS 2
3
Figure 1. Dendrograms showing the relationship between the eight groups of water retention 4
curves using the incremental sum of squares. Sets A and B are groups of soils that differed in 5
their pedality and secondarily in their texture (after Williams et al., 1983). 6
7
Figure 2. Water retention curves obtained with class PTFs developed for French soils after 8
grouping by texture; ALO - heavy clay; A, AL - clay to loamy-clay; AS - sandy clay; LA, L - 9
clayey loam to loam; LM, LAS - sandy clay loam; LS, LSA - sandy loam to clay sand loam; 10
SA, SL - clayey sand to loamy sand; S: sand; Modified after Bruand et al., 2002. 11
12
Figure 3. Water retention curves computed for the texture Medium (FAO triangle) using the 13
horizon bulk density ( h b
D ) and class PTFs that enable prediction of the gravimetric water 14
content at seven pressure heads after preliminary grouping by texture and then by clod bulk 15
density ( c b
D ) (Modified after Bruand et al., 2003). 16
17
Figure 4. Saturated hydraulic conductivity Ksat in the national Ksat database as grouped by
18
texture and porosity; a - median values, b - the difference between 75% and 25 % quartiles. 19
Textural classes: S - sand, FS - fine sand, LS - loamy sand, LFS - loamy fine sand, SL - sandi 20
loam, FSL - fine sandy loam, L - loam, SiL- silty loam, SCL - sandy clay loam, CL - clay loam, 21
SiCL - silty clay loam, SC - sandy clay, SiC - silty clay, C - clay; the high porosity data are 22
shown using a larger font (after Pachepsky and Rawls, 2003). 23
1 2
3
Figure 1 4
Figure 2 1 -1 -1 0 -1 04 -1 05 0 .0 0 .1 0 .2 0 .3 0 .4 0 .5 V o lu m e tric w a te r c o n te n t (cm3 cm-3) P re s s u re h e a d h (h P a ) A L O A , A L A S L A , L L M , L A S L S , L S A S A , S L S -1 02 -1 03 -1 -1 0 -1 04 -1 05 0 .0 0 .1 0 .2 0 .3 0 .4 0 .5 V o lu m e tric w a te r c o n te n t (cm3 cm-3) P re s s u re h e a d h (h P a ) A L O A , A L A S L A , L L M , L A S L S , L S A S A , S L S A L O A , A L A S L A , L L M , L A S L S , L S A S A , S L S -1 02 -1 03
1 Figure 3 2 3 -1 -1 0 -1 02 -1 03 -1 04 -1 05 P re s s u re h e a d h (h P a ) 0 .1 0 0 .1 5 0 .2 0 0 .2 5 0 .3 0 0 .3 5 0 .4 0 W ate r c o n te n t (c m3c m )-3 Texture M edium 6 . 1 5 . 1 c b D 45 . 1 h b D 7 . 1 6 . 1 c b D 55 . 1 h b D 8 . 1 7 . 1 c b D 65 . 1 h b D 9 . 1 8 . 1 c b D 75 . 1 h b D -1 -1 0 -1 02 -1 03 -1 04 -1 05 P re s s u re h e a d h (h P a ) -1 -1 0 -1 02 -1 03 -1 04 -1 05 P re s s u re h e a d h (h P a ) 0 .1 0 0 .1 5 0 .2 0 0 .2 5 0 .3 0 0 .3 5 0 .4 0 W ate r c o n te n t (c m3c m )-3 0 .1 0 0 .1 5 0 .2 0 0 .2 5 0 .3 0 0 .3 5 0 .4 0 W ate r c o n te n t (c m3c m )-3 Texture M edium 6 . 1 5 . 1 c b D 45 . 1 h b D 7 . 1 6 . 1 c b D 55 . 1 h b D 8 . 1 7 . 1 c b D 65 . 1 h b D 9 . 1 8 . 1 c b D 75 . 1 h b D
1 Figure 4 2 3 4 5 6 C la y c o n te n t (% ) 1 1 0 1 0 0 K s a t( 5 0 % ) ( c m d -1 ) 1 1 0 1 0 0 1 0 0 0 S F S L S L F S S L F S L L S iL S C L C L S iC L S C S iCC S F S L S L F SS L F S L L S iL S C L C L S iC L C 1 1 0 1 0 0 Ks a t( 7 5 % )-K s a t( 2 5 % ) (c m d -1 ) 1 1 0 1 0 0 1 0 0 0 S F S L S L F S S L F S LS iLL S C L C L S iC L S C S iC C S F S L S L F S S L F S L L S iLS C L C L S iC L C F ig . 1