HAL Id: insu-01742681
https://hal-insu.archives-ouvertes.fr/insu-01742681
Submitted on 25 Mar 2018HAL is a multi-disciplinary open access archive for the deposit and dissemination of sci-entific research documents, whether they are pub-lished or not. The documents may come from teaching and research institutions in France or abroad, or from public or private research centers.
L’archive ouverte pluridisciplinaire HAL, est destinée au dépôt et à la diffusion de documents scientifiques de niveau recherche, publiés ou non, émanant des établissements d’enseignement et de recherche français ou étrangers, des laboratoires publics ou privés.
TESTING THE USE OF LOCAL SLOPE AS A
PROXY OF GMPE’S SITE CONDITIONS
Boumédiène Derras, Pierre-Yves Bard, Fabrice Cotton, Anne Lemoine
To cite this version:
Boumédiène Derras, Pierre-Yves Bard, Fabrice Cotton, Anne Lemoine. TESTING THE USE OF LOCAL SLOPE AS A PROXY OF GMPE’S SITE CONDITIONS. Second European Conference on Earthquake Engineering and Seismology (2ECEES), EAEE, Aug 2014, Istanbul, Turkey. �insu-01742681�
1
TESTING THE USE OF LOCAL SLOPE AS A PROXY OF GMPE’S
SITE CONDITIONS
Boumédiène DERRAS
1, Pierre-Yves BARD
2, Fabrice COTTON
3and Anne LEMOINE
4ABSTRACT
In the past few years it has been proposed to use the topographic slope from digital elevation models (DEMs) to give first-order estimates of NEHRP site classes based on the average shear-wave velocity in the top 30 m, VS30. The direct testing of the correspondence between local slope and VS30 has
already been evaluated with variable success on different data sets (e.g. Lemoine et al., 2012). Here, we take advantage of a recent high quality accelerometric database developed in Europe (References database for Seismic grOund-motion pRediction in Europe (RESORCE) to evaluate and analyse the relative decrease of the ground-motion aleatory variability brought by the consideration of VS30 and/or
local slope as a proxy to site conditions. A subset of the RESORCE database consisting of shallow crustal events recorded on sites with actually measured VS30 values and available slopes (i.e., close to
1000 recordings for RESORCE) is considered. The Artificial Neural Network (ANN) approach and a random-effects like procedure have been used for the derivation of GMPEs setting the relationship between various ground motion parameters (PGA, PGV and 5% damped pseudo-spectral acceleration PSA from 0.01 s to 4 s), and event / station meta-parameters (moment magnitude Mw, Joyner- Boore
distance RJB, and site proxies VS30 and/or slope). This preliminary analysis shows the lower and rather
poor performance of the local topographic slope in reducing the GMPE aleatory variability, compared to the performance of measured VS30. The analysis is performed both using discrete site classes
(mainly A/B, C and D, NEHRP notation) and continuous proxy values [log10(VS30) and log10(slope)].
INTRODUCTION
It is widely common to account for local site effects by characterizing site conditions in terms of shear-wave velocity, VS of the upper layers at the site. For example, the European seismic building
code Eurocode 8 (EC8) is classifying soils conditions into four categories (D to A) by using the average VS down to a depth of 30 m (VS30) (Lemoine et al., 2012). It has been observed (e.g.,
Borcherdt, 1994) that VS30 is a useful parameter to predict local site amplification in active tectonic
regimes but VS30 only cannot, of course, well predict the amplification for sites underlain by deep
sediments, which require knowledge of the geology to depths greater than 30 m (e.g.,Choi et al., 2005). VS30 is a simple metric that can be obtained at relatively low cost compared to more detailed
1 Associate professor, RISAM laboratory-Tlemcen University, Tlemcen, b_derras@mail.univ-tlemcen.dz 2 Senior scientist, ISTerre, Univ. Grenoble Alpes/ IFSTTAR, Grenoble, pierre-yves.bard@ujf-grenoble.fr 3 Professor, ISTerre-Univ. Grenoble Alpe, Grenoble, fabrice.cotton@ujf-grenoble.fr
2
descriptions of site characteristics, and it is correlated with site amplification (Boore et al., 2011). Because of this simplicity, Vs30 is widely used in seismic building codes. However, in many
seismically active regions of the world, the information about surficial geology and shear wave velocity (VS) either does not exist, varies dramatically in quality, varies spatially, or is not easily
accessible. Topographic elevation data, on the other hand, are available at uniform sampling for the globe (Allen and Wald, 2009).
In the past few years a series of articles have been published concerning the use of topographic slope from digital elevation models (DEMs) constructed through remote sensing (satellite imaging) to give a first-order estimation of site classes based on VS30 (Wald and Allen, 2007, Allen and Wald,
2009).
Does this rather simple parameter give first-order site amplification information? Are slope based amplification similar to amplification factors based on Vs30? The aim of this work is to evaluate
and analyse the relative decrease of the ground-motion aleatory variability brought by the consideration of VS30 and/or local slope as a proxy to site conditions. This analysis is performed by
interpreting results obtained from ground motion prediction equations (GMPEs). The analysis is performed both using discrete site classes (mainly B and C, EC8 notation) and continuous proxy values [log10(VS30) and log10(slope)].
The used database, RESORCE, consists of shallow crustal events recorded on sites with actually measured VS30 values and available slopes (Akkar et al., 2014). The Artificial Neural Network (ANN)
approach and a random-effects like (Derras et al., 2014) procedure have been used for the derivation of GMPEs setting the relationship between various ground motion parameters (PGA, PGV and 5% damped pseudo-spectral acceleration PSA from 0.01 s to 4 s), and event / station meta-parameters (moment magnitude Mw, Joyner- Boore distance RJB, and site proxies VS30 and/or slope).
After a short presentation of the data set and the selection criteria used for the present study, a section is dedicated to the presentation of the ANN models and its specific implementation in the present application. The following section concentrates on the results of the application to the RESORCE data. The ANN has the advantage that no prior functional form is needed (Derras et al., 2012): the actual dependence is established directly from the data, and can therefore be used as a guide for a better understanding of the factors which control ground-motions. The ANN approach is used to discuss the respective influences of each considered site proxy.
DATA SET
The strong motion data set is based on the RESORCE European database. It consists of a subset for which both site proxies, i.e., VS30 and slope, are available. We have eliminated all the recordings for
which Mw is unavailable and recordings from events with a depth larger than 25 km, to focus on
shallow crustal earthquakes. Only sites with measured VS30 values have been considered. Such
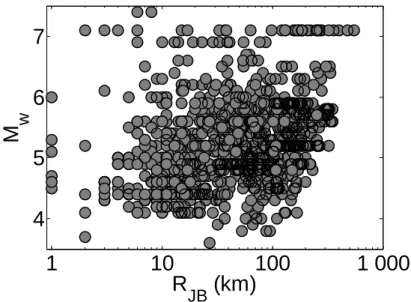
selection criteria result in a total of 1028 recordings, covering the magnitude range [3.6–7.6] and a Joyner & Boore distance (RJB) range [1 – 200] km. The Vs30 values are in the range [92 - 1600] m/sec,
while the corresponding topographic slopes are in the range [5.10-4 - 0.32] m/m. It turns out that most
of the recordings come from Turkey (624) and Italy (359). The data from the two countries do not cover the same magnitude and distance range. Derras et al. (2014) indicates that the majority of Turkish earthquakes are recorded at a distance larger than 30 km (unlike Italy) and cover a larger magnitude range than Italian earthquakes.
The distribution of this dataset according to Mw, distance, and site proxy planes is displayed on
Figures 1 and 2. In this last figure, we are also representing the values of site classes intervals in terms of VS30 values (m/sec) and topographic slope (m/m) for the EC8 classification (A, B, C and D) with
the membership in (%) for each class (Vs30∩Slope). From this figure we note that there are no
recordings corresponding to soft sites (class D), while class A data represent less than 2% of the total database, knowing also that the neural model is driven by data, the models developed in this study will not be valid for Class A.
B.Derras, P-Y Bard, F.Cotton and A.Lemoine 3
1
10
100
1 000
4
5
6
7
R
JB(km)
M
wFigure 1. Distribution of the data set. Magnitude Mw vs distance (RJB)
1E-5
1E-4
1E-3
0.018 0.138
1
100
180
360
760
1500
Slope (m/m)
V
s3 0(m/sec)
A (1.56%) D (0%) B (41.83%) C (21.21%)Figure 2. Correlations of measured VS30 (m/sec) versus topographic slope (m/m). Boxes represent VS30 and slope
ranges recommended by Wald and Allen (2007) and Allen and Wald (2009) for active tectonic areas for classification into NEHRP categories (roughly equivalent to EC8 classes (Lemoine et al., 2012)).
ANN MODELS
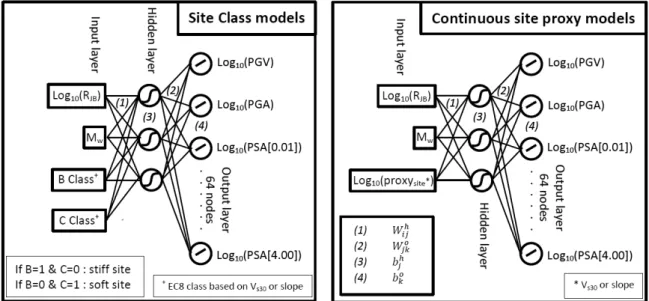
The Artificial Neural Network Model of Multilayer Perceptron with a total connection is used here, with one hidden layer (Figure 3). The ANN type used in this work is the feed-forward ANN. The Quasi-Newton Back Propagation technique also called “BFGS” has been applied for the training phase (Shanno and Kettler, 1970). To avoid “over-fitting” problem we chose the adequate regularization method (Derras et al., 2012). Moreover, the selected activation functions are a "tangent sigmoïd" for the hidden layer and "linear" for the output layer. In figure 3, the symbols W and b represent the synaptic weights and bias with subscripts representing the corresponding neurons between two layers, respectively. The hidden layer consists of 3-neurons and the output layer groups all the considered ground motion parameters, i.e. peak ground velocity (PGV), peak ground acceleration (PGA), and 5%-damped pseudo-spectral acceleration (PSA) at 62 periods from 0.01 to 4 s. A procedure similar to the random-effects approach was used to provide between- and within-event standard deviations, as described in Derras et al., (2014). Four different ANN models were built, differing by the site proxy used in the input layer. Besides the moment magnitude Mw, and log10(RJB) where RJB is the Joyner &
B.Derras, P-Y Bard, F.Cotton and A.Lemoine 4
Boore distance, the site proxies are the site classes derived from a. VS30 (EC8 classes B and C, i.e.,
VS30 within the range [360 – 800 m/s] and [180-360 m/s]), b. the corresponding slope range as
proposed by Wald & Allen (2007), as displayed in Figure 3-left. C. continuous site proxy, i.e., log10(VS30) or log10(slope), as displayed in Figure 3-right. In addition, a fifth ANN model was
considered with only two input parameters (magnitude and distance) and no site proxy, in order to set the reference for quantifying the gains brought by the consideration of the various site proxies.
Figure 3. Structure of the Neural Networks considered in this study, for discrete (left) and continuous (right) site proxies
RESULTS
The five models are named ANN-Vs30-C and ANN-slope-C for discontinuous models (figure.3 left)
and ANN-Vs30 and ANN-slope for continuous models (figure.3 right). The fifth ANN model (without
any site proxy) is named ANN-none.
The ANN model is obtained using the random-effect model (Abrahamson and Youngs, 1992). In addition to the median, this approach gives the aleatory uncertainly model. The performances of the results obtained by ANN are measured by the standard deviation σ value used in classical GMPEs.
Sigma () is usually decomposed into the between-event () and within-event () variabilities,
which are zero-mean, independent, normally distributed random variables with standard deviations τ and ϕ, (Al Atik et al., 2010). The between-events and within-event residuals are uncorrelated, so the total standard deviation at a period T of the ground-motion model, σ, can be written as:
2 ) ( 2 ) ( ) (T T T
(1)
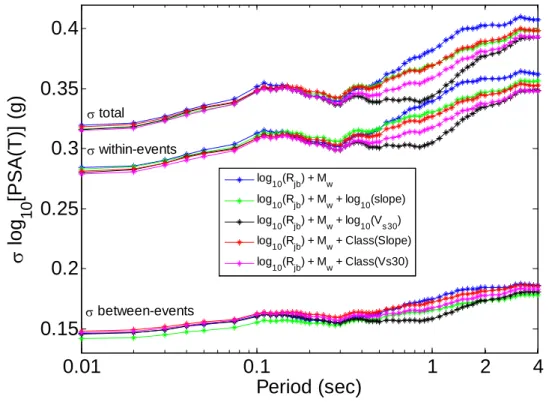
The variations of , and σ versus the period are presented on Figure 4 for the five ANN models. The values of the between-event variability are much lower than the within-event variability values. These values exhibit a general trend of an increasing variability with period (figure 4). In the other hand, all ANN models depict almost the same variability for periods lower than 0.5 sec (figure 4).
The relevancy of the site proxy is evaluated by its ability to reduce the residuals between predictions and observations (i.e., the aleatory variability σ). For T>0.5 sec (Figure 4), the σ reduction shown by models using site proxies is clear. It turns out that the smallest reductions correspond to the cases where the site proxy is the slope, used either for site classification (ANN-slope-C) or as a
B.Derras, P-Y Bard, F.Cotton and A.Lemoine 5
continuous site parameter (ANN-slope), while the largest reductions are obtained with measured VS30
as input. These reductions are very clear for periods above 0.5 sec for within-event variability.
In addition, we represent the values of and the variance reduction coefficient R Eq.(2) in Table 1 for PGA and PSA at T=0.5, 1.0 and 2.0 sec. The obtained results confirm that the reduction becomes significant beyond T = 0.5 sec and for ANN-Vs30 and takes its maximum at T = 1.0 sec, R =
10 %. (%) ; 100 ). 1 ) ( ) ( ( ) ( none T proxy T T R
(2)
Otherwise, the distinction between between-event and within-event variabilities indicates that the aleatory reduction associated to the use of site proxies comes primarily from the reduction in the within-event variability, as expected
0.01
0.1
1
2
4
0.15
0.2
0.25
0.3
0.35
0.4
Period (sec)
lo
g
10[P
S
A
(T
)]
(g
)
log 10(Rjb) + Mw log 10(Rjb) + Mw + log10(slope) log 10(Rjb) + Mw + log10(Vs30) log10(Rjb) + Mw + Class(Slope) log10(Rjb) + Mw + Class(Vs30) between-events total within-eventsFigure 4: Sensitivity of the aleatory variability to the site proxy used as input for the neural network. Top left : total sigma as a function of period. Bottom left : between-event sigma. Bottom right: within-event
sigma
Tabe 1. Total sigma () and variation reduction (R) for the five ANN types and for T=0,5, 1 and 2 sec
ANN type T=0.00 sec T=0.50 sec PSA and R(%) T=1.00 sec T=2.00 sec
ANN-none 0.319 0.356 0.382 0.403
ANN-slope-C 0.318 -0.3 0.353 -0.8 0.369 -3.4 0.389 -3.5 ANN-slope 0.316 -0.9 0.353 -0.8 0.370 -3.1 0.388 -3.7 ANN-Vs30-C 0.315 -1.3 0.345 -3.1 0.359 -6.0 0.381 -5.5 ANN-Vs30 0.314 -1.6 0.339 -4.8 0.344 -9.9 0.377 -6.5
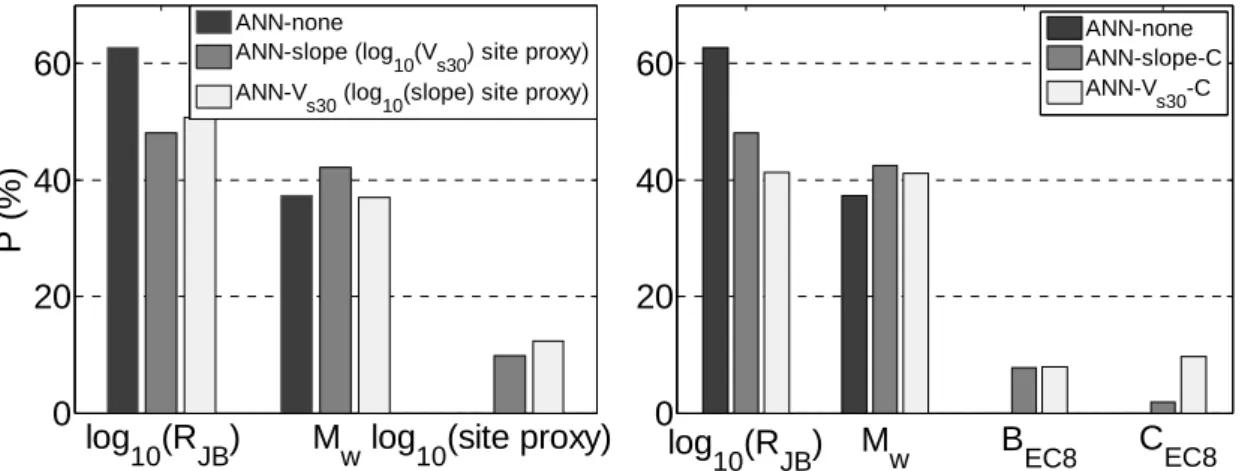
As a complementary information to the effects of the input parameters on σ (table 1 and figure 4), and in order to illustrate the meaning of the internal synaptic weights of the ANN approach, the total percentage of synaptic weights P corresponding to each of the five parameters was computed (following the Eq.(4) indicated in Derras et al. (2014)).
B.Derras, P-Y Bard, F.Cotton and A.Lemoine 6
These coefficients P have been computed for all ANN models shown in figure 5. According to the analysis of the internal synaptic weights, the most important parameter is the distance, followed directly by the earthquake magnitude, Mw. For site conditions, the internal synaptic weights associated
to the measured Vs30 is larger (PVs30 =12 %) that the internal synaptic weights associated to the slope
(Pslope = 9 %). This ranking is similar to the ranging obtained from the analysis of aleatory variabilities
discussed above.
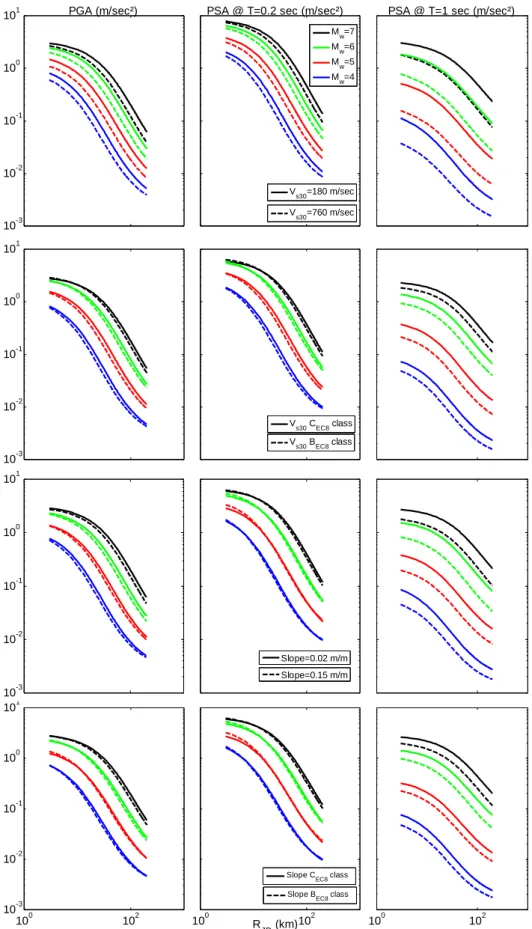
Figure 6 displays the magnitude and distance dependences of PGA and spectral accelerations at 0.2 s and 1.0 s. Besides the good performance of the ANN approach to account for the near-field saturation and magnitude-dependence of the spatial decay, a striking feature of these comparisons is the much smaller variations of predicted ground-motions according to site conditions when the slope is used as a site proxy (compared to the VS30 case) especially for small periods.
0 20 40 60 P ( % ) ANN-none ANN-slope (log 10(Vs30) site proxy) ANN-Vs30 (log10(slope) site proxy)
M
w
log
10(RJB) log10(site proxy)
0 20 40 60 ANN-none ANN-slope-C ANN-V s30-C log 10(RJB) Mw BEC8 CEC8
Figure 5. Sensitivity of the ground motion parameters to the metadata parameters, P (%) is the total percentage of synaptic weight corresponding to each input parameters for the cases of continuous (left) and discrete (right)
site proxies.
CONCLUSION
This study investigated the impact of various site conditions proxies on ground-motions predictions models for a subset of the RESORCE data base involving 1028 recordings ranging from 3.6 to 7.6 in moment magnitude and from 1 to 200 km in Joyner&Boore distance, all with measured VS30 values
- The ground-motion aleatory variability σ associated to the derived GMPEs is minimum when using a site classification (i.e., EC8 site classes A, B and C) based on measured Vs30. Using slope values for
assigning site classes is significantly less efficient in reducing σ.
- The same conclusion stands also for continuous models, with an even larger difference between VS30
based modelsand slope proxies based models.
For the considered data set, the reduction of the aleatory variability is effective in the intermediate to long period range, i.e. from 0.5 to 4 s, with maximum effects around 1.0 s period. It is worth to notice that larger variance reductions are associated with larger site factors (Figure 6). As a consequence, ground-motion models based on the slope proxy results in a much smaller differentiation of spectral amplitudes between soft and very stiff sites. This may lead to an underestimation of ground-motions.
B.Derras, P-Y Bard, F.Cotton and A.Lemoine 7
10-3 10-2 10-1 100
101 PGA (m/sec²) PSA @ T=0.2 sec (m/sec²) Mw=7 Mw=6 Mw=5 Mw=4
PSA @ T=1 sec (m/sec²)
Vs30=760 m/sec Vs30=180 m/sec 10-3 10-2 10-1 100 101 Vs30 BEC8 class Vs30 CEC8 class 10-3 10-2 10-1 100 101 Slope=0.15 m/m Slope=0.02 m/m 100 102 10-3 10-2 10-1 100 101 100 102 100 R 102 JB (km) Slope C EC8 class Slope B EC8 class
Figure 6. Magnitude and distance dependences of the predicted ground motions predicted by the four derived ANN ground-motion models .The three columns from left to right correspond to PGA, PSA(0.2 s) and PSA(1.0
s), respectively. The four rows correspond to the four ANN ground-motion models: log10(VS30), log10(slope),
Class(VS30) and Class(slope), from top to bottom. In each case, the dashed line corresponds to a stiff site, and the
B.Derras, P-Y Bard, F.Cotton and A.Lemoin 8
DATA AND RESOURCES
The RESORCE database used in this article have been collected and disseminated by the Euro-Mediterranean Seismological Centre (EMSC) data management center at http://jaguar.emsc-csem.org/sigma/.
REFERENCES
Abrahamson NA and Youngs, RR (1992)” A stable algorithm for regression analyses using the random-effects model,” Bull Seismol Soc Am, 82:505–510
Akkar S, Sandıkkaya MA, Senyurt M, Sisi AA, Ay BÖ (2014) “Reference Database for Seismic Ground-Motion in Europe (RESORCE),” Bull. Earthq. Engng, 12(1):311-339
Al Atik L, Abrahamson N, Bommer JJ, Scherbaum F, Cotton F, Kuehn N (2010)” The variability of groundmotion prediction models and its components,” Seismol Res Lett, 81(5):794–801
Allen TI and Wald, DJ (2009)” On the use of high-resolution topographic data as a proxy for seismic site conditions (VS30),” Bull. eismol. Soc. Am, 99( 2A):935–943
Boore DM, Thompson EM, Cadet H (2011)” Regional Correlations of VS30 and Velocities Averaged Over
Depths Less Than and Greater Than 30 Meters,” Bull. eismol. Soc. Am, 101(6):3046–3059
Borcherdt, RD (1994)” Estimates of site-dependent response spectra for design (methodology and justification),”
Earthquake Spectra, 10(4):617–653
Choi YJ, Stewart JP, Graves RW (2005)” Empirical model for basin effects accounts for basin depth and source location,” Bull. eismol. Soc. Am, 95 (4):1412–1427
Derras B, Bard P-Y, Cotton F (2014)” Towards fully data-driven ground-motion prediction models for Europe,”
Bull. Earthq. Engng, 12(1):495-516
Derras B, Bard P-Y, Cotton F, Bekkouche B (2012)” Adapting the neural network approach to PGA prediction:an example based on the KiK-net data,” Bull Seism Soc Am, 102(4):1446–1461.
Douglas J, Akkar, A Ameri G, Bard P-Y, Bindi D, Bommer JJ, Bora SS, Cotton F, Derras B, Hermkes M, Kuehn NM, Luzi L, Massa M, Pacor F, Riggelsen C, Sandıkkaya MA, Scherbaum F, Stafford PJ, Traversa P (2014)”Comparisons among the five ground-motion models developed using RESORCE for the prediction of response spectral accelerations due to earthquakes in Europe and the Middle East,” Bull.
Earthq. Engng,12(1):341-358
Lemoine A, Douglas J, Cotton F (2012)” Testing the Applicability of Correlations between Topographic Slope and VS30 for Europe,” Bull. Seism Soc. Am, 102(6): 2585-2599
Shanno DF and Kettler, PC (1970)” Optimal Conditioning of Quasi-Newton Methods,” Math. Comp. 24(111): 657-664
Wald DJ and Allen, TI (2007)” Topographic slope as a proxy for seismic site conditions and amplifications,”