HAL Id: hal-03089935
https://hal.archives-ouvertes.fr/hal-03089935
Preprint submitted on 29 Dec 2020
HAL is a multi-disciplinary open access archive for the deposit and dissemination of sci-entific research documents, whether they are pub-lished or not. The documents may come from teaching and research institutions in France or abroad, or from public or private research centers.
L’archive ouverte pluridisciplinaire HAL, est destinée au dépôt et à la diffusion de documents scientifiques de niveau recherche, publiés ou non, émanant des établissements d’enseignement et de recherche français ou étrangers, des laboratoires publics ou privés.
Access-for-all to Financial Services: Non-resources Tax
Revenue-harnessing Opportunities in Developing
Countries
Ali Compaoré
To cite this version:
Ali Compaoré. Access-for-all to Financial Services: Non-resources Tax Revenue-harnessing Opportu-nities in Developing Countries. 2020. �hal-03089935�
Access-for-all to Financial Services: Non-resources Tax
Revenue-harnessing Opportunities in Developing
Countries
Ali Compaoré
†Abstract
Financial inclusion refers to access to and use of formal financial services by individuals and businesses and the literature unambiguously documented that access-for-all to financial services is conducive to important economic and development outcomes. In this paper, we particularly investigate the impact of financial inclusion on non-resources tax revenue in developing countries. Based on a sample of 63 developing countries over the period 2004-2017 and drawing on the dynamic generalized method of moments (GMM), the paper finds that greater access to financial services captured by the number of ATMs per 100,000 adults increases government non-resources tax-to-GDP ratio, and this result is driven by households consumption and business expansion. Our findings provide insights on tax resources-harnessing opportunities from implementing and promoting financial inclusion policies for developing economies.
JEL Codes: G21; H20; O11; O23.
Key words: Financial inclusion, Non-resource tax-to-GDP ratio, Private consumption, Unemployment, Developing countries.
« Finance is the oxygen to the rest of the economy. It enables business to grow and
people to manage risk. If you do not have finance, life is a lot more difficult. »
Peter Sands
† Université Clermont Auvergne, CNRS, CERDI, F-63000 Clermont-Ferrand, France.
1. Introduction
Financial inclusion refers to access to and use of formal financial services by individuals and businesses (Sahay et al., 2015a).2 A broader definition considers, in addition to the access and
use of financial services, further aspects including the quality and range, usefulness and appropriateness, affordability, sustainability, and awareness of financial services and products as well as the consumer protection (Grace et al., 2014; SBS 2014; BSP 2015; World Bank 2018; Jahan et al., 2019; and Espinosa-Vega et al., 2020), making financial inclusion a multifaced concept. The measurement of financial inclusion also remains an important issue in the empirical literature given to its multidimensional aspect. While some components are particularly more easily capturable, other dimensions are not readily observable.3 Over recent
years, increasing attention has been paid to financial inclusion among both, policy-makers and academics considered as a key factor to achieve the 2030 Sustainable Development Goals (SDGs). Financial inclusion has become a priority of policy agenda in a number of economies across the globe, with more than 50 countries having adopted a National Financial Inclusion Strategy (Espinosa-Vega et al., 2020).
The consensus in the literature is that access-for-all to financial services is conducive to broader economic and development outcomes, though access to finance still constitutes a major constraint for business creation and expansion in developing countries (World Bank, 2014; Demirgüç-Kunt et al., 2015). Financial inclusion is crucial for inclusive and sustainable economic growth and non-access to formal financial services like bank account entails greater cash transactions is associated with higher transaction fees and financial risks (Lusardi, 2010). Greater financial inclusion positively affects the GDP, while reducing inequality in developing and emerging (Dabla-Norris et al.,2015). Similarly, focusing on Latin America and the Caribbean (LAC) countries, Dabla-Norris et al. (2015) conclude that easing financial services access and relaxing collateral constraints helps reduce inequality and spur growth. Using a wide sample of
2 Financial inclusion is different from financial development. The latter occurs when financial instruments, markets,
and intermediaries ameliorate – the effects of information, enforcement, and transactions costs and therefore do a correspondingly better job at providing the five financial functions (Levine, 2005) – though the former is a dimension of the latter (see e.g., Sahay et al., 2015). In addition, more financial development may allow greater access to financial services as emphasized in Rajan and Zingales (2003).
123 countries, Allen et al. (2015) highlight that financial inclusion is associated with stronger legal rights and more politically stable environments.
Micro-level and field experiment studies evidenced that microfinance branch expansion and access to credit facilities is conducive to business expansion and entrepreneurial activities development (Bruhn and Love, 2014; Angelucci, et al., 2015; Fareed et al., 2017). Similarly, Banerjee et al. (2010) show that access to microcredit increases small business investment and profits of preexisting businesses in India. Focusing on the Bosnia, Augsburg et al. (2015) also highlight that lower rejection of households’ formal loans applications induces higher self-employment, increases in inventory and an increase in the labor supply in the household’s business. Similarly, in rural Kenya, Dupas and Robinson (2011) provide strong evidence that extending basic banking services (e.g. saving accounts) is associated to an increase in the size of market women businesses. In line with the disciplining effect of group lending, Attanasio et
al., (2011) find a positive impact of access to group loans on entrepreneurship in Mongolia.
Access to group loans increases the likelihood of owning an enterprise by 10 percent.
Financial inclusion is found to be an important tool for empowering women and strengthening female decision-making power in developing countries. Relying on a randomized controlled trial, Ashraf et al. (2010) find that access to basic financial service such as saving accounts is associated to an increase in female decision-making power within the household in the Philippines.
The literature also asserted that financial inclusion positively affects households consumption as well as households income (Banerjee et al. 2010; Karlan and Zinman, 2010; Attanasio et al., 2011; Dupas and Robinson, 2011; Bruhn and Love, 2014; Zhang and Posso, 2017). Access to financial services allows households to respond to income shocks by raising their current consumption (Bhattacharya and Patnaik, 2015), facilitates households consumption smoothing and softens output volatility cost (Mehrotra and Yetman, 2015). In addition, greater access to financial services encourages households saving. Aportela (1999), based on natural experiment shows that the financial inclusion increased the average saving rate of households by around 5 percentage points and this effect was even higher for the poorest households in Mexico. Furthermore, access to financial service favors human capital development and increases jobs opportunities (Demirgüç-Kunt et al., 2008). For instance, De Gregorio (1996) on an overlapping
generations model with endogenous growth, highlights that access to financial services is associated with an increase in human capital accumulation and growth in OECD and developing countries.
Subsequent studies explored the impact of access to financial services on the level of poverty (Burgess et al., 2005; Burgess and Pande, 2005; Honohan, 2004a,b; Honohan, 2005, 2006; Karlan and Zinman, 2010; Kiendrebeogo and Minea, 2013; Bruhn and Love, 2014; Banerjee et al., 2015; Rewilak, 2017) and find that access to basic financial services is associated with a decrease in the poverty rates. For instance, Coulibaly and Yogo (2018) recently evidenced that improving financial outreach through additional bank branches reduces the number of poor workers in developing countries.
Nevertheless, parallel to this literature, some studies have documented that greater access to financial services without proper financial supervision might be harmful to economic outcomes and result into financial distress (Rajan, 2010; Han and Melecky, 2013; Sahay et al., 2015). For instance, high financial inclusion combined with a boom in access to credit is associated to a deterioration in credit quality and thereby leading to financial risks (Mehrotra and Yetman, 2015). In addition, Dabla-Norris et al. (2015) analyzing factors constraining firms to access to finance find that greater access to credit could result in bank instability by increasing non-performing loans.
Although Čihák and Sahay (2018) postulate that inclusive financial systems can increase the effectiveness of fiscal policy by broadening the tax, studies exploring the potential effect of accessing to financial services on government tax revenue are very scarce (Oz-Yalaman, 2019). Also, studies particularly focusing in developing countries and using non-resources tax revenue is non-existent. To the best of our knowledge, our paper is therefore the first to provide a strong and convincing evidence on the nexus between financial inclusion and non-resources tax ratio in developing countries. Our contribution to the literature relies on the use of comparable4 tax revenue ratio excluding natural resources revenue. As underscored in Caldeira
4 Oz-Yalaman (2019) explored the nexus between financial inclusion and tax revenue but using different sources of
total tax revenue and tax subcomponents. This entails important shortcomings since the datasets are not strictly comparable (Sahay et al., 2015).
et al. (2020), distinguishing resource from non-resource revenue is highly relevant to
understand tax capacity in developing countries and the literature has well-documented a
crowding-out effect between resources revenue and non-resource tax revenue (Bornhorst et al., 2009; Crivelli and Gupta, 2014; James, 2015 among others). In addition, unlike the empirical
method employed in Oz-Yalaman (2019), we adopted a dynamic specification to account for the inertia in government tax revenue.
Using a sample of 63 developing countries over the period 2004-2017 and drawing on the dynamic generalized method of moments (GMM) to solve the endogeneity and any reverse causality issue, the chapter shows that greater access to financial services captured by the number of ATMs per 100,000 adults increases government non-resources tax-to-GDP ratio. Looking at the tax revenue structure, the results show that indirect taxes revenue accounts the most sizeable positive effect of increased penetration of ATMs on tax revenue. Exploring the channels through which financial inclusion influences non-resource tax ratio, our empirical results highlight that the positive effect of greater access to financial services mainly operates through private consumption and business expansion. Our results survived to a battery of robustness exercises including (1) adding more control variable namely the level of education, inflation, the population size, external aid received, domestic financial sector development, remittances inflows and the tax structure, (2) the use of alternative financial inclusion measures to capture the multifaceted aspect of our interest variable and (3) using alternative tax data source.
This chapter provides insights to countries that have implemented or are in the process of implementing financial inclusion policies, on tax revenue-harnessing opportunities from access-for-all financial services.
The remainder of the chapter is structured as follows: the second section describes the econometric methodology and introduces the dataset with some stylized facts. Section 3 presents the baseline results from the empirical specification and considers some robustness checks. Section 4 provides concluding remarks and draws policy implications.
2. Empirical Methodology and Data
2.1. Econometric Model
The following dynamic panel model that captures the impact of financial inclusion on non-resources tax revenue was estimated:
NRTax
i,t= α+ βNRTax
i,t-1+ ψFInc
i,t+ Z
i,tδ+ λ
i+ ζ
t+ ε
it (1) 𝑁𝑅𝑇𝑎𝑥𝑖,𝑡 is the non-resource tax-to-GDP ratio for country 𝑖 at time 𝑡. We included the one-period lagged value of the dependent variable –𝑁𝑅𝑇𝑎𝑥𝑖,𝑡– because of the inertia in the total tax revenue. 𝐹𝐼𝑛𝑐𝑖,𝑡 is the financial inclusion indicator and 𝒁𝑖 ,𝑡 is a set of variables that explain the government tax revenue ratio. 𝜆𝑖 and 𝜁𝑡 denote time-invariant country-level characteristics and time-varying factors, respectively that could potentially affect the tax ratio. The last term, 𝜀𝑖𝑡 is an idiosyncratic disturbance.Taking stock of previous literature on the principal determinants of the tax share in GDP, the vector 𝒁𝑖 ,𝑡 includes inter alia the level of development, the sectoral composition of value-added (i.e., agriculture and natural resources), the trade openness and the quality of institutions. The real GDP per capita is commonly used to capture countries’ overall level of development. Countries’ tax capacity is intrinsically related to their level of development (Lotz and Morss, 1967; Tanzi 1983; Pessino and Fenochietto, 2010; Fenochietto and Pessino, 2013; Crivelli and Gupta, 2014). High-income countries are expected to raise more tax revenue than developing countries due to the more efficient and strong tax administration, higher degree of economic and institutional sophistication. To capture the non-linearity effect of the level of development and tax capacity, we include the squared of this variable in the specification.
Trade openness refers to the volume of international trade in the GDP. Substantial increase in trade volume makes it more amenable to taxation through domestic consumption and corporate profits (Chelliah et al., 1975; Leuthold, 1991; Tanzi, 1992; Stotsky and WoldeMariam, 1997; Stotsky and WoldeMariam, 2006; Pessino and Fenochietto 2010; Gnangnon and Brun, 2018).
The effect of natural resources rents on tax revenue ratio is widely evidenced in the literature but remains controversial. While pioneering studies evidenced a positive effect of natural resource rent on tax revenue (Cheliiah et al., 1975 and Tanzi, 1992), recent resource curse literature highlights a negative association between natural resources rents and government tax revenue, suggesting a crowding-out effect (Sachs and Warner, 2001; Eltony, 2002; Bornhorst
et al., 2009; McGuirk, 2013; Crivelli and Gupta, 2014; James, 2015; Belinga et al. 2017). Therefore,
the effect of natural resources rents on tax revenue is a priori ambiguous.
The share of agriculture in the GDP is found to be negatively associated with non-resource tax ratio (Cheliiah et al., 1975; and Tanzi, 1992; Stotsky and WoldeMariam, 2006). Developing countries are still featured by large shares of the subsistence agricultural sector which is not generating taxable surpluses. In addition, this sector is more often subject to tax exemptions considered as sector providing food for subsistence (Stotsky and WoldeMariam, 2006). We proxy the quality of institutions by the polity2 index assessing the degree of democracy. High and strong economic and political institutions are expected to promote tax administrations allowing more tax revenue collection (Davoodi and Grigorian, 2007); Gupta, 2007; Gordon and Li, 2009; Clist and Morrissey, 2011; Fenochietto and Pessino, 2013; Feger and Asafu-Adjaye, 2014), while the lower quality of institutions portrayed by higher corruption is a threat for tax revenue collection as it affects tax administration and tax officers and occasioning tax evasion.
Equation (1) is a dynamic specification since the non-resource tax-to-GDP ratio at period 𝑡 depends on its past realizations. Thus, relying on classical linear Ordinary Least Squares (OLS) estimator would lead to inconsistent and biased results (Nickel, 1981; Wooldridge, 2002). The appropriate estimator for dynamic panel data models appears to be the popular Generalized Method of Moments (GMM). The GMM estimator is designed for dynamic specifications with “small-T, large-N”5 panels and allows to tackle potential issues of endogeneity, simultaneous
and omitted variables bias. Hence, this estimator will allow, not only to correct the possible endogeneity of our interest variable –financial access– but also to correct for endogeneity of
all right-hand side variables by using the lagged values as instruments (one to two lags). Our analysis specifically relied on the system-GMM proposed by Blundell and Bond (1998) with the two-step estimator. However, the validity of the GMM estimation relies on the main assumption that instruments are exogenous (Roodman, 2009). Therefore, we resort to Hansen’s test for over-identifying restrictions to check the validity of the instruments. Another condition that validates the GMM estimator is the absence of second-order serial correlation in the residuals in difference. Accordingly, the Arellano-Bond's test is used to check that condition.
2.2. Data and Some Stylized Facts
The study is conducted on a sample of 62 developing countries over the period 2004-2018, based on data availability.6 The dataset consists in a yearly unbalanced panel because of
missing observations and is compiled from various sources including the World Bank’ Worldwide Development Indicators (WDI), the International Monetary Fund’s World Economic Outlook (WEO), Penn World Tables (PWT9.1) and the Polity4 project.7
Thought there are currently several of available sources of cross-country tax revenue data including the World Bank, the Organization for Economic Co-operation and Development (OECD), and the Comisión Económica para América Latina y el Caribe (CEPAL), tax revenue data used in this study come from the most recent ICTD/UNU-WIDER, Government Revenue Dataset8 (henceforth ICTD dataset). This dataset combines several major international
databases, as well as drawing on data compiled from all available International Monetary Fund (IMF) Article IV reports (Prichard et al., 2014). ICTD dataset has the advantage to be available for a large number of developing countries which is the focus of this study. More importantly, unlike alternative databases, ICTD dataset has the particularity to exclude natural resource revenue tax revenue9, then providing a non-resource tax revenue data. As stressed in Caldeira
et al. (2020), distinguishing resource from non-resource revenue is highly relevant to
6 The developing countries category considered in this paper refers to the World Bank income classification, hence
including low-income and middle-income countries. The complete country list by region is provided in Table A1 of Appendices.
7 See Table A2 for complete definition and sources of variables. 8 The database is available at https://www.ictd.ac/dataset/grd/
understand countries’ tax effort and some studies in the literature highlight a crowding-out effect between resources revenue and non-resource tax revenue (Bornhorst et al. 2009; McGuirk, 2013; Crivelli and Gupta, 2014). A competing rich non-resource tax revenue dataset was developed by Mansour (2010) covering 1980-2010 and recently updated to 2015 (see Caldeira et al.,2020). However, this database only focuses on 42 Sub-Saharan African countries. We, therefore, relied on ICTD dataset for coverage purpose. Tax data used in this paper cover six tax series namely: (i) total tax revenue; (ii) indirect taxes; (ii) direct taxes; (iv) income taxes; (v) taxes on goods and services, and (vi) value-added tax, all expressed as percentage of GDP. Data on financial inclusion are extracted from the IMF’s Financial Access Survey database10 and
include 8 indicators of financial access : (i) the number of automated teller mach ines (ATMs) per 100,000 adults; (ii) the number of commercial bank branches per 100,000 adults; (iii) the number of loan accounts with commercial banks per 1,000 adults; (iv) number of depositors with commercial banks per 1,000 adults; (v) number of credit unions and credit cooperatives; (vi) outstanding deposits with commercial banks; (vii) number of depositors with commercial banks, and (viii) loan accounts with commercial banks. Higher values of these indicators suggest a greater degree of financial access.
Focusing on the number of ATMs per 100, 000 adults, Figure 1 shows an upward trend in developing countries, suggesting that financial access is advancing. More precisely, the number of ATMs/ 100,000 adults recorded considerable progress moving from 13 ATMs per 100,000 adults in 2004 to 45 ATMs in 2017, on average. However, this remains low compared to developed countries with 21 and 63 ATMs for 100,000 people in 2004 and 2017, respectively.
Figure 1. Financial Inclusion Over Time
Sources: Author's calculations using IMF-FAS Database, 2019
Figure 2. Non-resource Tax-to-GDP Ratio and ATMs, by Region (Average Values)
Author's calculations using ICTD/UNU-WIDER GRD, 2019 and IMF-FAS Database, 2019. Note: ECA= Europe and Central Asia; LAC= Latin America & Caribbean; SSA= Sub-Saharan Africa; EAP: East Asia & Pacific; MENA=Middle East and North Africa; SA= South Asia.
Figure 2 depicts countries’ tax collection performance measured by the non-resource tax-to-GDP ratio as well as the level of financial access proxied by the number of ATMs per 100,000 adults across regions (Panel [A] and [B], respectively). It emerges that Europe and Central Asia (ECA) and Latin America and Caribbean (LAC) countries have the higher level of financial access in the sample, with on average 44 and 40 ATMs for 100,000 adults, respectively. In the same
0 10 20 30 40 50 A T M s / 1 00 ,0 00 2004 2005 2006 2007 2008 2009 2010 2011 2012 2013 2014 2015 2016 2017 Panel [A] 11.0 13.3 13.5 14.9 15.3 20.1 0 5 1 0 1 5 2 0 N on -r e so u rc e s ta x-to -G D P r at io
ECA LAC SSA EAP MENA SA
Panel [B] 9 11 23 34 40 44 0 1 0 2 0 3 0 4 0 5 0 N um b e r o f A T M s /1 0 0, 0 0 0 a d ul ts
time, those countries appear to be the top performers in terms of tax revenue collection with a non-resource tax-to-GDP ratio of 20.1 and 15.3 per cent on average, respectively. In contrast, it comes out that the level of accessing to financial services is very low in South Asia (SA) and Sub-Saharan Africa (SSA) countries with on average, 9 and 11 ATMs for 100,000 adults, respectively. SA is the lower performer region of the sample in terms of tax revenue raising, with an average tax-to-GDP ratio of 11.9. SSA countries have been making tremendous efforts to collect tax revenue (14.9 percent of GDP on average) over recent years as a result of important tax policy and administration reforms (Mansour and Rota-Graziosi, 2013; Ebeke et
al., 2016) but still have room for greater tax collection. For instance, Caldeira et al, (2020)
stressed that SSA countries could raise up to 22.75 percent of GDP in non-resource taxes if they fully exploited their tax potential.
In figure 3 we provide the correlation between to financial access indicators –the number of ATMs and branches per 100,000 adults – and the total non-resource tax-to-GDP ratio. It clearly appears that more access to financial services is associated with greater tax revenue mobilization.
Figure 3. Correlation Between the Number of ATMs and Branches and Non-resource Tax Ratio
Author's calculations using ICTD/UNU-WIDER GRD, 2019 and IMF-FAS Database, 2019.
0 1 0 2 0 3 0 4 0 N o n -r e s o u rc e s t a x -t o -G D P r a ti o 0 50 100 150 ATMs /100,000 adults
Non-res. tax-to-GDP ratio 95% CI Fitted values 0 1 0 2 0 3 0 4 0 0 20 40 60
Bank branches /100,000 adults
Non-res. tax-to-GDP ratio 95% CI Fitted values
2. Results
2.1. Baseline results
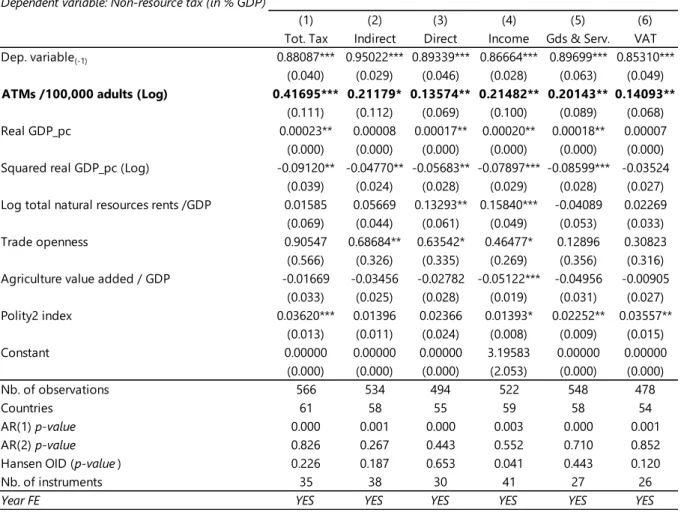
Table 1 reports the system GMM-based estimates of the effect of financial inclusion on the non-resource tax-to-GDP ratio in developing countries as specified in equation (1). Column [1] shows the results for total non-resources tax ratio, while remaining columns (Columns [2]-[6]) display the results for different tax revenue subcomponents as mentioned above.
Resorting to the number of ATMs as a proxy for access to financial services, our empirical results evidence a positive relationship between financial inclusion and non -resources tax revenue. The coefficient associated with financial inclusion is positive and statistically significant at 1% level for total non-resource tax (Column [1]). In addition, the p-values of the Hansen test and the Arellano–Bond tests for serial correlation (AR (1) and AR (2)) are reported at the bottom of the table and confirm all the validity of our econometric approach.11 Our
results are in line with previous studies (Oz-Yalaman, 2019).
Regarding, the composition of tax revenue, the results also support a positive relationship between financial access and all subcomponents of total tax revenue (Column [2]-[6]). More specifically, the coefficient associated with financial inclusion is more sizeable for indirect taxes (Column [2]) compared to the one for direct taxes (Column [3]). This might suggest that more access to financial services allows for greater total tax revenue mobilization through increased consumption and thereby more consumption taxes to collect. This is confirmed by the positive and statistically positive coefficient of financial inclusion on taxes on goods and services (Column [5]), as well as on value-added taxes (Column [6]). In terms of magnitude, 1% percentage increase in the number of ATM will be associated to about 0.0042 percentage points increase in total non-resource tax revenue.
Turning to the control variables, the results indicate that the level of development measured by the real GDP per capita and the quality of the institution appears to be relevant determinants of non-resources tax ratio in developing countries and are positively and significantly
associated with tax ratio. These findings are consistent with previous evidence (Pessino and Fenochietto, 2010; Fenochietto and Pessino, 2013; Crivelli and Gupta, 2014; Davoodi and Grigorian, 2007); Gupta, 2007; Gordon and Li, 2009; Clist and Morrissey, 2011; Fenochietto and Pessino, 2013; Feger and Asafu-Adjaye, 2014) that strong and good institutional quality is favorable to greater tax revenue collection, and countries’ tax capacity is positively related to their level of development. The results also confirm our hypothesis of non-linearity between the level of development and the capacity captured by the negative a significant coefficient associated with the squared of real GDP per capita. In line with previous findings (Tanzi, 1992; Stotsky and WoldeMariam, 2006; Bornhorst et al., 2009; Pessino and Fenochietto, 2010; McGuirk, 2013; Crivelli and Gupta, 2014), natural resources rents, trade openness and agriculture value-added are also determining factors of non-resources tax subcomponents (columns [2], [3] an [4]), while they appear to be non-significant on the total tax ratio.
Table 1. Baseline Results
*, **, and *** denote statistical significance at 10 percent, 5 percent, and 1 percent level, respectively. Standard errors are reported in brackets. Note: The number of instruments is strongly limited-starting with the second lag of the dependent variable and the first lag of the control variables- to avoid the over-fitting problem. In all specifications, the null hypothesis for lack of first-order (AR (1)) serial correlation in the first-differenced error terms is rejected, while not rejected for the second-order (AR(2)). In addition, the robust (to heteroskedasticity and autocorrelation) Hansen’s p-value validates the over-identification restrictions. All of these
Dependent variable: Non-resource tax (in % GDP)
(1) (2) (3) (4) (5) (6)
Tot. Tax Indirect Direct Income Gds & Serv. VAT
Dep. variable(-1) 0.88087*** 0.95022*** 0.89339*** 0.86664*** 0.89699*** 0.85310***
(0.040) (0.029) (0.046) (0.028) (0.063) (0.049)
ATMs /100,000 adults (Log) 0.41695*** 0.21179* 0.13574** 0.21482** 0.20143** 0.14093**
(0.111) (0.112) (0.069) (0.100) (0.089) (0.068)
Real GDP_pc 0.00023** 0.00008 0.00017** 0.00020** 0.00018** 0.00007
(0.000) (0.000) (0.000) (0.000) (0.000) (0.000)
Squared real GDP_pc (Log) -0.09120** -0.04770** -0.05683** -0.07897*** -0.08599*** -0.03524
(0.039) (0.024) (0.028) (0.029) (0.028) (0.027)
Log total natural resources rents /GDP 0.01585 0.05669 0.13293** 0.15840*** -0.04089 0.02269
(0.069) (0.044) (0.061) (0.049) (0.053) (0.033)
Trade openness 0.90547 0.68684** 0.63542* 0.46477* 0.12896 0.30823
(0.566) (0.326) (0.335) (0.269) (0.356) (0.316)
Agriculture value added / GDP -0.01669 -0.03456 -0.02782 -0.05122*** -0.04956 -0.00905
(0.033) (0.025) (0.028) (0.019) (0.031) (0.027) Polity2 index 0.03620*** 0.01396 0.02366 0.01393* 0.02252** 0.03557** (0.013) (0.011) (0.024) (0.008) (0.009) (0.015) Constant 0.00000 0.00000 0.00000 3.19583 0.00000 0.00000 (0.000) (0.000) (0.000) (2.053) (0.000) (0.000) Nb. of observations 566 534 494 522 548 478 Countries 61 58 55 59 58 54 AR(1) p-value 0.000 0.001 0.000 0.003 0.000 0.001 AR(2) p-value 0.826 0.267 0.443 0.552 0.710 0.852
Hansen OID (p-value ) 0.226 0.187 0.653 0.041 0.443 0.120
Nb. of instruments 35 38 30 41 27 26
statistical tests validate the econometric method, and the lagged variables can be safely used as instruments. This applies to all regressions in the chapter.
2.2. Transmission channel
This section explores the main channels through which financial inclusion influences non-resource tax ratio. As stressed above, financial inclusion leads to increased household consumption and business development. Relying on this literature, we expect financial inclusion to affect tax revenue through increased business development and private consumption. Easy access to financial services allows both households and firms (e.g. SMEs) with credit facilities to finance productive investments and increase their consumption. That in turn generates, both, income12 and consumption taxes opportunities for government. Besides,
financial inclusion would positively affect tax revenue through business development based on the rational that business expansion is associated with job creation13 (i.e., decrease in the
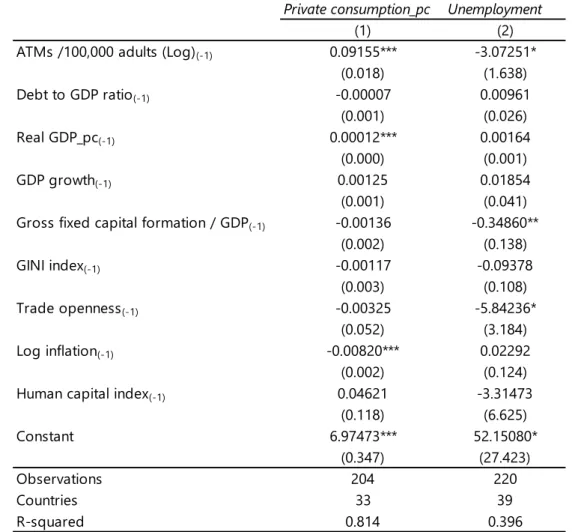
unemployment rate) and income generation for households, thereby income taxes to collect. We proxy the households’ consumption by the private consumption per capita, while the business development induced-effect of financial inclusion is captured through the unemployment rate. However, since these transmission channels might be direct or indirect, we proceeded in two steps: first, we estimate the effects of financial access on each channel, then we estimate the effects of each variable on the total non-resource tax ratio.14
The first step estimation results are reported in Tables 2. The results show that more access to financial services is associated with greater private consumption (column [1]) and a lower unemployment rate (column [2]), confirming previous findings.
12 Taxes on income, profits, & capital gains: corporations.
13 Teima et al. (2010) highlighted that SMEs contribute up to 45 percent of employment in developing countries. 14 An alternative popular approach in the literature to test whether the effect of financial inclusion on non -resource
tax-to-GDP ratio would transmit through the considered channels, consists to run our baseline regression interacting the financial inclusion indicator with each transmission channel (see e.g., Caballero, 2016; Compaore et al., 2020 among other). If the coefficients associated with financial inclusion indicator works out to be non-significant when the interactive terms and the transmission channels are included, we then conclude that the effect financial inclusion on tax revenue can be assumed to operate through private consumption and job creation as a result of business development and expansion. Based on this approach, the results also confirm our hypothesis.
Table 2. Transmission Channels
*, **, and *** denote statistical significance at 10 percent, 5 percent, and 1 percent level, respectively. Robust standar d errors are reported in brackets. Note: fixed effects are included.
In Table 3, we report the results of the effect of the transmission channels on our tax variable. In line with our main hypothesis, households private consumption is positively and significantly associated with total non-resources tax ratio, as well as different tax subcomponents (Panel [A], columns [1]-[6]). Greater private consumption means an increase in consumption tax revenue such as the VAT. It is worth noting that value-added tax has become one of the most important tools of revenue mobilization in the developing world about one-quarter of total tax revenue is raised through value-added tax. (Keen and Lockwood, 2006, 2016, Gerard and Naritomi, 2018). The value-added tax also presents the advantage to be less distortionary in addition to its self-enforcing properties (Kopczuk and Slemrod, 2006).
In Panel [B] of Table 3, we present the results using the unemployment rate. It emerges that the unemployment rate is negatively linked to total tax ratio (column [1]), as well as income taxes and value-added tax (columns [1] and [6], respectively). Financial inclusion reduces
Private consumption_pc Unemployment
(1) (2)
ATMs /100,000 adults (Log)(-1) 0.09155*** -3.07251*
(0.018) (1.638) Debt to GDP ratio(-1) -0.00007 0.00961 (0.001) (0.026) Real GDP_pc(-1) 0.00012*** 0.00164 (0.000) (0.001) GDP growth(-1) 0.00125 0.01854 (0.001) (0.041)
Gross fixed capital formation / GDP(-1) -0.00136 -0.34860**
(0.002) (0.138) GINI index(-1) -0.00117 -0.09378 (0.003) (0.108) Trade openness(-1) -0.00325 -5.84236* (0.052) (3.184) Log inflation(-1) -0.00820*** 0.02292 (0.002) (0.124)
Human capital index(-1) 0.04621 -3.31473
(0.118) (6.625) Constant 6.97473*** 52.15080* (0.347) (27.423) Observations 204 220 Countries 33 39 R-squared 0.814 0.396
unemployment by increasing business and enhancing income-generating activities, hence providing opportunities to collect income taxes both on individuals and corporates.
Overall, our results confirm that financial inclusion is conducive to higher tax revenue collection through private consumption and business expansion.
Table 3. Effects of Transmission Channel Variables on Tax Revenue Variable
*, **, and *** denote statistical significance at 10 percent, 5 percent, and 1 percent level, respectively. Robust standard errors are reported in brackets. Note: fixed effects are included
2.3. Robustness Checks
In this section, we undertake three robustness exercises to check the validity of our findings. First, we test the sensitivity of the results from the baseline specification to additional control variables, including the level of education, inflation, the population size, external aid received, domestic financial sector development, remittances inflows and the tax structure.15
A higher level of education is expected to increase tax compliance. Similarly, a large population, a well-functioning financial sector and remittances flows received are positively associated with
15 These variables are considered in the literature as possible determinants of tax revenue (see e.g., Tanzi, 1977,
Gupta et al. 2014, Gordon and Li, 2009, Pessino and Fenochietto, 2010, Clist and Morrissey 2011, Ebeke, 2011, Benedek et al. 2012, Asafu-Adjaye (2014), and Compaore et al., 2020 among others).
Dependent variable: Non-resource tax ratio Tot. Tax Indirect Direct Income Goods & Serv. VAT
(1) (2) (3) (4) (5) (6)
Private consumption_pc (log) 4.47171*** 2.23892*** 2.69600*** 1.93726*** 2.15500*** 1.57607**
(1.061) (0.807) (0.474) (0.610) (0.750) (0.665) Constant -17.83325** -6.19513 -14.90227*** -8.93711* -7.90796 -6.69822 (7.979) (6.065) (3.576) (4.588) (5.649) (4.996) Observations 416 383 364 381 384 326 Countries 37 35 35 36 35 32 R-squared 0.180 0.073 0.272 0.109 0.110 0.133 Unemployment -0.05045* -0.01662 -0.02540 -0.05030** 0.00001 -0.02348* (0.025) (0.021) (0.019) (0.024) (0.018) (0.013) Constant 16.60980***11.10105*** 5.66047*** 6.12380*** 8.85711*** 6.10331*** (0.205) (0.174) (0.156) (0.197) (0.149) (0.107) Observations 443 416 385 416 426 381 Countries 56 55 51 55 56 53 R-squared 0.015 0.003 0.011 0.023 0.000 0.013
Panel [A]: Private consumption
tax ratio, while higher inflation episodes and external assistance are negatively linked to tax collection capacity.
Results are reported in Table 4 and are similar to the baseline findings. The coefficients associated to the population size, financial sector development and tax diversification index are positive and significant (columns [3], [5] and [7], respectively). A large population constitutes a potential for tax collection. In addition, a well-developed financial sector and greater access to credit allow individuals and corporates to finance profitable projects, which in turn favor tax contribution. Having a diversified tax base is associated with greater tax revenue collection. The results also show that inflation harms tax revenue mobilization (column [4]), corroborating the Tanzi effect.
Table 4. Robustness Check: Adding more Control Variables
*, **, and *** denote statistical significance at 10 percent, 5 percent, and 1 percent level, respectively. Standard errors are reported in brackets. Note:: Constant terms, as well as vector X variables are included but not reported for space purpose.
Second, up to now, we used the number of ATMs per 100,000 adults to measure financial inclusion in developing countries. However, financial inclusion is a multifaceted concept which
Dependent variable: Total non-resource tax-to-GDP ratio
(1) (2) (3) (4) (5) (6) (7)
Dep. variable(-1) 0.83851*** 0.85198*** 0.84004*** 0.84156*** 0.92508*** 0.89801*** 0.96098***
(0.065) (0.068) (0.053) (0.066) (0.044) (0.047) (0.049) ATMs /100,000 adults (Log) 0.37651** 0.35622** 0.41247*** 0.37169*** 0.40795*** 0.43021*** 0.67880**
(0.161) (0.163) (0.115) (0.132) (0.140) (0.158) (0.327)
Human capital index 0.26274 0.06969 0.19853 0.00372 -0.34542 -0.34912 -1.07822
(0.565) (0.649) (0.437) (0.569) (0.425) (0.423) (0.704)
Log inflation -0.01366 -0.00528 -0.01874 0.00513 0.01492 0.00361
(0.028) (0.027) (0.032) (0.021) (0.020) (0.034)
Log total population 0.18675* 0.15694 -0.27982 -0.25708 0.13004
(0.107) (0.169) (0.174) (0.184) (0.520)
Log Net ODA received_pc -0.27082* -0.09633 -0.04720 0.07013
(0.148) (0.082) (0.090) (0.277)
Financial markets efficiency 1.56812*** 1.39023** 1.60892**
(0.567) (0.639) (0.753)
Remittances (% GDP) 0.00880 -0.01429
(0.022) (0.029)
Tax diversification 2.17651*
(1.121)
Control variables YES YES YES YES YES YES YES
Nb. of observations 460 454 454 431 431 424 248
Countries 55 55 55 54 54 53 34
AR(1) p-value 0.000 0.000 0.000 0.000 0.000 0.000 0.025
AR(2) p-value 0.930 0.774 0.978 0.743 0.440 0.263 0.866
Hansen OID (p-value ) 0.419 0.183 0.534 0.584 0.370 0.144 0.177
Nb. of instruments 26 26 36 32 35 37 37
encompasses various dimensions (Espinosa-Vega et al., 2020). In addition, the access to banking services widely varies across countries and is changing over time. For instance, developing countries are increasingly shifting from traditional banking toward digital banking and finance with an important use of mobile money. Hence, relying on traditional banking may poorly capture the real state of financial inclusion.16 Furthermore, as stressed in Coulibaly and
Yogo (2019), ATMs as well as bank branches in developing countries may be unevenly distributed within countries and tend to be more often concentrated in large cities (Guerineau and Jacolin, 2014). Hence, people in rural areas will not get access to financial services. Finally, our baseline financial inclusion measure does take into account microfinance institutions (MFIs), credit unions or financial cooperatives which play a pivotal role in providing financial services in developing countries. We, therefore, paid particular attention to these shortcomings by considering several alternative indicators to capture financial access in a more comprehensive way. The results are reported in Appendix 4 and overall, they support those presented in Table 1.
We finally exploit an alternative data source to test the validity of our findings. As mentioned above, several tax data sources have been used in the literature. In this robustness exercise, we use the IMF’s GFS tax database which also provides detailed classification of government’s tax revenues. Appendix 5 of appendices reports the estimation results. The results show that the coefficients associated financial inclusion are positive and strongly significant at the 1 percent level for total tax revenue (column [1]) and some tax subcomponents (columns [3], [4] and [6]). Therefore, our baseline findings remain valid.
3. Conclusion
The present chapter adds to the literature on tax revenue mobilization, by empirically examining the relationship between access to financial services and non-resources tax-to-GDP ratio in developing countries. Relying on the popular system-GMM estimator of Blundell and Bond (1998), this chapter is the first, to the best of our knowledge, to take into account the
16 We point out this point but data scarcity do not allow us include a financial inclusion indicator capturing mobile
inertia in the tax revenue ratio and the possible endogeneity of financial inclusion as well all control variables. Based on a panel data of 62 developing countries over the period 2004-2017, the chapter finds that financial inclusion is positively and significantly associated with non-resources tax revenue. Exploring the effect on the tax structure, the results show that access to financial services has a more sizeable effect on indirect taxes than the rest of total tax subcomponents. The chapter also provides empirical evidence that financial inclusion is inducive to higher tax revenue, mainly through increased private consumption and business expansion. Furthermore, in line with previous evidence, our results show that the level of development as well as the quality of institutions are important determinants of tax ratio and are positively associated with tax revenue performance in developing countries. However, the relationship between the level of overall development turns out to be non-linear, suggesting the existence of a tipping point.
In terms of policy recommendations, our study concurs with previous findings and call for an improved and greater access to financial services. In view of the pressing financing needs to finance structural investments in the developing world, our paper provides insights to countries that have implemented or are in the process of implementing financial inclusion policies, on tax resources harnessing opportunities from better access to financial services. In addition, in the current particular context of coronavirus (Covid-19) pandemic causing severe economic despair across the world and requiring important financial resources for a timely and appropriate response, unlocking access to financial services will help to better cope with the income shock and to smooth households consumption.
Appendices
Appendix 1. Country List
Region Country Region Country
Argentina Albania
Bolivia Armenia
Brazil Azerbaijan
Chile Belarus
Colombia Georgia
Costa Rica Kazakhstan
Dominican Republic Kyrgyz Republic
Ecuador Macedonia El Salvador Moldova Guatemala Montenegro Honduras Russia Mexico Serbia Nicaragua Tajikistan Panama Turkey Paraguay Ukraine Peru Cambodia Uruguay Indonesia Venezuela Malaysia
Central African Republic Mongolia
Madagascar Philippines
Malawi Thailand
Mali Vietnam, Democratic Republic of
Namibia Bangladesh
Niger Bhutan
Nigeria India
Rwanda Pakistan
Senegal Sri Lanka
South Africa Egypt
Togo Iran Uganda Jordan Zambia Tunisia LAC SSA MENA ECA EAP SA
Appendix 2. Descriptive Statistics
Variables Obs. Mean Std. Dev. Min Max
Real GDP_pc 739 4,220 3,529 284.4 14,688
GDP growth (annual %) 739 4.908 4.247 -36.7 34.5 Total natural resources rents (% of GDP) 738 7.327 7.84 0.071 44.56 Population, total 741 3.92E+07 5.44E+07 613,353 2.58E+08 Trade (% of GDP) 738 78.54 34.05 21.45 210.4 Number of credit unions and credit cooperatives 373 4,193 18,916 1 111,797 Depositors with commercial banks 455 1.75E+07 2.73E+07 37,746 1.32E+08 Loan accounts with commercial banks 450 1.46E+07 4.91E+07 1,400 4.67E+08 Outstanding deposits with commercial banks 836 1.61E+08 8.53E+08 170.7 1.10E+10 Number of commercial bank branches/ 100,000 adults 822 13.68 11.66 0.289 71.21 Number of depositors with commercial banks/ 1,000 adults 455 568.5 531.8 7.513 3,380 Number of loan accounts with commercial banks/ 1,000 adults 450 323.9 359.3 0.529 2,909 Automated teller machines (ATMs) /100,000 adults 785 30.95 29.05 0 185.3
GINI index 473 41.33 8.939 24 64.8
Agriculture value added / GDP 852 13.3 8.996 2.089 43.4 Tax-to-GDP ratio 781 15.76 5.674 3.133 36.33 Direct taxes 680 5.208 2.717 0.0182 17.44
Taxes on income 731 5.403 2.8 0 18.01
Taxes on property 601 0.307 0.399 0 1.847 Indirect taxes 749 10.57 4.233 1.619 26.54 Total taxes on goods and services 761 8.319 3.77 0.422 18.91 Value-added tax (VAT) 675 5.326 2.98 0 14.68 Taxes on trade 748 1.749 1.759 0.169 13.13 Debt-to-GDP ratio 711 41.36 22.25 3.89 160.5
Polity2 index 739 4.453 5.202 -10 10
Inflation 742 7.314 7.802 -3.109 121.7
Gross fixed capital formation / GDP 858 25.12 8.071 6.812 69.53 Net ODA received_pc 852 45.88 48.88 -49.54 304.6 Human capital index 616 2.359 0.55 1.137 3.357 Financial markets efficiency 671 0.188 0.283 0 1 Private consumption_pc 430 2,434 1,709 311.5 8,406 Remittances/ GDP 840 5.93 7.208 0.0106 44.13
Unemployment 476 8.049 6.181 0.914 46.03
Tax revenue diversification index 381 0.622 0.276 0.155 1.539 Private credit bureau 374 17.631 17.063 0 54
Appendix 3. Sources and Definitions of Data
Variables Definition Sources
ATMs / 100,000 adults Automated teller machines (ATMs) (per 100,000 adults) Bank branches/ 100,000 adults Number of commercial bank branches per 100,000 adults Loan accounts/ 1000 adults Number of loan accounts with commercial banks per 1,000 adults Depositors/ 1000 adults Number of depositors with commercial banks per 1,000 adults adults Credit unions and cooperatives Number of credit unions and credit cooperatives
Outstanding deposits Outstanding deposits with commercial banks Depositors with CBs Depositors with commercial banks
Loan accounts with CBs Loan accounts with commercial banks Tax-to-GDP ratio Non-resource tax excluding social contributions
Indirect taxes-to-GDP ratio Indirect taxes excluding social contributions and resource revenue Direct taxes-to-GDP ratio Direct taxes excluding social contributions and resource revenue Taxes on income-to-GDP ratio Taxes on income, profits, and capital gains
Taxes on goods-to-GDP ratio Taxes on goods and services, Total Value-added tax-to-GDP Value-added tax
Tax on property-to-GDP Taxes on property
Taxes on trade-to-GDP Taxes on international trade and transactions
Tax diversification index Theil index-based tax revenue diversification index Compaore et al . (2020)
Real GDP_pc Real GDP_pc
Resources rent Total natural resources rents (% of GDP) Trade openness Sum of total imports and exports (% of GDP) Agriculture VA Agriculture value added (% of GDP)
Population Total population
Aid_pc Net official development assistance received per capita (current US$) Remittances Personal remittances, received (% of GDP)
Public investment Gross fixed capital formation (% of GDP) GDP growth GDP growth (annual %)
GINI index GINI index
Private consumption_pc Households and NPISHs Final consumption expenditure per capita Unemployment Unemployment with advanced education (% of total labor force with
advanced education)
Inflation Inflation, average consumer prices World Economic Outlook
(WEO, 2019)
Financial sector efficiency Financial markets efficiency IMF's Financial Development Index Database
Public debt-to-GDP ratio Debt to GDP ratio Ali Abbas et al . (2010)
Human capital index Human capital index Penn World Table (PWT9.1)
Polity2 index Polity2 index Polity4 Project
IMF, FAS 2019 Dataset
ICTD/UNU-WIDER, GRD 2019
World Bank's World Development Indicators
Appendix 4. Robustness Check: Using Alternative Financial Inclusion Variables
*, **, and *** denote statistical significance at 10 percent, 5 percent, and 1 percent level, respectively. Standard errors are reported in brackets.
Dependent variable: Total non-resource tax-to-GDP ratio
(1) (2) (3) (4) (5) (6) (7)
Dep. variable(-1) 0.98195*** 0.91934*** 0.99999*** 0.97207*** 0.96158*** 0.94884*** 0.93131***
(0.026) (0.034) (0.065) (0.039) (0.035) (0.047) (0.039) Bank branches /100,000 adults (Log) 0.39697*
(0.216)
Loan accounts with CBs / 1,000 adults 0.00085**
(0.000)
Depositors with CBs/ 1,000 adults (Log) 0.39437***
(0.130)
Credit unions and credit cooperatives (Log) 0.17861*
(0.094)
Outstanding deposits with CBs (Log) 0.22248**
(0.104)
Depositors with CBs (Log) 0.26622**
(0.130)
Loan accounts with CBs (Log) 0.00000**
(0.000)
Control variables YES YES YES YES YES YES YES
Nb. of observations 585 320 341 282 591 341 320
Countries 61 38 37 31 61 37 38
AR(1) p-value 0.000 0.003 0.000 0.000 0.000 0.000 0.005
AR(2) p-value 0.938 0.277 0.933 0.345 0.726 0.971 0.324
Hansen OID (p-value ) 0.145 0.276 0.308 0.257 0.113 0.334 0.350
Nb. of instruments 34 37 27 30 33 32 27
Appendix 5. Robustness Check: Using Alternative Tax Data Source
*, **, and *** denote statistical significance at 10 percent, 5 percent, and 1 percent level, respectively. Standard errors are reported in brackets.
Dependent variable: Non-resource tax-to-GDP ratio
(1) (2) (3) (4) (5) (6) Tot. Tax Indirect Direct Income Gds & Serv. VAT Dep. variable(-1) 0.93419*** 0.94664*** 0.72407*** 0.55052*** 0.83982*** 0.84138***
(0.054) (0.019) (0.048) (0.073) (0.043) (0.026) ATMs /100,000 adults (Log) 0.57344*** 0.03778 0.09862*** 0.17310** 0.03613 0.09707***
(0.221) (0.038) (0.035) (0.084) (0.069) (0.038) Real GDP_pc 0.00051** 0.00041*** 0.00004 -0.00007 0.00025*** 0.00030***
(0.000) (0.000) (0.000) (0.000) (0.000) (0.000) Squared real GDP_pc (Log) -0.22008** -0.09573*** -0.01931 0.01345 -0.06755** -0.09786***
(0.096) (0.022) (0.035) (0.048) (0.033) (0.017) Total natural resources rents (Log) 0.24967 -0.08976* 0.32007*** 0.41351*** -0.18594** 0.04066 (0.155) (0.047) (0.073) (0.117) (0.079) (0.038) Trade openness 2.61191*** -0.01759 1.55332*** 1.70134*** -0.01693 0.98626***
(0.993) (0.279) (0.511) (0.383) (0.375) (0.274) Agriculture value added -0.15356* -0.01422 -0.06269** -0.05246 -0.03955 -0.05176***
(0.082) (0.014) (0.029) (0.051) (0.034) (0.018) Polity2 index 0.05684** 0.01377 0.02256 0.00114 0.01302 0.03541*** (0.029) (0.009) (0.022) (0.021) (0.014) (0.013) Constant 1.90469 5.33194*** -3.96212 -5.64911 5.34860** 1.76028 (7.966) (1.773) (3.056) (3.996) (2.613) (1.610) Nb. of observations 431 321 320 431 421 411 Countries 52 37 37 52 52 51 AR(1) p-value 0.000 0.003 0.006 0.009 0.000 0.023 AR(2) p-value 0.234 0.213 0.858 0.241 0.370 0.581 Hansen OID (p-value ) 0.121 0.290 0.249 0.766 0.176 0.377
Nb. of instruments 27 32 26 27 27 36