HAL Id: inserm-00765022
https://www.hal.inserm.fr/inserm-00765022
Submitted on 14 Dec 2012
HAL is a multi-disciplinary open access
archive for the deposit and dissemination of
sci-entific research documents, whether they are
pub-lished or not. The documents may come from
teaching and research institutions in France or
abroad, or from public or private research centers.
L’archive ouverte pluridisciplinaire HAL, est
destinée au dépôt et à la diffusion de documents
scientifiques de niveau recherche, publiés ou non,
émanant des établissements d’enseignement et de
recherche français ou étrangers, des laboratoires
publics ou privés.
Laurent Bianchetti, David Kieffer, Rémi Féderkeil, Olivier Poch
To cite this version:
Laurent Bianchetti, David Kieffer, Rémi Féderkeil, Olivier Poch. Increased frequency of single base
substitutions in a population of transcripts expressed in cancer cells.. BMC Cancer, BioMed Central,
2012, 12 (1), pp.509. �10.1186/1471-2407-12-509�. �inserm-00765022�
R E S E A R C H A R T I C L E
Open Access
Increased frequency of single base substitutions
in a population of transcripts expressed
in cancer cells
Laurent Bianchetti
1*, David Kieffer
2, Rémi Féderkeil
3and Olivier Poch
2Abstract
Background: Single Base Substitutions (SBS) that alter transcripts expressed in cancer originate from somatic mutations. However, recent studies report SBS in transcripts that are not supported by the genomic DNA of tumor cells.
Methods: We used sequence based whole genome expression profiling, namely Long-SAGE (L-SAGE) and Tag-seq (a combination of L-SAGE and deep sequencing), and computational methods to identify transcripts with greater SBS frequencies in cancer. Millions of tags produced by 40 healthy and 47 cancer L-SAGE experiments were compared to 1,959 Reference Tags (RT), i.e. tags matching the human genome exactly once. Similarly, tens of millions of tags produced by 7 healthy and 8 cancer Tag-seq experiments were compared to 8,572 RT. For each transcript, SBS frequencies in healthy and cancer cells were statistically tested for equality.
Results: In the L-SAGE and Tag-seq experiments, 372 and 4,289 transcripts respectively, showed greater SBS frequencies in cancer. Increased SBS frequencies could not be attributed to known Single Nucleotide
Polymorphisms (SNP), catalogued somatic mutations or RNA-editing enzymes. Hypothesizing that Single Tags (ST), i. e. tags sequenced only once, were indicators of SBS, we observed that ST proportions were heterogeneously distributed across Embryonic Stem Cells (ESC), healthy differentiated and cancer cells. ESC had the lowest ST proportions, whereas cancer cells had the greatest. Finally, in a series of experiments carried out on a single patient at 1 healthy and 3 consecutive tumor stages, we could show that SBS frequencies increased during cancer
progression.
Conclusion: If the mechanisms generating the base substitutions could be known, increased SBS frequency in transcripts would be a new useful biomarker of cancer. With the reduction of sequencing cost, sequence based whole genome expression profiling could be used to characterize increased SBS frequency in patient’s tumor and aid diagnostic.
Keywords: Cancer, Bioinformatics, Transcripts, Substitutions, ESC, Biomarker, Long-SAGE, Tag-seq, Patient, Genetic integrity
* Correspondence:Laurent. Bianchetti@igbmc.fr
1Plate-forme Bioinformatique de Strasbourg (BIPS), Institut de Génétique et
de Biologie Moléculaire et Cellulaire (CNRS/INSERM/ULP), BP 163, Illkirch, Cedex, 67404, France
Full list of author information is available at the end of the article
© 2012 Bianchetti et al.; licensee BioMed Central Ltd. This is an Open Access article distributed under the terms of the Creative Commons Attribution License (http://creativecommons.org/licenses/by/2.0), which permits unrestricted use, distribution, and reproduction in any medium, provided the original work is properly cited.
Background
In mammalian cells, genetic integrity is maintained by stability genes [1] which are in charge of correct chromosomal segregation and recombination; damaged DNA repair; accurate genomic DNA replication and transcriptional fidelity. In healthy cells, base substitu-tions occur at an extremely low incidence during both DNA replication [2] and RNA synthesis [3]. Single base variations can be the result of Single Nucleotide Poly-morphisms (SNP) [4] or RNA-editing carried out by ADAR [5] or APOBEC [6] enzymes. By contrast, genetic instability is a hallmark of cancer [7,8]. Major mutational events such as chromosome region translocations, dele-tions and gene copy number variadele-tions have been reported in almost all cancer cells [9]. Somatic muta-tions, i.e. acquired or inherited SBS which differentially alter cancer cell genomes and consequently transcript sequences, were reported on a genome wide scale using deep sequencing [10,11]. Now, a census of cancer related somatic mutations that alter 422 human genes has been made available [12]. A growing body of cancer studies reports SBS in transcripts that are not supported by the genome of tumor cells. Using EST alignments on refer-ence mRNA sequrefer-ences, Brulliard M. et al. proved that 15 abundantly expressed transcripts, namely GAPDH, VIM, FTH1, ENO1, HSPA8, TPT1, RPS4X, ATP5A1, FTL, RPL7A, TPI1, RPS6, ALDOA, LDHA and CALM2 had statistically greater SBS frequencies in cancer than in healthy cells whereas ALB and TSMB4X showed the opposite [13]. Since most EST are 3’ fragments of mRNA sequences, increased SBS in cancer was detected at the 3’ boundary of mRNA. These SBS could not be explained by known SNP and were also unlikely the re-sult of somatic mutations or RNA-editing enzymes. The possibility that instruments generated more sequencing errors when EST originated from cancer cells does not seem rational. As a working hypothesis, the concept of transcriptional infidelity (TI) was proposed: i) TI intro-duces non-random base variations in RNA sequences that are not supported by the genome ii) TI exists in both healthy and cancer cells, but is greater in cancer. Increased TI in cancer has been speculated to originate from a defective proofreading activity of RNA poly-merases. Recently, in a study carried out at both gen-omic and transcriptional levels, SRP9 and COG3 mRNA expressed in tumor cells were clearly shown to carry SBS that were conflicting with the genome sequence [14]. SRP9 sequencing chromatogram traces showed an adenine (in tumor DNA) and a guanine (in tumor RNA) substitution which might be attributed to ADAR, in fact ADAR carries out adenosine to inosine editions and in-osine is read as guanin-osine by sequencing instruments. Intriguingly, in the case of COG3, a thymine (in tumor DNA) was replaced by a cytidine (in tumor RNA) which
cannot be carried out by ADAR nor APOBEC enzymes because APOBEC converts cytosine to uracile in RNA sequences. Personalized omics profiling also concurred on the fact that RNA-editing is extensively carried out in peripheral blood mononuclear cells with more than 2300 target sites and approximately 50% of them were not typical ADAR or APOBEC edits [15]. Deregulation of RNA-editing, e.g. adenosine to inosine hypoediting, was also reported in tumors [16]. To identify mRNA with greater SBS frequencies in cancer, we performed a bioinformatics analysis of 7.6 million tags produced by 87 human L-SAGE [17] experiments (a molecular biol-ogy method using Sanger sequencing), and 67.8 million tags generated by 15 human Tag-seq experiments (a combination of L-SAGE and deep sequencing) [18,19]. Both L-SAGE and Tag-seq generate short sequences that are likely localized on the 3’ boundary of transcripts. Therefore, L-SAGE and Tag-seq may prove useful to de-tect SBS introduced in the 3’ boundary of transcripts. Briefly, tags are short sequences of 17 bases which are signatures of 3' polyadenylated transcripts expressed in cells. The most 3’ NlaIII “CATG” motif in the transcript sequence is directly followed by the 17 base tag. More-over, tag counts and mRNA expression levels are corre-lated. Comparing tags to RT sequences, i.e. tags matching the human genome exactly once, we showed that a plethora of transcripts had greater SBS frequen-cies in cancer cells. Although the genomic sequences of the tumor and the healthy cells were not simultaneously available in our study, these SBS could not be attributed to known SNP, catalogued cancer related somatic muta-tions, and known APOBEC1 or ADAR editing. ST pro-portions, i.e. proportions of tags sequenced only once were calculated for each experiment and were used as an indicator of SBS frequency. Interestingly, among healthy cells, ESC had the lowest ST proportions which might indicate that transcriptional fidelity could be increased in ESC. Conversely, the greatest ST propor-tions were observed in cancer cells. Finally, focusing on a series of 4 L-SAGE experiments carried out on the biopsies of a single patient at 1 healthy and 3 conse-cutive tumor stages, we were able to demonstrate that SBS frequencies significantly increased during cancer progression.
Methods
L-SAGE and Tag-seq experiments
The GPL1485 platform of the NCBI Gene Expression Omnibus (GEO) server is a repository of L-SAGE and Tag-seq experiments carried out on human cells. In the GPL1485, the GSE1902 (L-SAGE) and GSE15314 (Tag-seq) series of experiments were selected. All experiments were carried out using the NlaIII anchoring enzyme which cuts 3’ polyadenylated transcripts at CATG sites.
Experiments were separated into 2 groups, namely healthy and cancer using a dictionary of cancer related terms: adenocarcinoma, cancer, carcinoma, dysplasia, fibroadenoma, glioblastoma, leukemia, lymphoma, me-dulloblastoma, melanoma, tumor, retinoblastoma and rhabdomyosarcoma. The Sybase system was used to store the tags of L-SAGE and Tag-seq experiments. Programs were run on a 6 × 4 Sun AMD Opteron processors (2.6 GHz) under the linux operating system.
Reference tags (RT)
RT were selected among the tags produced by the L-SAGE and Tag-seq experiments. Tags should fulfill 2 criteria to be selected i) presence in at least 75% of L-SAGE or 90% of Tag-seq experiments ii) exactly one match on the human genome sequence. Tags that ful-filled the first criteria were selected using a JAVA pro-gram and were subsequently aligned on the human genome using a blastn tool. Two distinct lists of RT were thus created, 1 for the L-SAGE and 1 for the Tag-seq experiments.
Single base substituted RT (sbsRT)
For each RT, and for each of the 17 base positions, a nu-cleotide was replaced by a "_" metacharacter. Thus, 17 distinct patterns were generated (Additional file 1). A Java program was written to automatically i) generate the 17 distinct patterns ii) retrieve from the database of L-SAGE and Tag-seq experiments all the tags that matched the patterns and iii) sum the tag counts. The risk that a sbsRT could match by chance a RT was calculated (Additional file 2) and equaled 6.5 × 10⁻⁵. Thus, any tag that was iden-tical to a RT except at 1 base position, was very likely the result of a SBS that had occurred in this RT.
Testing for SBS frequency equality in transcripts expressed in healthy and cancer cells
Let C and H be the number of cancer and healthy L-SAGE experiments (or Tag-seq experiments). For each RT, 4 sum of counts (Sc) were calculated (i, ii, iii and iv):
i. Sum of counts of the RT across all healthy experiments Sc _ H _ RT =Pk= 1
H
RT count in exp. k ii. Sum of counts of the RT across all cancer
experiments Sc _ C _ RT =PkC= 1RT count in exp. k iii. Sum of counts of sbsRT (associated with the RT)
across all healthy experiments Sc _ H _ sbsRT = P
k= 1
H P
i51= 1sbsRTi count
iv. Sum of counts of sbsRT (associated with the RT) across all cancer experiments Sc _ H _ sbsRT = P
k= 1
H P
i51= 1sbsRTicount
Then, for each RT, 2 sbsRT proportions were calcu-lated (i, ii):
i) sbsRT proportion across all healthy experiments sbsRT prop H ¼ Sc H sbsRT
Sc H RTþSc H sbsRT
ii) sbsRT proportion across all cancer experiments sbsRT prop C ¼Sc C RTþSc C sbsRTSc C sbsRT
Finally, for each RT, two 1-side Pearson’s chi-squared proportion tests (i, ii) were carried out using a 0.025 α type I error
i) Pearson’s chi-squared proportion test (Cancer > Healthy):
H0: "sbsRT_prop_C equals sbsRT_prop_H"
H1: "sbsRT_prop_C is greater than sbsRT_prop_H" ii) Pearson’s chi-squared proportion test (Healthy >
Cancer)
H0: "sbsRT_prop_C equals sbsRT prop_H"
H1: "sbsRT_prop_H is greater than sbsRT_prop_C"
A script was written in the R environment to carry out the Pearson’s chi-squared proportion tests. For a RT, and thus a transcript, the Hohypothesis was rejected when a
p-value less than 0.025 was obtained. Three lists of RT were thus produced according to the decision of the Pearson’s chi-squared proportion test i) RT for which proportions of sbsRT were greater in cancer than in healthy, ii) RT for which proportions of sbsRT were greater in healthy than in cancer iii) RT for which pro-portions of sbsRT in cancer and healthy were not signifi-cantly different.
Global proportions of sbsRT
Global proportions were calculated for selected experi-ments. Across a set of experiments (e. g. same healthy tissue), RT that were present in 100% of the experiments were selected. Let N be the number of RT that were present in all experiments. The sum of RT counts and the sum of their associated sbsRT counts were calcu-lated. Finally a global proportion of sbsRT across the set of experiments was computed as follows:
global sbsRT proportion ¼ XN 1sbsRT counts XN 1RT counts þ XN 1sbsRT counts
Global sbsRT proportions were tested for equality across different healthy tissues using the Analysis of Variance (Anova).
Single tags (ST)
ST are tags that were sequenced only 1 in a L-SAGE ex-periment, i.e. ST were associated with a count of 1. For
each L-SAGE experiment, a list of ST could thus be defined and the proportion of ST on total tags could be calculated. ST was not reported in Tag-seq experiments. In fact, counts were greater than 1 which showed that ST had been discarded from Tag-seq experiments.
ST proportions
For each L-SAGE experiment, the proportion of ST was calculated:
ST proportion ¼ n total tags
where n is the number of ST and total_tags is the sum of counts.
Known SNP that altered 17 base NlaIII tags of transcripts
A file of 17 base NlaIII tags associated with known SNP was provided by Dr. Anamaria Camargo. In this file, each line recorded a Genbank mRNA accession number, the NlaIII 17 base tag associated with the mRNA and the sequence of the tag with the known SNP. The file contained 4,697 entries. It was thus possible to identify sbsRT that were the result of known SNP.
Census of genes with cancer related somatic mutations
A census of somatically mutated genes in cancer was downloaded from the COSMIC database (v56). Known somatic mutations were recorded for 422 distinct genes which were identified by NCBI Gene ID. In our study, transcripts were identified with Genbank or RefSeq ID and thus were converted to NCBI gene ID using the Synergizer tool [20]. Area proportional Venn diagrams were drawn to determine whether known somatically mutated genes were present among the genes with greater SBS frequencies. Bases that were somatically mutated in cancer and recorded by COSMIC were loca-lized on transcript sequences and their proximity or in-clusion to the 17 base NlaIII tag was determined.
Validated and predicted APOBEC1 and ADAR RNA-editing targets
APOBEC1 RNA-editing targets. A series of 32 editing sites in 30 distinct transcripts are known substrates for the Apoliprotein B-editing enzyme, catalytic polypeptide-1 (APOBEC1) in mouse. Using an APOBEC1 specific edit-ing sequence pattern, namely WCWN2-4WRAUYANUAU
(mooring sequence), which is located directly 3’ to the edi-ted cytosine, Rosenberg B. R. et al. predicedi-ted 376 editing sites in 363 distinct mouse transcripts. Out of these 363 transcripts, ten were previously experimentally validated, in particular, the prototypic ApoB editing site. Thus 383 distinct mouse transcripts either predicted or validated APOBEC1 RNA-editing targets are available. However,
our study was carried out on human sequences. There-fore, conservation of RNA-editing targets between human and mouse organisms was hypothesized. Human ortholo-gues of mouse RNA-editing targets were retrieved from RefSeq by sequence similarity searches using blastn. Top scoring human transcripts were assumed to be ortholo-gues of mouse transcripts targeted by the APOBEC1. RefSeq ID were then converted to NCBI gene ID with the Synergizer tool. A list of 361 unique NCBI gene ID was thus produced for the human transcripts. Venn diagrams were drawn to identify human transcripts which could be APOBEC1 RNA-editing targets and showing greater SBS frequencies in cancer or healthy cells. These transcripts were compared with the mouse orthologues to determine the local level of similarity between mouse and human mooring sequences. Pairwise sequence comparison was carried out using the Smith and Waterman local algo-rithm implemented in the water program of the EMBOSS package (gap opening penalty 10, gap extension penalty 0.5, EDNAFULL matrix). When the mooring sequences were conserved between mouse and human, the 17 base NlaIIItag was localized on the human transcript. Finally, proximity between the 17 base NlaIII tag and the mooring sequence was determined and the possibility that the 17 base NlaIII tag could be edited by the APOBEC1 enzyme was assessed.
ADAR RNA-editing targets. Most A-to-I susbstitu-tions occur within interspersed repetitive elements mainly in Alu sequences. Since RT match the human genome exactly once, they are very unlikely located in Alu repeats. Therefore, sbsRT may not be the result of ADAR RNA-editing.
Results
Groups of healthy and cancer experiments
87 L-SAGE and 15 Tag-seq experiments were selected on the NCBI Gene Expression Omnibus (GEO) reposi-tory [21]. L-SAGE experiments were grouped into 40 healthy and 47 cancers. Sixteen different tissues or cell types were represented (Additional file 3). Tag-seq experiments were grouped into 7 healthy and 8 cancers. All selected Tag-seq experiments originated from skin or foreskin biopsies. Since the total number of tags pro-duced by L-SAGE and Tag-seq experiments were dra-matically different and because the sequencing error rates of Sanger and deep sequencing methods may be unequal, L-SAGE and Tag-seq tags were processed using the same bioinformatics workflow but separately (Figure 1).
Reference Tags (RT)
2,930 tags were present in at least 75% of the 40 healthy and at least 75% of the 47 cancer L-SAGE experiments. Among these 2,930 tags, 1,966 matched
the human genome sequence exactly once. Seven tags had a sequence composition bias and were discarded. Thus, 1,959 distinct tags were selected as RT (= L-SAGE list of RT). 11,967 tags were present in at least 90% of the 7 healthy and at least 90% of the 8 cancer Tag-seq experiments. Among these 11,967 tags, 8,806 matched the human genome sequence exactly once, 234 were discarded because of sequence composition bias and 8,572 distinct tags were selected as RT (=Tag-seq list of RT). 1,878 tags were common to both L-SAGE and Tag-seq lists of RT. In theory, a RT can generate 51 (= 3 × 17) possible distinct sequences by SBS, therefore each RT may be asso-ciated with 51 sbsRT. For each RT, the frequencies of sbsRT in both cancer and healthy cells were calcu-lated. COG3 (alias SEC34) and SRP9 3’ polyadeny-lated transcripts were recorded in genbank with AF332595 and EF488978 accession numbers respect-ively. The 17 base NlaIII tags of SRP9 and COG3 transcripts were determined using genbank sequence records. However, SRP9 and COG3 17 base NlaIII tags were not present among the L-SAGE and Tag-seq lists of RT. Conversely, GAPDH, VIM, ENO1, HSPA8, TPT1, ATP5A1, FTL, TPI1, ALDOA and
LDHA 17 base NlaIII tags were present among the L-SAGE or Tag-seq lists of RT.
Increased SBS frequencies in transcripts expressed in cancer cells
For each of the 1,959 RT that were selected using L-SAGE experiments, sbsRT proportions in cancer and healthy cells were tested for equality (Ho) against the
al-ternative hypothesis that sbsRT proportions were greater in cancer cells (H1): Howas rejected for 529 out of 1,959
RT by multiple 1-side Pearson’s chi-squared proportion tests with α/2 = 0.025 risk of type I error. A Benjamini-Hochberg False Discovery Rate (FDR) was applied and 372 out of 529 RT passed FDR at 2.5%. As a result, 372 RT (19% of 1,959) showed significantly greater SBS in cancer than in healthy cells (Additional file 4). The same Ho was tested against the alternative hypothesis that
sbsRT proportions were greater in healthy cells (H1): Ho
was rejected for 66 RT by multiple 1-side Pearson’s chi-squared proportion tests with α/2 = 0.025 and 17 RT passed FDR at 2.5%, i.e. ~0.9% of 1,959. No difference between cancer and healthy cells was detected for 1,570 RT (80%). RT were associated with transcripts using the Sagettarius tool [22]. Among the RT with top ranking
tags with unique match
on the human genome
87 L-SAGE and 15 Tag-seq experiments
healthy
tags present in most
healthy and cancer
experiments
4)
cancer
1)
2)
RT
3)
sbsRT RT+sbsRT in healthy sbsRT RT+sbsRT in cancer7)
5)
6)
tag with known SNP8)
=
prop. test
Collect of sbsRT in both healthy and cancer
H
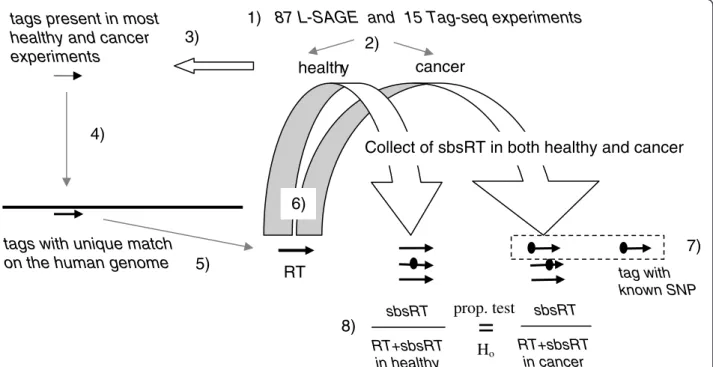
oFigure 1 Bioinformatics workflow. 1) L-SAGE and Tag-seq experiments were processed separately 2) Experiments were divided in 2 groups, namely healthy and cancer 3) tags (thin black arrow) present in at least k% of healthy and at least k% of cancer experiments (k = 75% for L-SAGE and k = 90% for Tag-seq) were selected 4) The tags 5' boundaries were extended with the CATG (NlaIII) motif generating 4 + 17 = 21 base sequences and aligned on the human genome (long and thick black line) using blastn 5) tags matching the human genome exactly once were selected as RT (thick black arrow) 6) For each RT, sbsRT (thick black arrows carrying an ellipse) were searched among all the tags and were collected with their counts. 7) sbsRT matching a known SNP were excluded from SBS accounting (discontinuous rectangle) 8) For each RT, i.e. for each transcript, 2 proportions of sbsRT were calculated, i.e. 1 in healthy and 1 in cancer. Finally, both proportions were statistically tested for equality.
SBS frequencies in cancer, GAPDH and TPI1 were present, i.e. 2 mRNA that had been previously reported by Brulliard M. et al. using EST aligned on reference transcripts. Interestingly, no somatic mutation was recorded in the COSMIC database [23] for both genes, indicating that SBS observed at the transcript level were not supported by any known base variation at the gen-ome level. Since known SNP occurring in NlaIII tags [24] were excluded from sbsRT accounting, SNP could not support the increased SBS frequency in cancer. Fur-ther transcripts identified by the EST study, namely ATP5A1, TPT1, LDHA and ENO1 were also present among the 372 RT. In conclusion, 6 mRNA out of the 15 identified by Brulliard M. et al. were confirmed (Table 1). SBS frequencies were calculated for each of the 8,572 RT selected using the Tag-seq experiments. SBS frequencies in healthy and cancer cells were tested for equality (Ho) against the alternative hypothesis that
sbsRT proportions were greater in cancer (H1): Ho was
rejected by multiple 1-side Pearson’s chi-squared propor-tion tests with a α/2 = 0.025 for 4,465 RT. 4,289 RT passed FDR at 2.5%. As a result, 4,289 RT (50% of 8,572) showed significantly greater SBS in cancer than in healthy cells (Additional file 5). The same Howas tested
against the alternative hypothesis that sbsRT proportions were greater in healthy cells (H1): Ho was rejected for
1,417 RT by multiple 1-side Pearson’s chi-squared pro-portion tests with a α/2 = 0.025, 1,123 RT passed FDR at 2.5% (13%). For 3,160 RT (37%), no difference was observed between healthy and cancer cells. Using Tag-seq experiments, the list of RT showing greater SBS fre-quencies in cancer was 11.5 times longer than the list produced by L-SAGE experiments. Thus, both L-SAGE and Tag-seq experiments concurred with the notion that
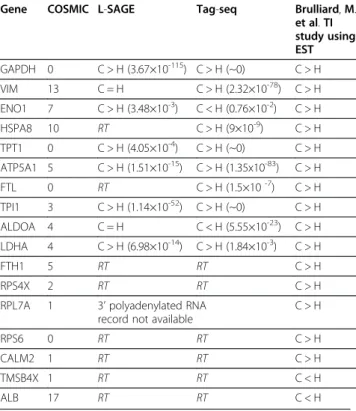
Table 1 Testing SBS frequency equality in healthy (H) and cancer (C) cells for the 17 mRNA selected by Brulliard, M. et al. (2007)
Gene COSMIC L-SAGE Tag-seq Brulliard, M. et al. TI study using EST GAPDH 0 C > H (3.67×10-115) C > H (~0) C > H VIM 13 C = H C > H (2.32×10-78) C > H ENO1 7 C > H (3.48×10⁻³) C < H (0.76×10⁻²) C > H HSPA8 10 RT C > H (9×10⁻⁹) C > H TPT1 0 C > H (4.05×10⁻⁴) C > H (~0) C > H ATP5A1 5 C > H (1.51×10⁻¹⁵) C > H (1.35x10-83) C > H FTL 0 RT C > H (1.5×10⁻⁷) C > H TPI1 3 C > H (1.14×10-52) C > H (~0) C > H ALDOA 4 C = H C < H (5.55×10⁻²³) C > H LDHA 4 C > H (6.98×10⁻¹⁴) C > H (1.84×10⁻³) C > H FTH1 5 RT RT C > H RPS4X 2 RT RT C > H
RPL7A 1 3’ polyadenylated RNA record not available
C > H
RPS6 0 RT RT C > H
CALM2 1 RT RT C > H
TMSB4X 1 RT RT C < H
ALB 17 RT RT C < H
C > H: greater SBS frequency in cancer. C < H: greater SBS frequency in healthy. C = N: SBS frequencies are not significantly different between H and C. RT: the 17 base NlaIII tag associated with this transcript was not present in either L-SAGE or Tag-seq lists of RT and therefore equality between SBS frequencies in H and C could not be tested. COSMIC: number of cancer related somatic mutations recorded by the COSMIC database. 3’ polyadenylated RNA record not available: the sequence recorded in RefSeq-rna does not have a 3’ polyadenylated boundary, therefore NlaIII tag cannot be determined.
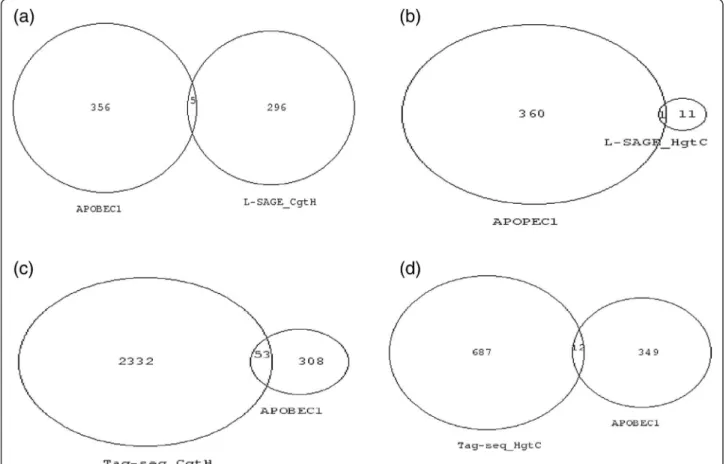
Figure 2 Venn diagrams of transcripts with greater SBS frequencies and genes with cancer somatic mutations. Numbers represent NCBI gene ID. Venn diagram areas are proportional to gene ID numbers. (a) Left circle = COSMIC (v56) census of 422 somatically mutated genes in cancer, right circle = transcripts with greater SBS frequencies in cancer than in healthy cells in L-SAGE experiments. Nine transcripts were common to both lists. For each of these 9 transcripts, no known cancer-related somatic mutations altered the 17 base NlaIII tag. (b) Right circle = COSMIC (v56) census of 422 somatically mutated genes in cancer. Left circle = transcripts with greater SBS frequencies in cancer than in healthy cells in Tag-seq experiments. Sixty eight transcripts were common to both lists. For each of these 68 transcripts, no known cancer related somatic mutations altered the 17 base NlaIII tag.
a population of transcripts had more SBS in cancer than in healthy cells. Nine out of the 15 transcripts identified by the EST study were confirmed by the Tag-seq experi-ments (Table 1).
Known cancer somatic mutations do not support increased SBS frequencies in mRNA
A census of 422 genes that are somatically mutated in cancer has been made available by the COSMIC data-base. Venn diagrams were drawn between the census of somatically mutated genes and the transcripts that had greater SBS in cancer than in healthy cells using L-SAGE (Figure 2a) and Tag-seq (Figure 2b) experi-ments. Nine genes were common to the census and L-SAGE transcripts and 68 were common to the census and the Tag-seq transcripts. We thoroughly checked whether known somatic mutations altered the 17 base NlaIII tag for each of the 9 (Additional file 6) and 68 (Additional file 7) genes. The 17 base NlaIII tag was gen-erally located in the vicinity of the transcript 3’ polyade-nylated boundary, i.e. in the 3’ UTR. For a majority of
genes, the most 3’ known somatic mutation altered the coding sequence of the gene and was thus 5’ to the 17 base NlaIII tag. No known somatic mutation altered the 17 base NlaIII tags. Therefore, the increased SBS fre-quencies that were observed in transcripts expressed in cancer cells could not be attributed to known somatic mutations.
APOBEC1 or ADAR RNA-editing do not support increased SBS frequencies
Rosenberg B.R. et al. published a list of 32 experimen-tally validated APOBEC1 mRNA-editing sites in 30 dis-tinct mouse transcripts. Comparing the transcript sequences surrounding the C to U edition position, a mooring pattern, i.e. WCWN2-4WRAUYANUAU, had
been defined. Moreover, the RNA-editing site occurs in a 16 base region directly 5’ to the mooring sequence. Rosenberg B.R. et al. used the mooring pattern to predict additional transcripts that could be edited by APOBEC1. Finally, a list of 383 transcripts (=361 NCBI gene ID after synergizer conversion) was proposed as either
Figure 3 Venn diagrams of transcripts with greater SBS frequencies and APOBEC1 RNA-editing targets. Numbers represent NCBI gene ID. Venn diagram areas are proportional to gene ID numbers. (a) Left circle = APOBEC1 RNA-editing targets, right circle = transcripts with greater SBS frequencies in cancer cells in L-SAGE experiments. (b) Left circle = APOBEC1 RNA-editing targets, right circle = transcripts with greater SBS frequencies in healthy cells in L-SAGE experiments. (c) Right circle = APOBEC1 RNA-editing targets, left circle = transcripts with greater SBS frequencies in cancer cells in Tag-seq experiments. (d) Right circle = APOBEC1 RNA-editing targets, left circle = transcripts with greater SBS frequencies in healthy cells in Tag-seq experiments.
experimentally validated or predicted targets of APO-BEC1. We crossed this APOBEC1 list of RNA-editing targets with the 372 transcripts (=301 NCBI gene ID after synergizer conversion) that showed greater SBS fre-quencies in cancer than in healthy cells using L-SAGE experiments. Five transcripts were common to both lists (Figure 3a). For each of the 5 transcripts, the positions of the 17 base NlaIII tag and the mooring sequence were determined. None of the 17 base NlaIII tags could be potentially edited by APOBEC1 because the mooring se-quence and the tag were distant from each other in the transcript sequence (Additional file 8). The beta-2 microglobulin was the only transcript common to both APOBEC1 RNA-editing targets and transcripts with greater SBS in healthy than cancer cells (Figure 3b). However, the mooring sequence was not conserved be-tween mouse and human beta-2 microglobulin tran-scripts. Using Tag-seq, 53 transcripts that had greater SBS in cancer were present among APOBEC1 RNA-editing targets (Figure 3c), and 8 of them had been experimentally validated. However, none of these 8 tran-scripts had a 17 base NlaIII tag that overlapped the APOBEC1 editing site (Additional file 9). Finally, for transcripts with greater SBS in healthy than cancer obtained using Tag-seq, only 1, namely FARSB, had a 17 base NlaIII tag that overlapped the APOBEC-1 RNA-editing site. We thus cannot exclude that increased SBS frequency observed for FARSB could be the result of an APOBEC1 edition. Adenosine to inosine conversions carried out by the ADAR family of RNA-editing enzymes occur in non-coding repetitive sequences, mostly Alu elements. Alu sequences are dispersed along the genome and can also be integrated in mRNA. Since RT mono-localize on the genome, they cannot match Alu sequences, which excludes that increased SBS frequen-cies that were observed in transcripts expressed in can-cer or healthy could originate from ADAR editions.
Wide range of molecular functions potentially affected by increased SBS frequencies
For L-SAGE, 1,879 (96%) RT out of 1,959 could be asso-ciated with a transcript (=L-SAGE background list). 355 RT out of the 372 that showed greater SBS frequencies in cancer (=L-SAGE query list) associated with a transcript. GO analysis using DAVID [25] determined that the “Translation” biological process was over-represented among the 355 transcripts (p-value = 6×10⁻⁷, Benjamini-Hochberg = 10-3). The “Ribosome” cellular localization was also enriched (p-value = 1.8×10⁻⁵, Benjamini-Hochberg = 5.7×10⁻³). For Tag-seq experi-ments, 7,830 (91%) RT out of 8,572 were mapped to a transcript (=Tag-seq background list). Among the 4,289 RT that showed greater SBS in cancer, 3,953 could be associated with a transcript (=Tag-seq query list n°1).
1,053 (94%) out of the 1,123 RT that showed greater SBS in healthy cells associated with a transcript (=Tag-seq query list n°2). However, no GO term enrichment was present in both Tag-seq query lists. As a result, many dif-ferent biological processes or molecular functions could be potentially represented among transcripts with greater SBS in cancer.
Increased diversity of SBS in transcripts expressed in cancer cells
The diversity of sbsRT sequences was not studied using L-SAGE experiments because the sums of total tags in healthy (4.7 million) and cancer (2.9 million) were unba-lanced. By contrast, in the Tag-seq experiments, the sums of total tags counts in healthy and cancer cells were quite balanced, i.e. 33.4 and 34.4 million (+3%), respectively. For each of the 8,572 RT, the number of distinct sbsRT sequences i) in healthy and ii) in cancer was determined. In healthy and cancer, the 8,572 RT generated 60,854 and 76,967 (+26%) distinct sbsRT sequences, respectively. Thus, sbsRT diversity was greater in cancer and this could not be explained by the +3% difference in the sums of total tags counts. The 8,572 RT were separated into groups according to the number of distinct sbsRT observed in cancer or healthy cells, i.e. the ithgroup con-tained the RT for which exactly i distinct sbsRT were observed. All RT associated with 0 to 44 distinct sbsRT sequences. Maximal diversity of 51 distinct sbsRT was never observed for any RT. In experiments carried out in healthy and cancer cells, 825 and 356 RT were associated
0 100 200 300 400 500 600 700 800 900 0 1 2 3 4 5 6 7 8 9 10 11 12 13 14 15 16 17 18 19 20 21 22 23 24 25 26 27 28 29 30
Number of RT per sbsRT diversity group
Number of distinct sbsRT sequences
Figure 4 Diversity of sbsRT in healthy and cancer cells. SBS were tracked for 8,572 RT in 7 healthy (circles) and 8 cancer (triangles) Tag-seq experiments. The 8,572 RT were distributed into sequence diversity groups according to the number of distinct sbsRT sequences. For example, group 0, i.e. RT for which 0 sbsRT were observed, contained approximately 350 RT in cancer and slightly more than 800 RT in healthy cells. RT associated with more than 30 distinct sbsRT were rare.
with 0 sbsRT, respectively (Figure 4). 5,281 and 4,048 RT had 8 or less distinct sbsRT sequences in healthy and cancer, respectively. Conversely, 3,291 and 4,524 RT had more than 8 sbsRT in healthy and cancer respectively. RT seemed thus heterogeneously distributed between cancer and healthy cells when analyzing sbsRT diversity (χ2 test at α = 5%, p-value < 2.2 x 10⁻¹⁶). We concluded that i) cancer introduced heterogeneity in sbsRT diversity ii) sbsRT diversity was greater in cancer.
Heterogeneity of ST proportions across healthy and cancer cells
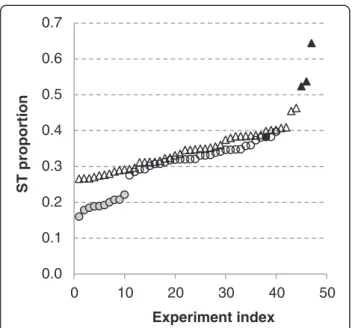
ST were not reported in Tag-seq experiments on GEO records. In fact, tags counts were greater or equal than 2. Conversely, ST were reported in L-SAGE. First, ST proportions were calculated for each of the 87 L-SAGE experiments. Second, these proportions were sorted in ascending order (Figure 5). Most experiments had ST proportions in the range of 0.25 to 0.42. However, a group of 10 experiments carried out in healthy cells, namely ESC, showed ST proportions that were lower than any other (~0.2). Furthermore, the greatest ST pro-portions were observed in cancer cells. Interestingly, within a series of 4 L-SAGE experiments carried out on the biopsies of a single patient at 1 healthy and 3 disease stages, the ST proportions were greater in cancer cells than in healthy cells.
0.0 0.1 0.2 0.3 0.4 0.5 0.6 0.7 0 10 20 30 40 50 S T proporti o n Experiment index
Figure 5 ST proportions calculated for each L-SAGE experiment. Each symbol represents 1 experiment: 47 cancer (triangles) and 40 healthy (circles), circles filled with gray = ESC, triangles filled with black = L-SAGE experiments carried out on the tumor cells of a single patient, circle filled with black = L-SAGE experiment carried out on the healthy cells of the same patient. Experiments were sorted in ascending ST proportion order.
Figure 6 Distribution of ST proportions and global sbsRT proportions in 3 distinct healthy tissues. 32 L-SAGE experiments were used, namely "Breast" (12 experiments), "ESC" (10 experiments) and "White Blood Cells" (WBC) (10 experiments). For each experiment, the (a) ST proportion and the (b) global sbsRT proportion were calculated. 583 RT were used for Breast, 1.478 for ESC, and 860 for WBC to calculate the global sbsRT proportion, respectively.
Lowest ST proportions in transcripts expressed in ESC
Remarkably, ESC had ST proportions ranging between 0.15 and 0.23. To test the significance of this difference, experiments carried out in most represented healthy tissues were separated into 3 groups, namely breast (12 experi-ments), White Blood Cells (WBC) (10 experiments) and ESC (10 experiments). For breast, WBC and ESC, the me-dian of ST proportions were 0.33, 0.31 and 0.19, respect-ively (Figure 6a). A one way-Analysis of variance (Anova) with the "cell type" factor at 3 modalities (breast, WBC, ESC,) was carried out. A mathematical transformation was applied to the proportions, i.e. the arcsin(square root(ST proportion)). The transformed proportions were considered independent since the experiments were carried out on dif-ferent cell types (Anova 1stcondition). A Shapiro-Wilk test was applied to check the distribution normality of the transformed proportions for each of the 3 cell types (breast: p-value = 0.8978; WBC: p-value = 0.6676; ESC: p-value = 0.9206), the hypothesis of "normal distribution" were thus accepted (Anova 2ndcondition). The hypothesis of variance equality between breast, ESC and WBC was accepted using the Bartlett test (Anova 3rdcondition) (p-value = 0.88). Fi-nally, the equality of ST transformed proportion means across the 3 cell types was rejected (p-value = 1.47 x 10⁻¹⁵). This showed that at least one cell type, obviously ESC, had a ST proportion significantly different than breast and WBC.
Lowest SBS frequency in transcripts expressed in ESC
1,748; 583; and 860 RT out of the 1,959 that were selected in the L-SAGE experiments were present in 100% of the 10 ESC, 100% of the 12 breast and 100% of the 10 WBC experiments, respectively. For each experi-ment, a global sbsRT proportion was calculated and the means were determined, i.e. 0.14 (breast), 0.15 (WBC) and 0.058 (ESC) (Figure 6b). ESC had thus the lowest mean. We tested the significance of the differences be-tween global sbsRT proportion means across the 3 cell types. The hypothesis of normal distributions for the transformed global proportions calculated on breast, WBC and ESC were accepted with a Shapiro-Wilk test (p-value = 0.30, 0.79 and 0.22 respectively). However, the equality of variance was rejected by a Bartlett test (p-value = 0.005). A non-parametric Kruskal-Wallis test rejected the equality between the transformed global sbsRT proportion means in breast, WBC and ESC with a 5.4 x 10⁻⁵ p-value. This showed that ESC had a SBS frequency in transcripts that was significantly different from the other two cell types.
ST proportions and SBS frequencies correlate and increase during cancer progression
In the previously mentioned series of 4 L-SAGE experi-ments carried out on the biopsies of a single patient, 1
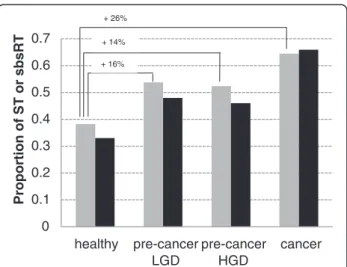
healthy and 3 consecutive tumor stages, i.e. Low-Grade Dysplasia (LGD), High-Grade Dysplasia (HGD) and Adenocarcinoma (AC), were recorded [26]. The sums of total tags counts for each 4 experiments were balanced (mean = 75,735 tags, standard deviation = 2,061 tags). In these 4 experiments, the ST proportions dramatically increased from 0.38 (healthy) to ~0,52 (LGD, HGD) and 0.64 (AC) (Figure 7). Of particular note, the percent of ST that could not be associated with any transcript also increased from 83% in healthy to 87% in both LGD and HGD, and 92% in AC. In the 4 experiments, 2,271 tags were co-present and among them 1,435 belonged to the list of the 1,959 L-SAGE RT. A global sbsRT proportion was calculated for each experiment using the co-present RT. Global sbsRT proportions increased from 0.33 in healthy, to ~0.47 (LGD, HGD) and 0.66 in AC, showing that SBS frequencies was increasing with the tumor stage. Since SBS occurring in RT is a possible cause of tag with transcript association failure, this may explain why the percent of unassociated ST increased from healthy to AC. No significant difference was observed between LGD and HGD suggesting that these pheno-types were not related to an increase of SBS in mRNA sequences. The Pearson's coefficient calculated between the ST and global sbsRT proportions on the 4 experi-ments showed a strong correlation (0.98). ST proportion seemed thus to be an accurate indicator of SBS fre-quency in transcripts. 0 0.1 0.2 0.3 0.4 0.5 0.6 0.7 healthy pre-cancer LGD pre-cancer HGD cancer Proportion of ST o r sbsRT + 26% + 14% + 16%
Figure 7 Single patient personalized monitoring of ST and global sbsRT proportions during disease progression. ST and global sbsRT proportions were calculated for 4 L-SAGE experiments carried out on the biopsies of a single patient at 1 healthy and 3 consecutive tumor stages. Gray bars = ST proportions, black bars = global sbsRT proportions. Low-grade dysplasia (LGD), High-grade dysplasia (HGD) and adenocarcinoma (cancer). The global sbsRT proportions were calculated using 1.435 RT present in all 4 experiments. Significance of ST proportion differences between healthy, LGD, HGD and adenocarcinoma was calculated using the Pearson’s chi-squared proportion test (p-value < 2.2 x 10⁻¹⁶).
Discussion
In the present study, we provide evidence for an increased frequency of SBS that occur in a population of transcripts expressed in cancer cells. Known SNP, catalo-gued cancer related somatic mutations and predicted or validated targets of RNA-editing enzymes did not sup-port the increased SBS frequency in cancer. However, the transcripts but not the genome of healthy and tumors cells were available and thus transcript and gen-ome sequences both originating from the same patient could not be directly compared. To fully confirm that increased base conflicts exist between transcript and genome sequences in patient’s tumors, back-to-back exome sequencing and RNA-seq would be required. Using Tag-seq, 1,123 RT had greater SBS in healthy than in cancer cells, therefore questioning the reliability of this result. In fact, ST had been removed from Tag-seq experiments recorded in GEO and thus 30% of the tags data was unavailable. As ST represent a reservoir of SBS, their removal may have introduced a bias in sbsRT accounting. Moreover, slight heterogeneity of sequencing quality between platforms cannot be excluded. Some Tag-seq experiments carried out in healthy cells may have been produced with poor sequencing quality and thus may have introduced more SBS than in cancer cells. Finally sequence biases such as read redundancy have been reported in deep sequencing. Using RNA-seq, read redundancy can be cleaned by bioinformatics programs. Conversely, tag redundancy produced by deep sequen-cing bias cannot be cleaned in Tag-seq experiments. ST have been considered as low quality sequences, i.e. enriched in sequencing errors and may be excluded from analysis by standard bioinformatics procedures. Here, we agree with previous statements that in fact valuable in-formation is available in ST [27]. Furthermore, L-SAGE and Tag-seq may be so sensitive that they can detect base errors introduced by the cell transcriptional ma-chinery or RNA-editing. ST are thus an archive of mRNA sequence alterations either due to sequencing errors, TI, or RNA-editing and should not be sacrificed for the benefit of disk space sparing. Moreover, the pro-portion of ST per experiment has proved to be an accur-ate indicator of SBS frequency in transcripts. An unexpected high level of SBS in tags produced by L-SAGE experiments had already been reported in a previous study [28]. Using 29 publicly available L-SAGE libraries - that were also used in our study - and aligning the tags on the human genome sequence, the conclusion that the sequencing error rate might have been underes-timated was drawn since a large number of tags did not match the genome after having taken into account the currently accepted 1% base error rate of L-SAGE tags. However, in this previous study both healthy and cancer experiments were mixed, i.e. cancer was not suspected
to introduce additional SBS in transcripts. The molecu-lar mechanism underlying increased TI in cancer is still elusive. Brulliard et al. speculated that increased TI might be due to defective transcription assisted proof-reading activity. In fact, transcriptional fidelity relies i) on the ability of RNA polymerases to select the correct base before incorporation, ii) to impair RNA extension beyond a mismatch, iii) to cleave a mismatched base at the RNA 3’ boundary and resume RNA synthesis [29,30]. Dysfunction at any of these 3 crucial steps is likely to compromise RNA sequence integrity. However, cancer related somatic mutations have not been reported so far in genes coding for RNA polymerases. Conversely, mice deficient for DNA polymerase δ proofreading activ-ity have been associated with a high incidence of epithe-lial cancer [31]. Mutations in genes that code for proteins involved in mRNA synthesis could be searched in patients showing an increased SBS frequency. In ESC, the transcription of the genome is globally hyperactive [32]. No information has been made available on tran-scriptional fidelity in ESC. Comparing SBS frequencies across different cell types, we uncovered that ESC had a very low SBS frequency. This finding is in favor of a transcriptional fidelity which might be greater in ESC than in differentiated cells. We provided strong evi-dences that SBS frequency is significantly increased for a population of transcripts expressed in cancer cells. How-ever, further investigations are required to determine whether this feature is common to all cancers or whether it is only present in some malignancies or in a subset of patients.
Conclusions
SBS frequency in transcript sequences is heterogenously distributed across cells, i.e. ESC have the lowest, cancer cells have the greatest and healthy differentiated cells may lie “in between”. Therefore, SBS frequency in tran-script sequences could represent a new cancer specific biomarker which may be useful to characterize patient’s tumors. With the reduction of sequencing cost, cancer diagnostic could be aided by the determination of SBS frequency in transcripts expressed in tumors. In the fu-ture, drugs or gene therapies which may prove particu-larly efficient to treat patient’s tumors showing increased SBS frequency in transcripts could be valuable and thus intensively searched.
Additional files
Additional file 1: Generation of 17 distinct patterns for each RT. Additional file 2: Risk that a sbsRT matches by chance the RT of a transcript.
Additional file 3: L-SAGE and Tag-seq experiment sizes (sequencing effort).
Additional file 4: RT with greater SBS frequency in cancer than in healthy cells (L-SAGE).
Additional file 5: RT with greater SBS frequency in cancer than in healthy cells (Tag-seq).
Additional file 6: Manual checking of possible cancer related somatic mutations altering RT with greater SBS frequencies in cancer than in healthy cells (L-SAGE).
Additional file 7: Manual checking of possible cancer related somatic mutations altering RT with greater SBS frequencies in cancer than in healthy cells (Tag-seq).
Additional file 8: Manual checking of possible APOBEC1 RNA-editing targets altering RT with greater SBS frequencies in cancer than in healthy cells (L-SAGE).
Additional file 9: Manual checking of possible APOBEC1 RNA-editing targets altering RT with greater SBS frequencies in cancer than in healthy cells (Tag-seq).
Abbreviations
L-SAGE: Long serial analysis of gene expression; SBS: Single base substitution; RT: Reference tag; sbsRT: Single base substituted reference tag; ST: Single tag; SNP: Single nucleotide polymorphism; ESC: Embryonic stem cells;
WBC: White blood cells; GEO: Gene expression omnibus; TI: Transcriptional infidelity; EST: Expressed sequence tag; LGD: Low grade dysplasia; HGD: High-grade dysplasia; AC: Adenocarcinoma.
Competing interests
The authors declare that they have no competing interests. Authors’ contributions
LB and OP designed the study. LB, DK and RF performed the experiments. LB, DK and OP interpreted the results. LB drafts the manuscript. LB and OP wrote the final version of the manuscript. All authors read and approved the final manuscript.
Acknowledgments
This work was supported by the National Institute of Health and Medical Research (INSERM), the National Center of Scientific Research (CNRS) and the Strasbourg University (UdS). We are grateful to Prof. Anirban Maitra and Dr. Hector Alvarez who produced the single patient L-SAGE experiments and to Dr. Anamaria Camargo who provided us with L-SAGE tags associated with SNP. We thank Dr. Susan Park and Dr Julie D. Thompson for helpful comments and manuscript correction. We express also our gratitude to Dr. Wolfgang Raffelsberger and Dr. Céline Keime for help on biostatistics. Finally, L. Bianchetti would like to thank Dr. Christelle Thibault-Carpentier, Madame Marie-Ange Luc (INSERM) and Madame Anne Bara (INSERM) for their support. Author details
1Plate-forme Bioinformatique de Strasbourg (BIPS), Institut de Génétique et
de Biologie Moléculaire et Cellulaire (CNRS/INSERM/ULP), BP 163, Illkirch, Cedex, 67404, France.2Laboratoire de Bioinformatique et Génomique
Intégratives (LBGI), Institut de Génétique et de Biologie Moléculaire et Cellulaire (CNRS/INSERM/ULP), BP 163, Illkirch, Cedex 67404, France.
3
IRMA-UdS, Equipe Statistique, 7 rue René Descartes, Strasbourg, Cedex 67084, France.
Received: 22 June 2012 Accepted: 9 October 2012 Published: 8 November 2012
References
1. Vogelstein B, Kinzler KW: Cancer genes and the pathways they control. Nat. Med. 2004, 10(8):789–799.
2. McCulloch SD, Kunkel TA: The fidelity of DNA synthesis by eukaryotic replicative and translesion synthesis polymerases. Cell Res. 2008, 18 (1):148–161.
3. Alic N, Ayoub N, Landrieux E, Favry E, Baudouin-Cornu P, Riva M, Carles C: Selectivity and proofreading both contribute significantly to the fidelity of RNA polymerase III transcription. Proc. Natl. Acad. Sci. USA 2007, 104(25):10400–10405.
4. The International SNP Map Working Group: A map of human genome sequence variation containing 1.42 million single nucleotide polymorphisms. Nature 2001, 409:928–933.
5. Kevanon K, Eisenberg E, Rechavi G, Levanon EY: Letter from the editor: adenosine-to-inosine RNA editing in Alu repeats in the human genome. EMBO reports 2005, 6(9):831–835.
6. Rosenberg BR, Hamilton CE, Mwangi MM, Dewell S, Papavasiliou FN: Transcriptome-wide sequencing reveals numerous APOBEC1 mRNA-editing in transcript 3’ UTRs. Nature Struct. & Mol. Biology 2010, 18(2):230–238.
7. Hanahan D, Weinberg RA: The hallmarks of cancer. Cell 2000, 100(1):57–70. 8. Martin SA, Hewish M, Lord C, Ashworth A: Genomic instability and the
selection of treatments for cancer. J. Pathol. 2010, 220(2):281–289. 9. Davies JJ, Wilson IM, Lam WL: Array CGH technologies and their
applications to cancer genomes. Chromosome Res. 2005, 13(3):237–248. 10. Pleasance ED, Cheetham RK, Stephens PJ, McBride DJ, Humphray SJ,
Greenman CD, Varela I, Lin ML, Ordonez GR, Bignell GR, et al:
A comprehensive catalogue of somatic mutations from a human cancer genome. Nature 2010, 463(7278):191–196.
11. Wood LD, Parsons DW, Jones S, Lin J, Sjöblom T, Leary RJ, Shen D, Boca SM, Barber T, Ptak J, et al: The genomic landscapes of human breast and colorectal cancers. Science 2007, 318(5853):1108–1113.
12. Futreal PA, Coin L, Marshall M, Down T, Hubbard T, Wooster R, Rahman N, Stratton MR: A census of human cancer genes. Nature Reviews 2004, 4:177–183.
13. Brulliard M, Lorphelin D, Collignon O, Lorphelin W, Thouvenot B, Gothié E, Jacquenet S, Ogier V, Roitel O, Monnez JM, et al: Non-random variations in human cancer ESTs indicate that mRNA heterogeneity increases during carcinogenesis. Proc. Natl. Acad. Sci. USA 2007, 104(18):7522–7527. 14. Shah SP, Morin RD, Khattra J, Prentice L, Pugh T, Burleigh A, Delaney A,
Gelmon K, Guliany R, Senz J, et al: Mutational evolution in a lobular breast tumour profiled at single nucleotide resolution. Nature 2009,
461(7265):809.
15. Chen R, Mias GI, Li-Pook-Than J, Jiang L, Lam HYK, Chen R, Miriami E, Karczewski KJ, Hariharan M, Dewey FE, et al: Personal omics profiling reveals dynamic molecular and medical phenotypes. Cell 2012, 148:1293–1307.
16. Paz N, Levanon EY, Amariglio N, Heimberger AB, Ram Z, Constantini S, Barbash ZS, Adamsky K, Safran M, Hirschberg A, et al: Altered adenosine-to-inosine RNA editing in human cancer. Genome Res. 2007, 17:1586–1595. 17. Saha S, Sparks BA, Rago C, Akmaev V, Wang CJ, Vogelstein B, Kinzler KW,
Velculescu VE: Using the transcriptome to annotate the genome. Nat. Biotechnology 2002, 20(5):508–152.
18. Morrissy S, Zhao Y, Delaney A, Asano J, Dhalla N, Li I, McDonald H, Pandoh P, Prabhu AL, Tam A, et al: Digital Gene Expression by Tag sequencing on the Illumina Genome Analyzer. Curr. Protoc. Hum. Genet. 2010,
65:11.11.1–11.11.36.
19. Nielsen KL, Hogh AL, Emmersen J: DeepSAGE– digital transcriptomics with high sensitivity, simple experimental protocol and multiplexing of samples. Nucleic Acids Res. 2006, 34(19):e133.
20. Berriz GF, Roth FP: The Synergizer service for translating gene, protein and other biological identifiers. Bioinformatics 2008, 24(19):2272–2273. 21. Barrett T, Troup DB, Wilhite SE, Ledoux P, Evangelista C, Kim IF,
Tomashevsky M, Marshall KA, Philippy KH, Sherman PM, et al: NCBI GEO: archive for high-throughput functional genomic data. Nucleic Acids Res 2009, 37:885–90.
22. Bianchetti L, Wu Y, Guérin E, Poch O: SAGETTARIUS: a program to reduce the number of tags mapped to multiple transcripts and to plan SAGE sequencing stages. Nucleic Acids Res. 2007, 35(18):e122.
23. Forbes SA, Tang G, Bindal N, Bamford S, Dawson E, Cole C, Kok CY, Jia M, Ewing R, Menzies A, et al: COSMIC (The Catalogue of Somatic Mutations in Cancer) a resource to investigate acquired mutations in human cancer. Nucleic Acids Res 2010, 38:652–657.
24. Silva AP, De Souza JE, Galante PA, Riggins GJ, De Souza SJ, Camargo AA: The impact of SNPs on the interpretation of SAGE and MPSS experimental data. Nucleic Acids Res. 2004, 32(20):6104–6110.
25. Huang DW, Sherman BT, Lempicki RA: Systematic and integrative analysis of large gene lists using DAVID bioinformatics resource. Nature Protocols 2008, 4(1):44–57.
26. Alvarez H, Montgomery EA, Karikari C, Canto M, Dunbar KB, Wang JS, Feldmann G, Hong SM, Haffner MC, Meeker AK, et al: The AxI receptor
tyrosine kinase is an adverse prognostic factor and a therapeutic target in esophageal adenocarcinoma. Cancer Biology & Therapy 2010, 10(10):1009–1018.
27. Wang SM: Understanding SAGE data. Trends in genetics 2006, 3(1):42–50. 28. Keime C, Sémon M, Mouchiroud D, Duret L, Gandrillon O: Unexpected
observations after mapping LongSAGE tags to the human genome. BMC Bioinformatics 2007, 8(154):1471–2105.
29. Thomas MJ, Platas AA, Hawley DK: Transcriptional fidelity and proofreading by RNA polymerase II. Cell 1998, 93(4):627–37. 30. Sydow JF, Cramer P: RNA polymerase fidelity and transcriptional
proofreading. Current Opinion in Structural Biology 2009, 19(6):732–739. 31. Goldsby RE, Hays LE, Chen X, Olmsted EA, Slayton WB, Spangrude GJ,
Preston BD: High incidence of epithelial cancers in mice deficient for DNA polymerase δ proofreading. PNAS 2002, 99(24):15560–15565. 32. Efroni S, Duttagupta R, Cheng J, Dehghani H, Hoeppner DJ, Dash C,
Bazett-Jones DP, Le Grice S, McKay RD, Buetow KH, et al: Global transcription in pluripotent embryonic stem cells. Cell 2008, 2:437–447.
doi:10.1186/1471-2407-12-509
Cite this article as: Bianchetti et al.: Increased frequency of single base substitutions in a population of transcripts expressed in cancer cells. BMC Cancer 2012 12:509.
Submit your next manuscript to BioMed Central and take full advantage of:
• Convenient online submission
• Thorough peer review
• No space constraints or color figure charges
• Immediate publication on acceptance
• Inclusion in PubMed, CAS, Scopus and Google Scholar
• Research which is freely available for redistribution
Submit your manuscript at www.biomedcentral.com/submit