HAL Id: hal-02551021
https://hal.sorbonne-universite.fr/hal-02551021
Submitted on 22 Apr 2020HAL is a multi-disciplinary open access archive for the deposit and dissemination of sci-entific research documents, whether they are pub-lished or not. The documents may come from teaching and research institutions in France or abroad, or from public or private research centers.
L’archive ouverte pluridisciplinaire HAL, est destinée au dépôt et à la diffusion de documents scientifiques de niveau recherche, publiés ou non, émanant des établissements d’enseignement et de recherche français ou étrangers, des laboratoires publics ou privés.
Patterns of gynaecological check-up and their
association with Body Mass Index within the
CONSTANCES cohort
Jeanna-Eve Franck, Virginie Ringa, Laurent Rigal, Jeanne Sassenou, Mireille
Coeuret-Pellicer, Pierre Chauvin, Gwenn Menvielle
To cite this version:
Jeanna-Eve Franck, Virginie Ringa, Laurent Rigal, Jeanne Sassenou, Mireille Coeuret-Pellicer, et al.. Patterns of gynaecological check-up and their association with Body Mass Index within the CONSTANCES cohort. Journal of Medical Screening, SAGE Publications, 2020, pp.096914132091432. �10.1177/0969141320914323�. �hal-02551021�
Patterns of gynaecological check-up and their association with Body Mass Index within the CONSTANCES cohort
Running head: Running head: Gynaecological check-up and Body Mass Index.
Jeanna-eve Franck1, Virginie Ringa2, Laurent Rigal2, Jeanne Sassenou2, Mireille
Cœuret-Pellicer3, Pierre Chauvin1, Gwenn Menvielle1
1 Sorbonne Université, Inserm, Institut Pierre Louis d’Epidémiologie et de Santé Publique (IPLESP), Paris, France
2 CESP Centre for Research in Epidemiology and Population Health, U1018, Gender, Sexuality and Health team, University of Paris-Saclay, University of Paris-Sud, UVSQ, Villejuif, France. Ined, Paris, France.
3 Inserm-Versailles Saint Quentin en Yvelines University, UMS 011 “Epidemiological Population-Based Cohorts Unit”, Villejuif, France
Corresponding author Jeanna-eve Franck INSERM IPLESP – ERES 27 rue Chaligny 75012 Paris, France Tel.: +33 1 85 56 13 34 Fax: +33 1 44 73 84 62
E-mail: jeanna-eve.franck@inserm.fr
Word count of the abstract: 250. Word count of the manuscript: 2966.
Abstract
Objectives To investigate the relationship between patterns of gynaecological check-up and body mass index while accounting for various determinants of health care use.
Methods Sequence analysis and clustering were used to highlight patterns of gynaecological check-up, which included the regularity of breast and cervical cancer screening and visits to the gynaecologist over four years, among 6,182 women aged 54-65 included in the CONSTANCES cohort between 2013 and 2015 in France. Multinomial logistic regressions were used to study the association between these patterns and women’s body mass index.
Results We identified four patterns of gynaecological check-up, from (A) no or inappropriate check-up (20%) to (D) almost one visit to the gynaecologist every year, overscreening for cervical cancer and frequent use of opportunistic breast cancer screening (12%). From pattern A to D, the proportion of obese women decreased and that of women with normal body mass index increased. Obese and overweight women underwent more breast than cervical cancer screening and were less often overscreened than normal weight women. These differences were only partly explained by the lower socioeconomic situation of overweight and obese women. Beyond the financial barrier, the screening modality and the type of exam may play a role. Among women who were screened for cervical cancer, obese and overweight women were less often screened by a gynaecologist.
Conclusion Further efforts should be made to enhance the take-up of screening among obese women who are deterred by the healthcare system.
Keywords Cervical cancer screening; breast cancer screening; visit to the
gynaecologist; gynaecological check-up; screening regularity; barriers to screening; body mass index.
Introduction
Regular screening permits early detection of breast cancer (BC) and cervical cancer (CC) and leads to a reduction of mortality1, 2. In France, cervical cancer screening
(CCS) is performed with a Pap smear and is recommended every three years for women aged 25 to 65 years. CCS had been mainly opportunistic until May 2018 when a national organized CCS program was initiated. A breast cancer organized screening (BCOS) program also exists. All women aged 50 to 74 years are invited by the state to undergo mammography every two years for free. In addition, women have the option to undergo breast cancer opportunistic screening (BCOpS) which requires a medical prescription from a physician and includes a cost for the mammography procedure. Despite these two programs, the participation rate in CCS (about 60%) and BCS (about 50% for BCOS and 10% for BCOpS) is below the recommendations of the European Commission (70% or higher)3.
Women with increased BMI are less likely to participate in BCS and CCS 4-6. This is
of great concern as BMI is increasing worldwide and is associated with an increased risk of BC and CC and a lower cancer survival rate. Understanding the reasons for this lower participation is crucial if we want to reduce these disparities. However, the literature consistently reports that differences in sociodemographic and socioeconomic background only partly account for the differences in screening uptake by BMI, in particular for CCS4-6.
The disparity may be due in part to differences in the frequency of visits to a gynaecologist. Obese women, who have on average a lower socioeconomic position than the general population, may visit a gynaecologist less often due to the cost of the visit. In France, 45% of gynaecologists charge at least 60€ (Euros) for a standard consultation, and 21€ are reimbursed by the National Health Insurance Fund. The
Pap smear costs about 20€, and 14€ are reimbursed by the National Health Insurance Fund. Out-of-pocket fees are only partly covered by private supplementary health insurance. In this country, gynaecologists enhance participation in BCS and perform 90% of the CCS7-10.
Visiting a gynaecologist is highly correlated with uptake of BCS and CCS, while a strong association between BCS and CCS participation also exists11-15. To overcome
the methodological limits induced by these correlations, it is thus necessary to simultaneously account for these three dimensions. In addition, while studies usually investigate whether women are up-to-date for BCS or CCS, looking at the regularity of BCS and CCS in relation to that of visits to a gynaecologist may provide new insights into the relationship between BMI and cancer screening. First, it allows the investigation of inappropriate screening (under and overscreening). Second, it is likely that weight-related barriers, such as embarrassment, inadequate medical equipment and negative interactions with physicians, are more pronounced for CCS than for BCS which could lead to a lower participation in CCS than in BCS for obese women 4-6. This has been suggested in the literature by the
reporting of larger differences (in terms of BMI) in CCS than BCS take-up, but the evidence largely comes from the USA and the two screening types were not studied simultaneously. Third, the co-existence of BCOS and BCOpS in France provides a unique setting to investigate how BCS policy may impact participation.
The aim of our study was (i) to identify patterns of gynaecological check-up combining the regularity of BCS, CCS and visits to a gynaecologist over four years
using sequence analysis, and (ii) to investigate the relationships between these patterns and BMI while accounting for various determinants of healthcare use.
Materials and methods
Population
The CONSTANCES cohort in France is a population-based prospective cohort of 200,000 adults aged 18–69 years at enrollment. Participants were recruited between 2012 and 2019 from people affiliated with the National Health Insurance Fund, which accounts for 85% of the French population. Individuals were randomly selected with a stratification on age, gender, socioeconomic position and region, and received an invitation letter to participate in the cohort. At the time of this analysis, data for women enrolled up to 2015 were available. At enrollment, participants completed self-administrated questionnaires providing information on personal, environmental, behavioural, occupational and social factors. Clinical and anthropometric data were also collected during a medical examination. More details can be found elsewhere16. In addition, exhaustive and retrospective
information on individual drug and medical claims had been extracted from the National Health Insurance database and was available for the period 2009-2015. We therefore used the self-reported data collected at study entry for women who joined the study between 2013 and 2015 in order to have information on healthcare use during the four years before enrollment. This analysis was approved by the relevant French ethics committees (authorization number 1825085).
We included women aged 54 to 65 years at enrollment who were eligible for both BCS and CCS according to the French recommendations and for whom there were data available from the National Health Insurance database (n=6,474)17. The
minimum age was 54 to ensure eligibility for BCS during the four years before enrollment.
BMI was defined according to measured height and weight at study entry and categorized as underweight (<18.5 kg/m2), normal weight (18.5-24.9), overweight
(25-29.9) and obese (≥30). We excluded underweight women (n=164) and those without a recorded BMI (n=128). This gave us a final study population of 6,182 women.
Statistical analysis
Sequence analysis was used to determine the regularity of three outcomes over the four years before enrollment: visit to a gynaecologist, CCS, and BCOS or BCOpS (see Figure 1 for examples). This allowed us to study these outcomes as a whole rather than independently of each other. The method aims to identify regularities, similarities between all the sequences, and to build typical sequence typologies18.
The degree of dissimilarity between the sequences was determined via Optimum Matching19. Pattern analysis, with the Partition Around Medoids algorithm, was then
used to classify the sequences into patterns. The number of patterns was determined by the average silhouette width, point biserial correlation and Hubert’s Gamma.
According to the French recommendations for the age group (50 to 74 years), during a period of four years a woman should have been screened twice for BC and once for CC (or twice for those who have had a Pap smear four years before their study entry). In these cases, BCS and CCS participation were labeled appropriate. Higher and lower screening participation were labeled as overscreening and underscreening respectively.
In order to test the association between patterns of gynaecological check-up and BMI categories, adjusted odds ratios (OR) were assessed by multinomial logistic
regression. We investigated the role of various determinants using the conceptual framework of the Andersen Behavioral Model of Health Service Use20. This model
has four dimensions: the predisposing factors which incline an individual to use health services; the enabling factors which serve this use; the need factors which reflect the necessity of care; and the health behaviours, including use of health services and personal health practices, which also predict this utilization. Several regression models were created with successive and additional adjustments: the first adjusted for predisposing characteristics (age, relationship status, migration status, education, at least one cognitive limitation), the second for enabling resources (place of residence, financial difficulties, unmet health care needs due to financial problems), then for need factors (depressive disorder, perceived health, any physical limitations, one or more comorbidity, parental history of cancer), and finally for health behaviours (number of visits to a general practitioner during the year of enrolment, regular participation in a sport, smoking status) (see Supplementary Table 1 for more details).
Multiple imputations of 50 datasets were performed using the fully conditional specification method on all variables.
The threshold value for p was <0.05. Statistical analyses were performed using SAS 9.4, the TraMineR21 and the WeightedCluster packages22 (version 2.0-11.1 and 1.4
respectively) of R version 3.6.0. Results
Gynaecological check-up patterns identified (Figure 1, Table 1)
Pattern A (n=1,244) grouped women who did not undergo any gynaecological check-ups and those who had a gynaecological check-up focused on BCS. Over the last
four years, 89.3% did not see a gynaecologist and 79.1% were not screened for CC. Although 77.1% had been screened for BC, mainly (83.5%) through the organized program (BCOpS), more than half of them were underscreened. Nine in ten BCS were done without a visit to a gynaecologist or a CCS the same year. Nearly nine in ten CCS were done without a visit to a gynaecologist the same year. Among women who visited a gynaecologist, 67.7% were not screened for CC the same year.
Pattern B (n=2,096) grouped women with at most two visits to the gynaecologist over the last four years. About two thirds had undergone appropriate BCS – mainly through BCOS – and CCS (72.3% for BCS and 66.5% for CCS). Half of BCS were done without a visit to the gynaecologist or a CCS in the same year. Two in five CCS were done without a visit to the gynaecologist the same year. Among women who visited the gynaecologist, 7.9% were not screened for CC the same year.
Pattern C (n=2,071) grouped women who visited the gynaecologist two or more times over during the last four years. Of these, 81.2% had undergone appropriate BCS – mostly through BCOS – but 72.2% were overscreened for CC. Nearly all the CCS were done the same year as a visit to the gynaecologist. Less than one in five BCS were done without a visit to the gynaecologist or a CCS the same year.
Pattern D (n=771) grouped women who visited a gynaecologist every year and were overscreened for CC. They used both BCOS and BCOpS. Among women who were screened for BC, 38.2% had only BCOpS and 34.5% were overscreened. Nearly all the CCS were done the same year as a visit to the gynaecologist. Less than 4% of the BCS were done without a visit to the gynaecologist or a CCS the same year. Nine in ten visits to a gynaecologist were done the same year as at least one of the two screenings.
Patterns of gynaecological check-up according to the Behavioral Model (Supplementary Table 1)
For all factors we observed a gradient from pattern A to pattern D. Women in pattern A were older, more frequently reported no partner, and had more cognitive limitations. They also had a lower socio-economic status, poorer health condition, visited a general practitioner (GP) less frequently at the study entry, and practiced a sport less regularly. Women in pattern D were in the highest socioeconomic situation and more likely to live in Paris.
Association between patterns of gynaecological check-up and BMI (Table 2 and Supplementary Table 2)
From pattern A to D, the proportion of women with obesity (n=830) decreased from 21.9% to 7.7% and that of women with normal BMI (n=3,604) increased from 48.7% to 71.3%. The proportion of overweight women (n=1,748) was highest in pattern B. In pattern A, obese women were more often not screened for CC (86.0% vs. 78.1% for overweight and 76.6% for normal weight women), even when they visited a gynaecologist (81.0% vs. 65.9% for overweight and 64.7% for normal weight women). In pattern B, obese women visited a gynaecologist less frequently (24.7% had two visits vs. 28.2% for overweight and 30.7% for normal weight women). The gynaecological check-up did not differ by BMI within patterns C and D.
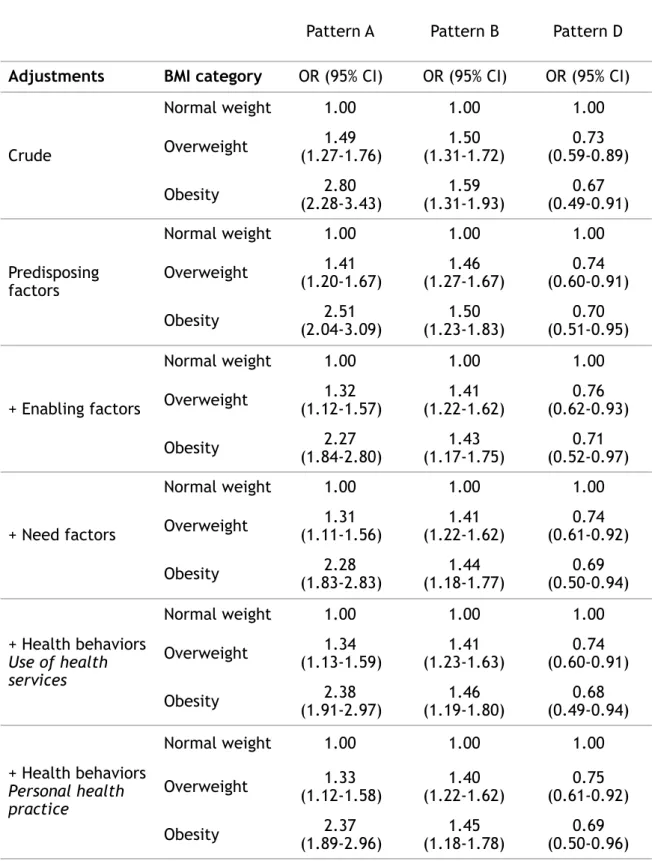
Adjustment for predisposing and enabling factors decreased the OR for patterns A and B and increased the OR for pattern D for women with obesity (from 2.80 (2.28-3.43) to 2.27 (1.84-2.80) for pattern A; 1.59 (1.31-1.93) to 1.43 (1.17-1.75) for pattern B and 0.67 (0.49-0.91) to 0.71 (0.52-0.97) for pattern D) and overweight women (from 1.49 (1.27-1.76) to 1.32 (1.12-1.57) for pattern A; 1.50
(1.31-1.72) to 1.41 (1.22-1.62) for pattern B and 0.73 (0.59-0.89) to 0.76 (0.62-0.93) for pattern D). Adjustment for need and personal health behaviours changed the ORs very little. In the final model, the differences according to BMI still held (overweight women: 1.33 [1.12-1.58] for pattern A, 1.40 [1.22-1.62] for pattern B and 0.75 [0.61-0.92] for pattern D; women with obesity: 2.37 [1.89-2.96] for pattern A, 1.45 [1.18-1.78] for pattern B and 0.69 [0.50-0.96] for pattern D).
Discussion
Among the 6,182 women recruited from the CONSTANCES cohort, we identified four patterns of gynaecological check-up: (A) no or inappropriate check-up (20%); (B) mainly appropriate BCS and CCS uptake with few visits to the gynaecologist (34%); (C) overscreening for CCS, appropriate BCS, with frequent visits to the gynaecologist (34%); and (D) overscreening for CCS, more opportunistic BCS, with almost one visit to the gynaecologist each year (12%). Obese women were found to be distributed gradually from pattern A (more often) to pattern D (less often), and overweight women from pattern B (more often) to A and D.
In the French general population, participation rates in CCS are lower than for BCS among women over the age of 50 years (50% for CCS and 60% for BCS)3. Our results
suggest that underscreened women may still screen for BC (though not regularly) much more than for CC. Indeed, in the least desirable pattern (A), 79.1% of women were never screened for CC compared to 23% for BC in the last four years.
Consulting a gynaecologist is associated with better screening behaviours for female gynaecological cancers7, 9-11, 13, 15. Our findings extend this prior knowledge
visits to a gynaecologist go along with more cancer screening, and even overscreening in particular for CC but also for BC. Overscreening was concentrated in patterns C and D for CCS and in pattern D for BCS (due to the regular use of BCOpS). It leads to unnecessary expense and is also potentially harmful: use of X-rays for BCS, and unnecessary anxiety and needless treatments for both BCS and CCS23-25.
Obese and overweight women underwent more BCS than CCS, as seen clearly in pattern A. This finding is partly explained by their lower socioeconomic position because BCOS is free in contrast to CCS: the cost of a Pap test is added to the cost of the office visit. In France, gynaecologists perform 90% of CCS and 85% of the gynaecologists charge out-of-pocket payments. However, differences remained in multivariate models for overweight and obese women. In addition to women with higher BMI having lower concern for their own health26, part of this remaining
association could be explained by the screening modality and the exam itself. First, a medical prescription from a physician is not needed for BCOS, whereas CCS requires a visit to a healthcare provider. Beyond the financial barrier, previous studies found that overweight and obese women tend to avoid visits to a gynaecologist due to stigma and biases against their weight27-29. Consistent with
this, we found that obese and overweight women more often belonged in patterns A and B, which show a lower number of visits to a gynaecologist compared to the two other patterns. Second, mammography is a less intrusive and embarrassing exam than the Pap smear; this may impact uptake in particular among women with a negative body image who experience weight-based stigma and biases. Third, women are invited by mail to participate in BCOS whereas CCS is initiated by the patient or physician. Finally, even when they visited a gynaecologist, we found
that obese and overweight women less frequently underwent a Pap smear. This could be due to either patient refusal or the attitude of the gynaecologist, possibly due to lack of appropriate materials, personal discomfort regarding the examination or even discriminatory practices5, 6, 29-31. A self-testing kit for CCS
could be a useful tool to increase uptake in this group. Self-testing is not yet implemented in France, but discussions are ongoing32.
Obese and overweight women are less likely to undergo BCOpS as highlighted by the lower ORs for pattern D. Another French study also showed that obese women have a lower probability of being screened for BC opportunistically33. As in the case
of CCS, this is likely to be explained by financial aspects but also because BCOpS requires a medical prescription7, 34.
Our analysis shows that even when obese and overweight women do undergo CCS, there is a difference in terms of who performs the procedure. In pattern A and B, 20.9% and 93.9% of women were screened for CC, respectively. However, 86.1% and 40.4% of the CCS respectively were not performed by a gynaecologist (but usually instead by a GP). These patterns include most of the overweight and obese women (60.1% and 67.4% respectively). As this group have a lower socioeconomic background, this finding may be due to the more modest cost of a visit to a GP and/or the lower density of gynaecologists in underprivileged areas. The number of visits to a GP increases with decreasing socioeconomic position and increasing BMI35-37. In addition to the financial barrier, overweight and obese women who are
not comfortable with visiting a gynaecologist could be more confident with a GP or midwife38.
Heterogeneity within each pattern is inevitable. The lower gynaecological check-up rate among women with higher BMI in patterns A and B was not observed within patterns C and D. Therefore, a non-negligible proportion of overweight and obese women had a regular gynaecological check-up, even including overscreening. These women possibly share personality traits like self-discipline or health conscientiousness, which help them to overcome the weight-related barriers to accessing healthcare and cancer screening39.
Our study has several strengths, including the sample size and the large number of high-quality variables, especially measured BMI and administrative data for healthcare use and cancer screening, which limit bias. Our original approach characterized the gynaecological check-up in a more accurate and appropriate way than if we had used classical regressions. However, we also acknowledge limitations. First, the CONSTANCES study is based on voluntary participation, which leads to an overrepresentation of women in a high socioeconomic position and who particularly pay attention to their health. Second, most variables used in the multinomial logistic regressions were measured at study entry while we investigated the rate of gynaecological check-up over the four years before. However, many of the variables probably did not change significantly over this period either because they were fixed early in life (e.g. educational level), took into account the past situation of the woman (e.g. economic difficulties) or developed gradually (e.g. BMI). Third, we could not exclude post-treatment Pap tests. Given the small number of women potentially in this situation, this is not likely to substantially bias our results. Finally, we could not exclude mammography performed for diagnostic purposes due to clinical symptoms. However, this bias is likely to be small as we excluded unilateral mammography.
Conclusion
In conclusion, although a non-negligible proportion of overweight and obese women have regular gynaecological check-ups, the trend remains: the higher the BMI, the lower the rate of gynaecological check-up. In a context of increasing BMI worldwide, our results stress the need for healthcare systems to be friendlier towards people with higher BMI.
Acknowledgements We thank the Inserm-Versailles Saint Quentin en Yvelines University “Epidemiological Population-Based Cohorts Unit” (UMS 11) who designed and is in charge of the CONSTANCES Cohort Study. They also thank the “Caisse nationale d’assurance maladie des travailleurs salariés” (CNAMTS) and the “Centres d’examens de santé” of the French Social Security which are collecting a large part of the data, as well as the “Caisse nationale d’assurance vieillesse”, ClinSearch, Asqualab and Eurocell in charge of the data quality control. This work was supported by a grant from the French Agency on Cancer (INCa) [grant number 2014-1-PL SHS-05] and the French League against Cancer.
The CONSTANCES Cohort Study was supported and funded by CNAMTS. It also received financial support from the Ministry of Health, the Council of the Ile de France Region, and by the Cohorts TGIR IReSP-ISP INSERM (Ministère de la santé et des sports, Ministère délégué à la recherche, Institut national de la santé et de la recherche médicale, Institut national du cancer et Caisse nationale de solidarité pour l'autonomie). The CONSTANCES Cohort Study is an “Infrastructure nationale en Biologie et Santé” and benefits from a grant from ANR (ANR-11-INBS-0002). CONSTANCES is also partly funded by MSD, AstraZeneca and Lundbeck.
Declaration of conflicting interests
The author(s) declared no potential conflicts of interest with respect to the research, authorship, and/or publication of this article.
Funding
There are no conflicts of interest. This work was supported by a grant from the French Agency on Cancer (INCa) [grant number 2014-1-PL SHS-05] and the French League against Cancer.
Contributors GM and JF designed the study. JF ran the analyses and wrote the paper. JF and MP prepared the dataset. All authors discussed the results and their interpretation, participated in the writing of the paper and approved the final version of the manuscript.
REFERENCES
1. Peirson L, Fitzpatrick-Lewis D, Ciliska D, et al. Screening for cervical cancer: a s y s t e m a t i c r e v i e w a n d m e t a - a n a l y s i s . S y s t R e v 2 0 1 3 ; 2 : 3 5 - 3 5 . D O I : 10.1186/2046-4053-2-35.
2. Jacklyn G, Glasziou P, Macaskill P, et al. Meta-analysis of breast cancer mortality benefit and overdiagnosis adjusted for adherence: improving information on the effects of attending screening mammography. British Journal Of Cancer 2016; 114: 1269. Epidemiology. DOI: 10.1038/bjc.2016.90
https://www.nature.com/articles/bjc201690#supplementary-information.
3. INCa. Les cancers en France en 2018 - L'essentiel des faits et chiffres (édition 2019) [French]. 2019.
4. Maruthur NM, Bolen S, Brancati FL, et al. Obesity and mammography: a systematic review and meta-analysis. J Gen Intern Med 2009; 24: 665-677. DOI: 10.1007/ s11606-009-0939-3.
5. Maruthur NM, Bolen SD, Brancati FL, et al. The association of obesity and cervical cancer screening: a systematic review and meta-analysis. Obesity (Silver Spring) 2009; 17: 375-381. 2008/11/11. DOI: 10.1038/oby.2008.480.
6. Aldrich T and Hackley B. The impact of obesity on gynecologic cancer screening: an integrative literature review. J Midwifery Womens Health 2010; 55: 344-356. 2010/07/16. DOI: 10.1016/j.jmwh.2009.10.001.
7. Duport N. Characteristics of women using organized or opportunistic breast cancer screening in France. Analysis of the 2006 French Health, Health Care and Insurance Survey. Rev Epidemiol Sante Publique 2012; 60: 421-430. DOI: 10.1016/j.respe.2012.05.006.
8. Duport N, Serra D, Goulard H, et al. [Which factors influence screening practices for female cancer in France?]. Rev Epidemiol Sante Publique 2008; 56: 303-313. 2008/10/28. DOI: 10.1016/j.respe.2008.07.086.
9. Sicsic J and Franc C. Obstacles to the uptake of breast, cervical, and colorectal cancer screenings: what remains to be achieved by French national programmes? BMC Health Serv Res 2014; 14: 465. 2014/10/06. DOI: 10.1186/1472-6963-14-465.
10. Caporossi A, Olicard C, Seigneurin A, et al. [Interval between two smear tests for cervical cancer screening and characteristics of women with a short interval: Study in the department of Isere]. Rev Epidemiol Sante Publique 2019; 67: 143-147. DOI: 10.1016/ j.respe.2019.02.004.
11. Lewis BG, Halm EA, Marcus SM, et al. Preventive services use among women seen by gynecologists, general medical physicians, or both. Obstet Gynecol 2008; 111: 945-952. DOI: 10.1097/AOG.0b013e318169ce3e.
12. Labeit A and Peinemann F. Breast and cervical cancer screening in Great Britain: Dynamic interrelated processes. Health Econ Rev 2015; 5: 32. DOI: 10.1186/ s13561-015-0065-3.
13. Bertaut A, Coudert J, Bengrine L, et al. Does mammogram attendance influence participation in cervical and colorectal cancer screening? A prospective study among 1856 French women. PLoS One 2018; 13: e0198939. DOI: 10.1371/journal.pone.0198939.
14. Larsen SH, Virgilsen LF, Kristiansen BK, et al. Strong association between cervical and breast cancer screening behaviour among Danish women; A register-based cohort study. Prev Med Rep 2018; 12: 349-354. DOI: 10.1016/j.pmedr.2018.10.017.
15. Wallace AE, MacKenzie TA and Weeks WB. Women's primary care providers and breast cancer screening: who's following the guidelines? Am J Obstet Gynecol 2006; 194: 744-748. DOI: 10.1016/j.ajog.2005.10.194.
16. Zins M, Goldberg M and team C. The French CONSTANCES population-based cohort: design, inclusion and follow-up. Eur J Epidemiol 2015; 30: 1317-1328. 2015/11/02. DOI: 10.1007/s10654-015-0096-4.
17. Santé HAd. Dépistage du cancer du sein en France : identification des femmes à haut risque et modalités de dépistage [French]. 2014.
18. Abbott A and Tsay A. Sequence Analysis and Optimal Matching Methods in Sociology:Review and Prospect. Sociological Methods & Research 2000; 29: 3-33. DOI: 10.1177/0049124100029001001.
19. Studer M RG, Gabadinho A, Müller NS. Discrepancy analysis of state sequences. Sociol Methods Res 2011; 40(3):471–510.
20. Andersen RM. Revisiting the behavioral model and access to medical care: does it matter? J Health Soc Behav 1995; 36: 1-10. 1995/03/01.
21. Gabadinho A, Ritschard G, Müller NS, et al. Analyzing and Visualizing State Sequences in R with TraMineR. Journal of Statistical Software; Vol 1, Issue 4 (2011) 2011. DOI: 10.18637/jss.v040.i04.
22. Studer M. WeightedCluster Library Manual: A practical guide to creating typologies of trajectories in the social sciences with R. 2013. Lausanne.
23. Peisl S, Zimmermann S, Camey B, et al. Comparison between opportunistic and organised breast cancer mammography screening in the Swiss canton of Fribourg. BMC Cancer 2019; 19: 469. DOI: 10.1186/s12885-019-5706-1.
24. Cardoso MJ and Cardoso F. Editorial: Overdoing in breast cancer: The risks of over-screening, over-diagnosing and over-treating the disease. Breast 2017; 31: 260. DOI: 10.1016/j.breast.2016.10.010.
25. Castle PE, Wheeler CM, Campos NG, et al. Inefficiencies of over-screening and under-screening for cervical cancer prevention in the U.S. Prev Med 2018; 111: 177-179. DOI: 10.1016/j.ypmed.2018.03.011.
26. Wee CC, McCarthy EP, Davis RB, et al. Screening for cervical and breast cancer: is obesity an unrecognized barrier to preventive care? Ann Intern Med 2000; 132: 697-704. DOI: 10.7326/0003-4819-132-9-200005020-00003.
27. Phelan SM, Burgess DJ, Yeazel MW, et al. Impact of weight bias and stigma on quality of care and outcomes for patients with obesity. Obes Rev 2015; 16: 319-326. 2015/03/11. DOI: 10.1111/obr.12266.
28. Amy NK, Aalborg A, Lyons P, et al. Barriers to routine gynecological cancer screening for White and African-American obese women. Int J Obes (Lond) 2006; 30: 147-155. 2005/10/19. DOI: 10.1038/sj.ijo.0803105.
29. Lee JA and Pause CJ. Stigma in Practice: Barriers to Health for Fat Women. Front Psychol 2016; 7: 2063. DOI: 10.3389/fpsyg.2016.02063.
30. Ferrante JM, Ohman-Strickland P, Hudson SV, et al. Colorectal cancer screening among obese versus non-obese patients in primary care practices. Cancer Detect Prev 2006; 30: 459-465. DOI: 10.1016/j.cdp.2006.09.003.
31. Adams CH, Smith NJ, Wilbur DC, et al. The relationship of obesity to the frequency of pelvic examinations: do physician and patient attitudes make a difference? Women Health 1993; 20: 45-57. DOI: 10.1300/J013v20n02_04.
32. Haguenoer K, Sengchanh S, Gaudy-Graffin C, et al. Vaginal self-sampling is a cost-effective way to increase participation in a cervical cancer screening programme: a randomised trial. Br J Cancer 2014; 111: 2187-2196. DOI: 10.1038/bjc.2014.510.
33. Constantinou P, Dray-Spira R and Menvielle G. Cervical and breast cancer screening participation for women with chronic conditions in France: results from a national health survey. BMC Cancer 2016; 16: 255. 2016/04/01. DOI: 10.1186/s12885-016-2295-0.
34. Ferrat E, Le Breton J, Djassibel M, et al. Understanding barriers to organized breast cancer screening in France: women's perceptions, attitudes, and knowledge. Fam Pract 2013; 30: 445-451. DOI: 10.1093/fampra/cmt004.
35. Fjaer EL, Balaj M, Stornes P, et al. Exploring the differences in general practitioner and health care specialist utilization according to education, occupation, income and social networks across Europe: findings from the European social survey (2014) special module on the social determinants of health. Eur J Public Health 2017; 27: 73-81. DOI: 10.1093/eurpub/ckw255.
36. Hernandez-Boussard T, Ahmed SM and Morton JM. Obesity disparities in preventive care: findings from the National Ambulatory Medical Care Survey, 2005-2007. Obesity (Silver Spring) 2012; 20: 1639-1644. 2011/08/06. DOI: 10.1038/oby.2011.258.
37. Peytremann-Bridevaux I and Santos-Eggimann B. Healthcare utilization of overweight and obese Europeans aged 50–79 years. Journal of Public Health 2007; 15: 377-384. DOI: 10.1007/s10389-007-0103-7.
38. Gudzune KA, Beach MC, Roter DL, et al. Physicians build less rapport with obese patients. Obesity (Silver Spring) 2013; 21: 2146-2152. DOI: 10.1002/oby.20384.
39. Friedman AM, Hemler JR, Rossetti E, et al. Obese women's barriers to mammography and pap smear: the possible role of personality. Obesity (Silver Spring) 2012; 20: 1611-1617. 2012/03/01. DOI: 10.1038/oby.2012.50.
Figure 1: Cumulative frequencies of sequences according to the four patterns of gynaecological check-up (A, B, C and D).
Abbreviations: BCOS, breast cancer organized screening; BCOpS, breast cancer opportunistic screening; CCS, cervical cancer screening; Cum. freq., cumulative frequency; GYN, gynaecologist.
Note: for each pattern, the most frequent sequences are displayed. For instance, in A, the sequences shown account for 89.7% of the women of this pattern.
Each sequence is ordered as follows: first the visits to a gynaecologist (black), second the CCS (dark grey), and then the BCOS (light grey) or BCOpS (stripes). As each outcome could occur four times maximum, the potential length of the sequence is 12.
Examples: over the previous four years the first sequence from the bottom represents: in Pattern A, women who were only screened two times for breast cancer through the organized program
in Pattern B, women who have had one visit to the gynaecologist, and been screened once for cervical cancer and twice for breast cancer through the organized program
in Pattern C, women who have had two visits to the gynaecologist, and been screened twice for cervical cancer and for breast cancer through the organized program
in Pattern D, women who have had four visits to the gynaecologist, and been screened three times for cervical cancer and twice for breast cancer through the organized program.
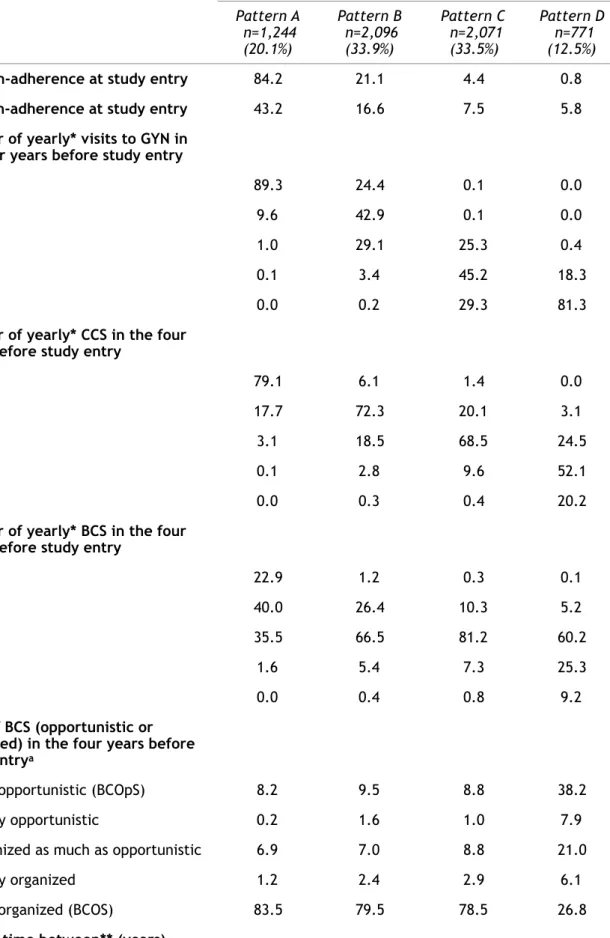
Table 1: Description of the patterns of gynaecological check-up of women aged 54-65 enrolled in CONSTANCES (n=6,182). Pattern A n=1,244 (20.1%) Pattern B n=2,096 (33.9%) Pattern C n=2,071 (33.5%) Pattern D n=771 (12.5%)
CCS non-adherence at study entry 84.2 21.1 4.4 0.8
BCS non-adherence at study entry 43.2 16.6 7.5 5.8
Number of yearly* visits to GYN in the four years before study entry
0 89.3 24.4 0.1 0.0
1 9.6 42.9 0.1 0.0
2 1.0 29.1 25.3 0.4
3 0.1 3.4 45.2 18.3
4 0.0 0.2 29.3 81.3
Number of yearly* CCS in the four years before study entry
0 79.1 6.1 1.4 0.0
1 17.7 72.3 20.1 3.1
2 3.1 18.5 68.5 24.5
3 0.1 2.8 9.6 52.1
4 0.0 0.3 0.4 20.2
Number of yearly* BCS in the four years before study entry
0 22.9 1.2 0.3 0.1 1 40.0 26.4 10.3 5.2 2 35.5 66.5 81.2 60.2 3 1.6 5.4 7.3 25.3 4 0.0 0.4 0.8 9.2 Type of BCS (opportunistic or organized) in the four years before study entrya
Only opportunistic (BCOpS) 8.2 9.5 8.8 38.2
Mostly opportunistic 0.2 1.6 1.0 7.9
Organized as much as opportunistic 6.9 7.0 8.8 21.0
Mostly organized 1.2 2.4 2.9 6.1
Only organized (BCOS) 83.5 79.5 78.5 26.8
Two GYN visits 1.6 (1.2-1.9) 1.5 (1.2-2.2) 1.2 (1.0-1.6) (1.0-1.2)1.1
Two CCS 1.8 (1.4-2.5) 2.0 (1.4-2.5) 2.0 (1.6-2.4) (1.1-1.7)1.3
Two BCS 2.1 (2.0-2.3) 2.0 (1.9-2.2) 2.0 (1.9-2.2) (1.4-2.1)1.9
Overscreening for CCSa,† 13.1 21.4 72.2 94.7
Overscreening for BCSb,‡ 2.1 5.9 8.2 34.5
Have visited a gynaecologist at least once but have not been screened for CC over the four years before study entry
67.7 7.9 1.5 0.0
Proportion of women with no visit to a GYN, BCS nor CCS over the four
years before study entry 16.2 0.0 0.0 0.0 Proportion of visits to a GYN done
without CCS or BCS the same yearc 47.3 19.5 20.6 10.0
Proportion of CCS done without a
visit to GYN the same yearb 86.1 40.4 3.8 1.1
Proportion of BCS done without a
visit to GYN or CCS the same yeara 91.1 54.3 18.0 3.6
Proportion of BCS done with CCS the
same yeara 6.4 34.8 51.3 72.7 Abbreviations: BCOS: Breast cancer organized screening; BCOpS: Breast cancer opportunistic screening;
CCS: Cervical cancer screening; GYN: gynaecologist. a Among the women with at least one BCS over the last four years.
b Among the women with at least one CCS over the last four years.
c Among the women with at least one visit to a GYN over the last four years.
* All years with at least one visit to the GYN or one CCS or one BCS are counted.
** At least two GYN visits or two CCS or two BCS over the last four
years.
† Two CCS in less than three years or at least three CCS over the four years.
‡ More than two BCS over the four years.
Table 2: Association between patterns of gynaecological check-up and BMI: results of multinomial logistic regression
Pattern A Pattern B Pattern D Adjustments BMI category OR (95% CI) OR (95% CI) OR (95% CI)
Crude Normal weight 1.00 1.00 1.00 Overweight (1.27-1.76)1.49 (1.31-1.72)1.50 (0.59-0.89)0.73 Obesity (2.28-3.43)2.80 (1.31-1.93)1.59 (0.49-0.91)0.67 Predisposing factors Normal weight 1.00 1.00 1.00 Overweight (1.20-1.67)1.41 (1.27-1.67)1.46 (0.60-0.91)0.74 Obesity (2.04-3.09)2.51 (1.23-1.83)1.50 (0.51-0.95)0.70 + Enabling factors Normal weight 1.00 1.00 1.00 Overweight (1.12-1.57)1.32 (1.22-1.62)1.41 (0.62-0.93)0.76 Obesity (1.84-2.80)2.27 (1.17-1.75)1.43 (0.52-0.97)0.71 + Need factors Normal weight 1.00 1.00 1.00 Overweight (1.11-1.56)1.31 (1.22-1.62)1.41 (0.61-0.92)0.74 Obesity (1.83-2.83)2.28 (1.18-1.77)1.44 (0.50-0.94)0.69 + Health behaviors Use of health services Normal weight 1.00 1.00 1.00 Overweight (1.13-1.59)1.34 (1.23-1.63)1.41 (0.60-0.91)0.74 Obesity (1.91-2.97)2.38 (1.19-1.80)1.46 (0.49-0.94)0.68 + Health behaviors Personal health practice Normal weight 1.00 1.00 1.00 Overweight (1.12-1.58)1.33 (1.22-1.62)1.40 (0.61-0.92)0.75 Obesity (1.89-2.96)2.37 (1.18-1.78)1.45 (0.50-0.96)0.69
Abbreviations: BMI: Body Mass Index; CI: Confidence Interval; OR: Odds Ratios.
Notes: The reference group for this analysis was pattern C, which had the highest participation rates for BCS and CCS and the lowest rate of overscreening.
Predisposing factors: age, in a relationship, migration status, educational level, at least one cognitive limitation.
Enabling factors: place of residence, financial difficulties, unmet health care needs due to financial problems.
Need factors: depressive disorder, perceived health, at least one physical limitation, at least one comorbidity, parental history of cancer.
Health behaviors - Use of health services: number of visits to the general practitioner during the year of enrolment.
Supplementary material
Patterns of gynaecological check-up and their association with Body Mass Index in the CONSTANCES cohort
Supplementary Table 1: Characteristics of women according to patterns of gynaecological check-up Pattern A n=1,244 (20.1%) Pattern B n=2,096 (33.9%) Pattern C n=2,071 (33.5%) Pattern D n=771 (12.5%) Age ≤ 56 19.8 21.5 25.4 23.3 57-59 26.8 26.2 26.7 28.7 60-61 22.3 21.7 19.2 20.5 ≥ 62 31.1 30.6 28.7 27.5 In a relationship 70.2 77.5 80.5 79.8 Migration status
French with two French parents 80.6 83.1 85.9 78.6
French with at least one foreign
parent 10.2 9.6 9.0 13.0
Naturalised immigrant 5.5 5.0 4.2 6.9
Foreign immigrant 3.6 2.3 0.9 1.5
Educational level
No diploma or primary education 18.5 16.4 11.8 7.4
Vocational secondary 20.9 20.3 20.2 16.6
High school 17.6 17.1 16.8 18.3
Bachelor degree or equivalent 30.9 33.4 38.8 39.5
Master degree or equivalent 12.1 12.8 12.4 18.2
At least one cognitive limitation 17.4 14.1 11.4 10.5
Place of residence Rural 19.7 17.6 16.8 8.6 <20,000 inhabitants 15.6 17.1 13.6 10.1 20,000-99,999 inhabitants 9.4 9.4 7.7 5.3 ≥100,000 inhabitants 40.1 41.5 48.4 45.0 Paris area 15.2 14.4 13.5 31.0 Financial difficultiesa Never 51.2 59.1 66.8 67.1
Occurred in the past 31.9 31.0 26.3 27.6
Unmet health care needs due to
financial problems 21.7 13.9 10.3 9.0
Depressive disorderb 21.5 18.7 18.0 15.0
Perceived health
Good to very good 68.8 73.5 76.6 77.9
Fair 25.9 22.5 19.3 18.0
Poor to very bad 5.3 4.0 4.2 4.1
At least one physical limitationc 27.9 22.7 19.0 18.8
At least one comorbidityd 35.0 32.4 29.6 29.3
Parental history of cancer 41.5 43.3 44.8 44.5
BMI
Normal weight 48.7 53.7 63.9 71.3
Overweight 29.4 32.6 25.9 21.0
Obesity 21.9 13.7 10.2 7.7
Number of visits to general practitioner during year of enrolment
None 12.2 7.3 5.3 5.6
1-4 49.9 49.5 48.1 49.7
≥5 37.9 43.3 46.5 44.7
Regular participation in a sport 55.1 66.5 71.7 71.3
Smoking status
Never smoked 46.7 50.7 52.3 48.2
Smoker 18.9 11.7 10.4 13.2
Ex-smoker 34.3 37.5 37.3 38.7
a: Difficulty meeting financial needs.
b: According to the CES-D score.
c: Having difficulty climbing up or down stairs alone, walking 1 km alone, and/or carrying a load weighing 5 kg over a distance of 10 m alone.
d: Having long-term illness fee exemption (corresponding to the full reimbursement of medical fees for a specific condition), antidiabetic treatment within the last 12 months, antihypertensive treatment within the last 12 months, at least one endocrine disorder (treated
hypercholesterolemia and treated hypertriglyceridemia), personal history of cancer and/or at least one cardiovascular disease (angina pectoris, myocardial infarction, stroke).
Supplementary Table 2: Description of patterns of gynecological check-up according to BMI categories
Pattern A
n=1,244 (20.1%) n=2,096 (33.9%)Pattern B n=2,071 (33.5%)Pattern C n=771 (12.5%)Pattern D n=6,182Overall
Nw Ow Ob Nw Ow Ob Nw Ow Ob Nw Ow Ob Nw Ow Ob BMI distributio n 48.7 29.4 21.9 53.7 32.6 13.7 63.9 25.9 10.2 71.3 21.0 7.7 58. 3 28.3 13.4 Number of yearly visits to GYN in the four years before study entry *,v 0 88.8 88.0 92.3 23.6 25.4 25.4 0.1 0.2 0.0 0.0 0.0 0.0 22.3 28.4 39.0 1 10.1 10.7 7.0 40.9 43.9 48.4 0.2 0.0 0.0 0.0 0.0 0.0 14.5 19.4 19.0 2 1.0 1.4 0.7 30.7 28.2 24.7 24.0 28.0 26.4 0.6 0.0 0.0 18.7 19.9 15.5 3 0.2 0.0 0.0 4.6 2.3 1.1 45.6 44.0 46.2 18.0 18.5 20.3 21.0 16.1 13.6 4 0.0 0.0 0.0 0.3 0.2 0.4 30.2 27.8 27.4 81.5 81.5 79.7 23.6 16.1 12.8 Number of yearly CCS in the four years before study entry*,v 0 76.6 78.1 86.0 6.3 6.0 5.2 1.2 1.9 1.9 0.0 0.0 0.0 15.3 19.3 30.5 1 19.1 19.1 12.5 71.2 72.5 76.0 19.7 20.2 22.6 3.5 2.5 1.7 33.2 38.8 36.3 2 4.1 2.7 1.5 18.8 18.4 17.4 69.3 67.2 67.0 24.2 26.5 22.0 35.7 30.8 25.2 3 0.2 0.0 0.0 3.3 2.6 1.4 9.5 10.3 8.0 52.2 49.4 59.3 12.5 8.8 6.8 4 0.0 0.0 0.0 0.4 0.4 0.0 0.3 0.6 0.5 20.2 21.6 17.0 3.3 2.4 1.3 Number of yearly BCS in the four years before study entry*,v
0 24.8 21.0 21.3 1.5 0.9 1.1 0.3 0.4 0.5 0.0 0.6 0.0 4.7 4.9 7.5 1 40.8 41.5 36.0 28.1 23.1 27.9 10.6 9.9 9.9 4.6 8.0 3.4 20.2 21.5 24.2 2 33.3 35.5 40.4 64.4 70.3 65.5 80.9 81.3 82.6 60.9 57.4 61.0 64.7 65.2 61.3 3 1.2 1.9 2.2 5.7 5.1 5.2 7.6 6.9 6.6 24.9 24.7 30.5 8.6 6.8 6.4 4 0.0 0.0 0.0 0.4 0.6 0.4 0.6 1.5 0.5 9.6 9.3 5.1 1.8 1.5 0.6 Type of BCS (opportuni stic or organized) over the four years before study entrya,v Only opportunist ic (BCOpS) 8.3 10.4 5.1 10.8 7.5 9.2 9.5 6.9 9.5 40.0 35.4 28.8 14. 7 10.5 9.6 Mostly opportunist ic 0.4 0.0 0.0 1.6 1.2 2.1 0.8 1.3 1.4 8.9 5.6 5.1 2.3 1.4 1.6 Organize d as much as opportunist ic 5.7 9.3 6.1 7.9 6.1 6.0 8.7 8.1 10.9 20.0 21.7 28.8 9.9 8.8 9.1 Mostly organized 0.9 1.4 1.4 2.5 2.2 2.1 3.1 2.3 2.8 4.7 8.1 13.6 2.9 2.7 3.0 Only organized (BCOS) 84.7 78.9 87.4 77.1 83.0 80.6 77.9 81.5 75.4 26.4 29.2 23.7 70. 3 76.6 76.7 Median time between (years)** Two GYN visits 1.5 (1.0 -1.8 ) 1.9 (1.4 -2.0 ) 1.4 (1.1 -1.7 ) 1.5 (1.2 -2.1 ) 1.5 (1.2 -2.1 ) 1.8 (1.2 -2.3 ) 1.2 (1.0 -1.6 ) 1.2 (1.0 -1.7 ) 1.2 (1.0 -1.6 ) 1.1 (1.0 -1.1 ) 1.1 (1.0 -1.2 ) 1.0 (1.0 -1.2 ) 1.2 (1.0 -1.5 ) 1.2 (1.0 -1.7 ) 1.2 (1.0 -1.7 ) Two CCS 1.7 (1.3 -2.4 ) 1.9 (1.7 -2.0 ) 3.0 (1.9 -3.2 ) 2.0 (1.4 -2.5 ) 1.9 (1.4 -2.4 ) 2.1 (1.5 -2.4 ) 2.0 (1.6 -2.4 ) 2.0 (1.6 -2.4 ) 2.0 (1.5 -2.5 ) 1.4 (1.1 -1.8 ) 1.4 (1.1 -1.7 ) 1.2 (1.1 -1.7 ) 1.8 (1.3 -2.3 ) 1.8 (1.3 -2.3 ) 1.9 (1.3 -2.4 ) Two BCS 2.1 (2.0 -2.3 ) 2.1 (2.0 -2.3 ) 2.1 (1.9 -2.3 ) 2.0 (1.9 -2.2 ) 2.1 (2.0 -2.2 ) 2.0 (1.9 -2.2 ) 2.0 (1.9 -2.2 ) 2.0 (2.0 -2.2 ) 2.0 (1.9 -2.2 ) 1.9 (1.4 -2.1 ) 1.9 (1.4 -2.1 ) 1.8 (1.5 -2.0 ) 2.0 (1.9 -2.2 ) 2.0 (1.9 -2.2 ) 2.0 (1.9 -2.2 ) Overscree ning for CCSa,† 16.2 11.3 5.3 22.3 20.8 19.1 73.1 71.5 68.3 94.2 95.7 96.6 56. 7 47.8 43.9
Overscree ning for BCSb,‡ 1.5 2.4 2.8 6.1 5.8 5.6 8.3 8.4 7.1 34.6 34.2 35.6 10. 9 8.8 7.6 Have visited GYN at least once but have not been screened for CC over the four years before study entry 64.7 65.9 81.0 8.1 7.8 7.0 1.2 1.9 1.9 0.0 0.0 0.0 4.6 6.3 7.1 Proportion of women with no visit to GYN, BCS or CCS over the four years before study entry 16.2 14.5 18.8 0.0 0.0 0.0 0.0 0.0 0.0 0.0 0.0 0.0 2.7 3.0 6.0 Proportion of visits to GYN done without CCS or BCS the same yearc 46.1 49 47.8 20.3 19.5 16.3 20.6 20.6 21 10.1 9.4 11.2 17.9 18.5 18.5 Proportion of CCS done without visit to GYN the same yearb 86.4 83.3 90.4 39.9 42.1 38.2 4.1 3.6 3.2 1.1 1.3 1.2 14.3 19.3 19.1 Proportion of BCS done without visit to GYN or CCS the same yeara 90.3 90.5 93.5 53.5 55.0 55.4 17.4 19.8 17.7 3.7 3.4 2.9 32.9 41.6 48.1 Proportion of BCS done with CCS the same yeara 7.0 7.2 4.2 34.4 35.0 36.2 51.1 51.7 51.3 72.8 71.2 76.4 46.0 41.3 37.0
Abbreviations: BCOS: breast cancer organized screening; BCOpS: breast cancer opportunistic screening; CCS: cervical cancer screening; GYN: gynecologist; Nw: normal weight; Ow: overweight; Ob: obesity.
a Among the women with at least one BCS over the last four years.
b Among the women with at least one CCS over the last four years.
c Among the women with at least one visit to GYN over the last four years.
* All years with at least one visit to GYN or one CCS or one BCS are counted.
** At least two GYN visits or two CCS or two BCS over the last four years.
† Two CCS in less than three years or three or more CCS.
‡ More than two BCS.
v The differences between the distribution of the variable by BMI category were tested within each pattern
and for the overall population. Significant differences were observed for: Pattern A: number of years with one CCS; Pattern B: number of years with at least one visit to GYN; Overall: number of years with at least one visit to GYN, number of years with one CCS, number of years with one BCS over the four years before study entry, type of BCS (opportunistic or organized) over the four years before study entry.