HAL Id: inserm-00402779
https://www.hal.inserm.fr/inserm-00402779 Submitted on 8 Jul 2009
HAL is a multi-disciplinary open access
archive for the deposit and dissemination of sci-entific research documents, whether they are pub-lished or not. The documents may come from teaching and research institutions in France or abroad, or from public or private research centers.
L’archive ouverte pluridisciplinaire HAL, est destinée au dépôt et à la diffusion de documents scientifiques de niveau recherche, publiés ou non, émanant des établissements d’enseignement et de recherche français ou étrangers, des laboratoires publics ou privés.
and its relationship with glucose metabolism and
substrate levels.
Lotfi Slimani, Nobuyuki Kudomi, Vesa Oikonen, Mikko Jarvisalo, Jan Kiss, Alexandru Naum, Ronald Borra, Antti Viljanen, Hannu Sipila, Ele Ferrannini,
et al.
To cite this version:
Lotfi Slimani, Nobuyuki Kudomi, Vesa Oikonen, Mikko Jarvisalo, Jan Kiss, et al.. Quantification of liver perfusion with [(15)O]H(2)O-PET and its relationship with glucose metabolism and substrate levels.: Quantification of liver perfusion with PET. Journal of Hepatology, Elsevier, 2008, 48 (6), pp.974-82. �10.1016/j.jhep.2008.01.029�. �inserm-00402779�
Quantification of liver perfusion with [
15O]H
2
O-PET and its relationship
with glucose metabolism and substrate levels
Lotfi Slimani1, Nobuyuki Kudomi1, Vesa Oikonen1, M Jarvisalo1, Jan Kiss1, Alexandru
Naum1, Ronald Borra1, Antti Viljanen1, H. Sipila1, Ele Ferrannini2,3, T. Savunen4, Pirjo
Nuutila1,5 and Patricia Iozzo1,2
1Turku PET Centre, Turku University Hospital, Turku, Finland; 2Institute of Clinical
Physiology, CNR National Research Council, Pisa, Italy; 3Department of Internal Medicine,
University of Pisa School of Medicine, Pisa, Italy; 4Departments of Surgery and 5Medicine,
Turku University Hospital, Turku, Finland.
Running Title : Quantification of liver perfusion with PET
Corresponding authors:
Patricia Iozzo, MD, Ph.D Lotfi Slimani, Ph.D
Turku PET Centre, University of Turku Turku PET Centre, University of Turku
P.O. Box 52, FIN-20521 Turku, Finland. P.O. Box 52, FIN-20521 Turku, Finland.
Phone: +39 050 315 3525 Fax : +358 2 231 8191
Fax: +39 050 315 2166 E-mail : lotfi_slimani@hotmail.com
E-mail : patricia.iozzo@ifc.cnr.it
Abstract (204 words)
Background/Aims: Hepatic perfusion plays an important role in liver physiology and disease. This study was undertaken to 1) validate the use of Positron Emission Tomography (PET) and oxygen-15-labeled water ([15O]H
2O) to quantify hepatic and portal perfusion, and 2) examine
relationships between portal perfusion and liver glucose and lipid metabolism. Methods: Liver [15O]H
2O-PET images were obtained in 14 pigs during fasting or
hyperinsulinemia. Carotid arterial and portal venous blood were sampled for [15O]H 2O
activity; Doppler ultrasonography was used invasively as the reference method. A single arterial input compartment model was developed to estimate portal tracer kinetics and liver perfusion. Endogenous glucose production (EGP) and insulin-mediated whole body glucose uptake (wbGU) were determined by standard methods.
Results: Hepatic arterial and portal venous perfusion was 0.15±0.07 and 1.11±0.34 ml/min/ml of tissue, respectively. The agreement between ultrasonography and [15O]H
2O-PET was good
for total and portal liver perfusion, and poor for arterial perfusion. Portal perfusion was correlated with EGP (r=+0.62, p=0.03), triglyceride (r=+0.66, p=0.01), free fatty acid levels (r=+0.76, p=0.003), and plasma lactate levels (r=-0.81, p=0.0009).
Conclusions: Estimates of liver perfusion by [15O]H
2O-PET compared well with those by
ultrasonography. The method allowed predict portal tracer concentrations, which is essential in human studies. Portal perfusion may affect liver nutrient handling.
Keywords
: Hepatic blood flow • Liver metabolism • compartmental modeling • parameter estimation • Portal vein • hepatic arteryIntroduction
Hepatic blood flow is an important factor in liver disease of any severity. The occurrence of liver ischemia-reperfusion damage is a fundamental concern in liver trauma, sepsis, and liver transplantation. Portal blood flow was shown to be an independent predictor of patient survival in alcoholic hepatitis1. Hepatic blood flow is impaired in the fatty liver and responds to its amelioration2; thus, its assessment seems useful to evaluate the natural course of non-alcoholic fatty liver disease, and to monitor the effects of therapy2. While a reduced liver flow may be consequence of disease in the above examples, a physiological role of hepatic perfusion in regulating the metabolism of the organ is suggested by sparse evidence of a positive relationship between liver flow and hepatic glucose output3 and triglyceride release in perfused organs4. The circulatory system of the liver has a dual blood supply. Venous blood, containing nutrients absorbed through a great portion of the gastrointestinal tract is drained into the liver by the portal vein. Arterial blood from the abdominal aorta is supplied to the organ via the hepatic artery. Interestingly, the reduction of portal in favour of arterial flow is associated with corresponding fatty spared liver areas5, 6.
Hepatic blood flow has been quantified with invasive techniques, including dye dilution7, 8, microspheres9, plethysmography10, and Doppler ultrasonography11. The latter method is used non-invasively to assess flow velocity in large vessels in humans. However, one important aspect in flow-regulated metabolism may be the exchange between blood and hepatocytes occurring at the microcirculatory level12, and liver microcirculation seems a more sensitive marker of disease and disease recovery as compared with macrovascular blood flow or velocity13. Positron Emission Tomography (PET) can be used in combination with the freely diffusible tracer oxygen-15 labelled water ([15O]H
2O), as gold-standard in the quantification
of perfusion in different organs14, 15, 16, 17, 18. Perfusion is expressed as blood flow per unit mass or volume of tissue (ml/min/g or ml of tissue), incorporating both micro- and
macrocirculatory contributions. The mathematical modeling of PET data requires notion of tracer concentrations in the tissue (as determined in sequential images), and in the blood entering the organ, namely the input function. Different from all other organs, receiving only arterial blood that is accessible for direct measurement, the liver is characterized by a dual blood supply, and access to the portal vein is impractical in humans in vivo. A major contribution in this area has been provided by the work of Taniguchi et al19, 20, 21, who developed a series of models to predict the portal input function from arterial measurements, and to estimate liver perfusion; unfortunately, these studies lack the comparison with an independent and validated method.Other authors9 found some discrepancy between PET and microsphere techniques, which they attributed to the heterogeneity of arterial liver perfusion; in their study, the intra-arterial injection of microspheres prevented the direct evaluation of portal or total liver flow, given the interposition of splanchnic organs. Microvascular models were successfully validated against flow meter measurements, by using PET and C15O 22, but the properties of this purely intra-vascular tracer cannot be extrapolated to those of freely diffusible [15O]H
2O.
The current study was undertaken to validate the use of dynamic PET imaging and [15O]H 2O
in combination with a single-input, and a one-tissue compartment model for estimating the portal from the arterial liver input function, and quantifying hepatic arterial, portal vein, and total liver perfusion. In addition, endogenous glucose production (as previously reported in these animals23,24) and arterial and portal substrate levels were determined to verify the hypothesis of a relationship between portal flow and liver glucose and lipid metabolism. The study was conducted in the swine model, because Doppler ultrasonography was used invasively as reference method.
Material and methods
Animal preparation Fourteen anesthetized pigs were deprived of food on the day prior to the study at 5:00 pm. Anesthesia was induced by injection of 1.0 g of ketamine into neck muscles before pig transportation to the operating theatre. Throughout the experiment, animals were kept anesthetized with ketamine and pancuronium (total of 1.5 g and 40 mg, respectively) and mechanically ventilated via tracheal intubation with oxygen and normal room air (regulated ventilation, 16 breaths per min). Catheters were placed in the femoral vein and carotid artery, for the administration [15O]H
2O, and for sampling of arterial blood, respectively. Splanchnic
vessels were accessed by sub-costal incision; after dissection of the hepato-gastric ligament, purse string sutures were allocated to allow catheter insertion via a small incision in the portal vein. Doppler flow-probes (Medi-stim Butterfly Flowmeter, Medi-Stim AS) were placed around the portal vein and hepatic artery to determine blood velocity in each vessel ; blood flow was monitored continuously and recorded eight times. The surgical access was closed, and the distal catheter extremities were secured to the abdominal surface to avoid tip displacement. The animals were then transported to the PET centre for tracer administration, liver imaging and blood sampling. Seven animals were studied during fasting and eight during euglycemic hyperinsulinemia, as previously described23,24. The protocol was reviewed and approved by the Ethical Committee for Animal Experiments of the University of Turku. PET scanning Scans were performed using an ECAT 931-08/12 scanner (CTI Inc, Knoxville, TN) with a 10.5 cm axial field of view and a resolution of 6.7 mm (axial) x 6.5 mm (in-plane) full width at half maximum (FWHM). A transmission scan was performed to correct for photon attenuation. [15O]H
2O (806±50 MBq) was rapidly injected, a 345 sec dynamic
[15O]H
2O PET scan was started (20 frames, 1x2.5, 5x5, 1x10, 5x15, 1x22.5, 7x30 seconds).
Arterial and portal venous blood was continuously withdrawn for the determination of blood [15O]H
consisted of two pairs of coincidence BGO crystals and a peristaltic pump. The detectors had been cross-calibrated to the PET scanner via ion chamber. The blood curve from the online sampler was calibrated and corrected for decay and dispersion14. Additional arterial and portal venous blood samples were obtained during the study for the assessment of circulating glucose, insulin, lactate, triglyceride, fatty acids and liver enzymes, as previously described25, 26.
Vital signs, blood pressure and heart rate were monitored throughout the study. At the end of the experimental period, animals were sacrificed by potassium chloride injection and anaesthetic overdose, the abdominal cavity was rapidly accessed, the whole organ was explanted and its volume was measured by water displacement. Doppler flow measurements in ml/min were divided by the organ volume to obtain PET equivalent units of ml/min/ml.
Image processing All sinograms were corrected for tissue attenuation, dead time, and decay, and reconstructed through standard reconstruction algorithms in a 256x256 matrix. Final in-plane resolution of reconstructed and Hann-filtered images was ~10 mm at 10 cm from the centre of the gantry. Regions of interest (ROI) were drawn in the [15O]H
2O image
over 3-6 transaxial planes corresponding to the right lobe of the liver to obtain hepatic [15O]H
2O time activity curves (TACs).
Data analysis - Compartmental Modeling The compartmental model used to quantify liver perfusion is shown in Figure 1, representing the Kety-Schmidt, single-tissue flow model27, as modified to take into account the dual liver perfusion, and the tracer outflow via the hepatic vein. Image-derived liver [15O]H
2O concentrations, and the arterial blood time course of
[15O]H
2O (as single input function) were used in the model to obtain estimates of portal vein
[15O]H
2O levels and separate estimates of arterial and portal venous liver perfusions. Notably,
[15O]H
2O activity levels as directly measured in the portal vein were not used in the modelling
whole liver with extra-vascular space, capillaries and cells is simplified as a single compartment and water is assumed to be freely diffusible. For the calculation of liver perfusion we assumed extraction fraction equal to 1.0 in the liver. Perfusion from the hepatic artery and from the portal vein is represented by Fa and Fp, respectively. The outflow rate
constant (k) from the liver is given by the sum Fa + Fp.
The single input model can be described mathematically by the following equations:
dCL(t)/dt = FaCA(t) + FpCV(t) –KCL(t) dCL(0)/dt = 0 (1)
dCd(t)/dt = FaCA(t) – FaCd(t) dCd(0)/dt = 0 (2)
with the washout-constant K, (min-1) as : K = [(F
a + Fp)/VL].
dCV(t)/dt = Fp*[CA(t) + CG(t)] – 2*FpCV(t) dCV(0)/dt = 0 (3)
dCG(t)/dt = FpCv(t) – FpCG(t) dCG(0)/dt = 0 (4)
where CA(t), CV(t) and CL(t) represent [15O]H2O concentration in the artery, portal vein and
liver, respectively. CG is the [15O]H2O concentration in a notional gut compartment
(gastrointestinal organs), here defined as portal organ because it is assumed to be drained in the portal vein. VL is distribution volume of tracer between blood and tissue. Cd is the
[15O]H
2O concentration in compartment representing the heterogeneity and slowing of flow at
the entry in the liver. The exchanges parameters between CG and CV are assumed to be equal
to FP.
A hepatic blood volume term, V0, was included in the model to account for the contribution of
the tracer within vascular/sinus space of the tissue to the observed tissue ROI activity, Cobs(t) = (1-V
0)×CL(t) + V0CA(t), (5)
where CA is the [15O]H2O arterial blood concentration.
Delay correction The time delay between the liver and the carotid blood-sampling site was corrected by a fixed constant obtained with a graphical method in each study, as shown in figure 2.
Parameter estimation All parameters were determined by iterative curve fitting and the minimization of an objective function implemented in the SAAM II software28. Compartmental model parameters were estimated by weighted nonlinear least squares and the observed PET activity, Cobs, was described as:
Cobs (t
j) = C(tj) + e(tj) j=1, 2 … N (6)
where e(tj) is the measurement error at time tj assumed to be independent, Gaussian, zero
mean. The goodness of the fit was judged by the residual error evaluation calculated at the different sample time as:
2 ij i,j ˆ ij i,j
wres = w s(p,t ) y − (7)
where wi,j is the weight associated with each datum, s(ˆ p ,tij) is the value predicted by the
model, yi, j is the measured experimental value and p is the unknown parameter estimated.
SAAM II calculates a weight "wi,j" associated with each datum "yi,j" from the standard
deviation that has been assigned to the datum by the user, a fractional standard deviation (FSD) of "0.1" was assigned to each datum. Parameter precision was evaluated from the inverse of the Fisher information matrix29.
Statistical analysis Results are expressed as mean±SD. Values of model parameters with low precision, as defined by a coefficient of variation (CV = SD(pˆi)/pˆix 100, where pˆiis the parameter estimate and SD( pˆi) is its standard deviation) >100% were excluded from the calculation of the group mean. Agreement between the results obtained with the model and ultrasonography method was tested by the Bland-Altman approach30. Regression analysis was performed according to standardized methods; in the evaluation of relationships between liver perfusion and metabolic measurements, each variable showing a significant correlation was re-tested in a multiple regression model taking into account the differences in insulin levels23,24. A p < 0.05 was considered to be significant. Statistical analysis was performed using Statview for Windows, SAS institute.
Results
Compartmental modeling A representative example of a liver H215O image and of the
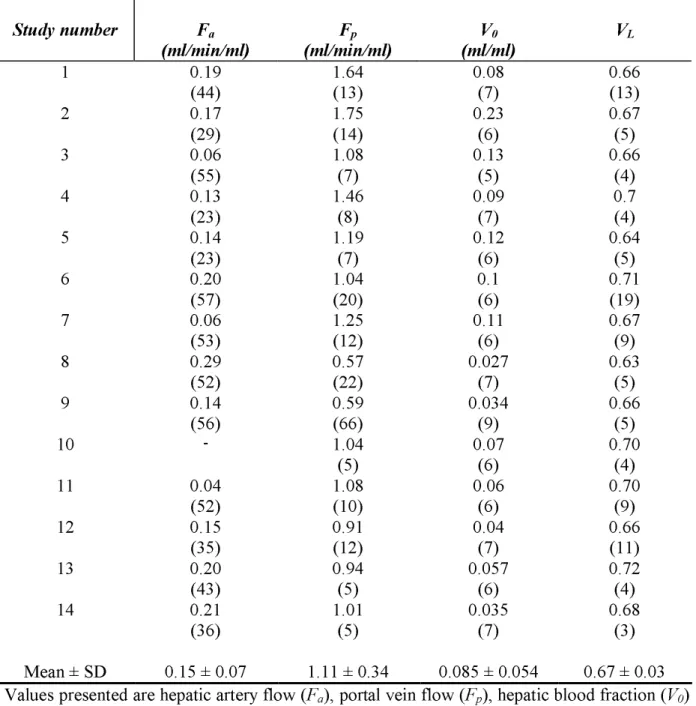
measured arterial, portal venous and tissue time-activity curves in pig 1 is shown in Figure 3A-C. Model parameters were estimated with good precision in most studies; the single-input model was able to predict the time course of tracer concentrations in each compartment. An example is given in Fig. 3, showing the adherence of model-predicted vs directly measured time activity curves in the portal and tissue compartments. Individual arterial and portal perfusion, and distribution volume results, as obtained by fitting the single-input model to the measured data are reported in Table 1. Mean arterial and portal venous perfusions were 0.15 ± 0.07 and 1.11 ± 0.34 ml/min/ml, respectively; average VL and V0 were 0.67 ml/ml ± 0.03 and
0.085 ± 0.054, respectively.
Compartmental modeling vs Doppler ultrasonography Bland-Altman plots for Fp, Fa and k, as
given in Figure 4, showed 77% of values falling within 1 SD of the mean for k and Fa, and
72% of values falling within 1 SD of the mean for Fp values. Only one value was outside the
95% agreement interval for Fp and k. The mean difference was close to zero for all three
parameters, namely 0.03 for Fa, 0.11 for Fp and 0.11 for k, and the SD was independent of
increasing mean values. The limits of agreement (Fig. 4) in the assessment of portal and total perfusion where well below respective average values (x-axis), indicative of a good correspondence between methods, whereas the ones obtained in the assessment of arterial perfusion were in the same order of magnitude as the respective average values, suggesting a poor level of agreement.
Sensitivity analysis The sensitivity analysis presented in Figure 5 shows the dependency of arterial and portal perfusion on the distribution volume VL and the blood volume fraction V0.
Metabolic correlates of liver perfusion Hyperinsulinemia did not stimulate total hepatic perfusion. In animals undergoing insulin infusions, ultrasound portal flow was slightly lower already at baseline, and the difference did not change during the infusion as compared with fasting experiments, since a 5-10% decline occurred under both conditions (p=0.04 vs baseline). No differences or changes were detected in arterial and total blood flow. Correlations were sought between arterial or portal venous perfusion and circulating substrate levels, insulin-mediated whole body glucose uptake (wbGU), and endogenous glucose production (EGP). The methods for calculating wbGU and EGP, and the effects of insulin on these variables in these animals have been previously reported23,24; results are here used only to examine their relationship with hepatic perfusion. During the study, portal liver perfusion, as determined by compartmental modeling was positively correlated with endogenous glucose production (r=0.56, p=0.05) (Fig. 6), insulin-stimulated wbGU (r=0.83, p=0.02), triglyceride and free fatty acid levels, and negatively associated with plasma lactate levels (Fig. 7). Relationships were similar whether arterial or portal substrate concentrations were considered. Although insulinemia was not significantly correlated with portal perfusion, lactate, and triglyceride levels, in order to account for the potential influence of different insulin levels on the above associations, the analysis was repeated to discount for this confounder. In multiple regression analysis, most of the associations were found to be independent of the different insulin levels, and portal perfusion remained significantly related with endogenous glucose production (p=0.04), triglyceride (p=0.009), free fatty acids (p=0.006), and lactate levels (p=0.002), but not with wbGU (p=0.25). Only portal lactate levels were positively related with hepatic arterial perfusion (r=0.55, p=0.049).
The current study provides support to the use of PET in the separate quantification of arterial and portal perfusion to the liver, by 1) demonstrating an equivalence with data obtained with the chosen reference method, 2) confirming that the two blood supplies adjust to some extent in a reciprocal fashion to preserve nutrient delivery to the liver, and 3) supporting the concept that portal perfusion is an independent modulator of liver metabolism.
We used a modified one compartmental model27, taking into account the dual blood delivery to the liver. The inaccessibility of the portal vein in humans prompted us to utilize a single-arterial-input mathematical approach to obtain portal tracer estimates. Thus, our model included a hepatic artery, a portal organ and a liver compartment. As compared with previously reported configurations9, 21, an additional compartment had to be introduced between the arterial input and the liver, representing the heterogeneity and slowing of flow at the entry in the liver, in accord with the notion that the distribution of blood flowing across terminal branches of the hepatic artery to the microcirculatory units of the liver, namely the acini, is heterogeneous31, 32. Flow in this compartment was assumed to be constant, and equal to that in the hepatic artery. We used the parameters obtained in the fitting procedure to simulate the time-course of tracer concentrations in each compartment, and showed a quite good correspondence between the model-predicted and the measured curves. This indicates that the model is appropriate in describing the tracer kinetics. To validate our technique in the quantification of liver perfusion, the Doppler ultrasound technique was utilized invasively, as comparative tool. Ultrasonography is one of the standard methods in the assessment of liver blood flow33, 34, 35, but it allows flow (blood volume/time) and not direct perfusion determinations (blood volume/time/tissue volume); in order to obtain PET-comparable results, Doppler measurements were divided by the liver volume, as determined after organ explanting. Bland-Altman analysis30 showed a close agreement between the two techniques for portal and total liver perfusion; arterial perfusion is much lower than portal venous
perfusion, and thus the relative measurement error within each method is expectedly larger, and the agreement between methods poorer. Overall, the portal and arterial contributions to liver perfusion were in the expected order of magnitude, comparing well with those in numerous other studies9, 21, 22, and our perfusion values were similar to, e.g., recent estimates by computerized tomography, showing figures of 0.18±12 (hepatic artery) and 0.93±31 ml/min/ml (portal vein)36, vs 0.15±7 and 1.10±34, respectively, in the current study.
The lack of change in total hepatic perfusion during insulin stimulation confirms previous findings in dogs37, and rules out that this mechanism is per se responsible for the post-prandial rise in splanchnic blood flow, as described in some38, but not all human studies39. The evidence that portal, but not arterial hepatic perfusion was associated with most of the tested metabolic variables demonstrates the importance of measuring independently the two liver blood supplies, since assessing total flow alone would have masked all the associations observed in the current study. This selective involvement of portal perfusion is consistent with the role of the portal circulation in delivering absorbed nutrients and hormonal signals to the liver for subsequent processing. In absolute terms, EGP and lipid levels were suppressed from the fasting to the hyperinsulinemic condition, and liver perfusion was not affected to a significant extent. However, the positive association of portal perfusion and EGP, triglyceride, and fatty acid levels was independent of insulinemia, and suggestive of an active role of portal perfusion in promoting liver discharge and delivery of nutrients for peripheral utilization. This interpretation is consistent with the proportional rise in EGP and hepatic blood flow obtained in humans by adrenaline infusion3, and with results in perfused liver studies, in which the cross-effects of insulin and liver flow on lactate and triglyceride export were examined4, demonstrating an insulin-independent, flow-mediated promotion of de novo lipogenesis and triglyceride release. Because hepatic flow was found to inversely regulate tissue oxygen
extraction in the above study, lactate levels increased in proportion to the flow reduction4. Our negative association between portal perfusion and plasma lactate levels is in line with this previous finding, as well as with observations obtained under more extreme situations, in which a reduction in splanchnic flow decreased the efficiency of hepatic lactate uptake, leading to higher plasma lactate concentrations40. An opposite association occurred between portal lactate levels and hepatic arterial perfusion, which is expected to change somewhat reciprocally to portal perfusion41, 42. Although our current findings are in accord with the available knowledge, attention should be drawn to the following concepts. First, associations in this study could only be explored across study groups with different insulin levels, given a limited sample size, accounting for the invasiveness and complexity required for validation purposes; though multiple regression analysis was performed to discount for the independent effect of insulinemia on the explored relationships, though the effect of insulin on hepatic H215O dwell time, if any, is taken into account in the modelling procedure, and though EGP
was obtained from plasma tracer kinetics by standard procedures24 - caution should be exterted in extrapolating definitive conclusions before broader ad-hoc human studies are performed within individual metabolic states. Second, the physiological regulation of liver metabolism by portal perfusion may be masked or inverted in the diseased liver, in which functional and mechanical abnormalities are primary cause of both impaired perfusion and excess substrate export, thus leading to a negative relationship between these two variables43, 2, as opposed to the positive one shown in this study.
In summary, the use of a single input, one-compartmental model applied to dynamic water PET data to estimate portal venous and total hepatic perfusions shows a good agreement with ultrasonography, and it allows to estimate portal tracer concentrations from arterial measurements, which is essential for its implementation in humans. This technique may be
used in the prognostic assessment and treatment monitoring in liver disease, of which perfusion is a known predictor. Moreover, the correlative findings between portal perfusion and nutrient handling described here are suggestive of a physiological, regulatory role of this process, which may mediate both hepatic and peripheral metabolic responses to the nutritional situation, via meal induced hepatic hyperemia; the latter aspect necessitates confirmatory evaluation in larger studies in humans.
Acknowledgements
The authors are grateful to the staff of the Turku PET Centre for their excellent technical assistance and skills dedicated to this study. This work is part of the project "Hepatic and Adipose Tissue and Functions in the Metabolic Syndrome" (HEPADIP, see http://www.hepadip.org/), which is supported by the European Commission as an Integrated Project under the 6th Framework Programme (contract LSHMCT-2005-018734). The study was further supported by grants from the Academy of Finland (206359 to P.N.), Finnish Diabetes Foundation (to P.I.), EFSD/Eli-Lilly (fellowship to P.I.), Sigrid Juselius Foundation (to P.I.), and Novo Nordisk Foundation (to P.N.).
References
1. Duvoux C,
Radier C, Roudot-Thoraval F, Maille F, Anglade MC, Van Nhieu JT, et al. Low-grade steatosis and major changes in portal flow as new prognostic factors in steroid-treated alcoholic hepatitis. Hepatology 2004;40(6): 1370-8.2. Magalotti D,
Marchesini G, Ramilli S, Berzigotti A, Bianchi G, Zoli M. Splanchnic haemodynamics in non-alcoholic fatty liver disease: effect of a dietary/pharmacological treatment. A pilot study. Dig Liver Dis 2004;36(6): 406-11.3. Bearn AG,
Billing B, Edholm OG, Sherlock S. Hepatic blood flow and carbohydrate changes in man during fainting. J Physiol 1951;115(4): 442-55.4. Topping DL,
Storer GB, Trimble RP. Effects of flow rate and insulin on triacylglycerol secretion by perfused rat liver. Am J Physiol 1988;255(3 Pt 1): E306-13.5. Arai K
, Matsui O, Takashima T, Ida M, Nishida Y. Focal spared areas in fatty liver caused by regional decreased portal flow. AJR Am J Roentgenol 1988;151(2): 300-2.6. Gabata T
, Kadoya M, Matsui O, Ueda K, Kawamori Y, Terayama N, et al. Peritumoral spared area in fatty liver: correlation between opposed-phase gradient-echo MR imaging and CT arteriography. Abdom Imaging 2001;26(4): 384-9.7. Katz ML
and Bergmann EN. Simultaneous measurement of hepatic and portal venous blood flow in the sheep and dog. Amer J Physiol 1969;216: 946-952.8.
Johnson DJ
, Muhlbacher F, Wilmore DW. Measurement of hepatic blood flow.J Surg Res 1985;39(5):470-81.9.
Ziegler SI
, Haberkorn U, Byrne H, Tong C, Kaja S, Richolt JA, et al. Measurement of liver blood flow using oxygen-15 labelled water and dynamic positron emission tomography: limitations of model description. Eur J Nucl Med 1996;23(2): 169-77.10. Greenway CV.
Hepatic plethysmography. In : Lautt WW, ed. Hepatic circulation in health and disease. New York: Raven Press; 1981. p. 41-54.11. Anderson MF
. Pulsed Doppler ultrasonic flowmeter: application to the study of hepatic blood flow. In: Granger DN, Bulkley GB, eds. Measurement of blood flow applications to the splanchnic circulation. Baltimore: Williams & Wilkins; 1981. p. 395-39812. Huet PM,
Goresky CA, Villeneuve JP, Marleau D. Assessment of liver microcirculation in human cirrhosis. J Clin Invest 1982;70: 1234-1244.13. Seifalian AM
, Piasecki C, Agarwal A, Davidson BR. The effect of graded steatosis on flow in the hepatic parenchymal microcirculation. Transplantation 1999;68(6): 780-4.14. Ruotsalainen U
, Raitakari M, Nuutila P, Oikonen V, Sipila H, Teras M, et al. Quantitative blood flow measurement of skeletal muscle using oxygen-15-water and PET. J Nucl Med 1997;38(2): 314-9.15. Viljanen KA
, Lonnroth P, Parkkola R, Peltoniemi P, Asola M, Viljanen T, et al. Glucose uptake and perfusion in subcutaneous and visceral adipose tissue during insulin stimulation in nonobese and obese humans. J Clin Endocrinol Metab 2002;87(8): 3902-10.16. Bergmann SR
, Fox KA, Rand AL, McElvany KD, Welch MJ, Markham J, et al. Quantification of regional myocardial blood flow in vivo with H215O. Circulation 1984;70:724-733.
17. Herscovitch P
, Markham J, Raichle ME. Brain blood flow measured with intravenous H215O. I. Theory and error analysis. J Nucl Med 1983;24: 782-789.18. Raichle ME
, Martin WRW, Herscovitch P, Mintun MA, Markham J. Brain blood flow measured with intravenous H215O. II. Implementation and validation. J Nucl Med 1983;24:790-798.
19. Taniguchi
H
, Kunishima S, Koh T. The reproducibility of independently measuring human regional hepatic arterial, portal and total hepatic blood flow using [15O]water and positron emission tomography. Nucl Med Commun 2003;24(5): 497-501.20. Taniguchi H
, Yamaguchi A, Kunishima S, Koh T, Masuyama M, Koyama H, et al.Using the spleen for time-delay correction of the input function in measuring hepatic blood flow with oxygen-15 water by dynamic PET. Ann Nucl Med 1999;13(4): 215-21.21.
Taniguchi H
, Oguro A, Koyama H, Masuyama M, Takahashi T. Analysis of models for quantification of arterial and portal blood flow in the human liver using PET. J Comput Assist 1996;20(1): 135-44.22. Munk OL
, Bass L, Feng H, Keiding S. Determination of regional flow by use of intravascular PET tracers: microvascular theory and experimental validation for pig livers. J Nucl Med 2003;44(11): 1862-70.23. Iozzo P
, Jarvisalo MJ, Kiss J, Borra R, Naum GA, Viljanen A, et al. Quantification of liver glucose metabolism by positron emission tomography: validation study in pigs. Gastroenterology 2007;132(2): 531-42.24. Iozzo P
, Gastaldelli A, Jarvisalo MJ, Kiss J, Borra R, Buzzigoli E, et al. 18F-FDG assessment of glucose disposal and production rates during fasting and insulin stimulation: a validation study. J Nucl Med 2006;47(6): 1016-22.25. Iozzo P
, Hallsten K, Oikonen V, Virtanen KA, Kemppainen J, Solin O, et al.Insulin-mediated hepatic glucose uptake is impaired in type 2 diabetes: evidence for a relationship with glycemic control. J Clin Endocrinol Metab 2003;88(5): 2055-60.
26. Muscelli E
, Mari A, Natali A, Astiarraga BD, Camastra S, Frascerra S, et al. Impact of incretin hormones on beta-cell function in subjects with normal or impaired glucose tolerance. Am J Physiol Endocrinol Metab 2006;291(6): E1144-50.27. Kety SS, Schmidt CF.
The nitrous oxide method for the quantitative determination of cerebral blood flow in man: theory, procedure and normal values. J Clin Invest 1948;27(4): 476-83.29. Cobelli, C, Foster D, and Toffolo G.
Tracer Kinetics in Biomedical Research: From Data to Model. New York: Kluwer Academic/Plenum, 2001.30.
Bland JM, Altman DG
. Statistical methods for assessing agreement between two methods of clinical measurement. Lancet 1986;1(8476): 307-10.31. Keiding S
, Munk OL, Vilstrup H, Nielsen DT, Roelsgaard K, Bass L. Hepatic microcirculation assessed by positron emission tomography of first pass ammonia metabolism in porcine liver. Liver international 2005;25: 171-176.32. Sherman I A
, Dlugosz J A, Barker F, Sadeghi F M, Pang K S. Dynamics of arterial and portal venous flow interactions in perfused rat liver: an intravital microscopic study. Am J Physiol 1996;271: G201-10.33. Doi R
, Inoue K, Kogire M, et al. Simultaneous measurement of hepatic arterial and portal venous flows by transit time ultrasonic volume flowmetry. Surg Gynecol Obstet 1988;167: 65-69.34. Kleber G
, Steudel N, Behrmann C, et al. Hepatic arteriel flow volume and reserve in patients with cirrhosis: use of intra-arteriel Doppler and adenosine infusion. Gastroenterology 1999;116: 906-914.35. Hubner GH
, Steudel N, Kleber G, Behrmann C, Lotterer E, Fleig WE. Hepatic arteriel blood flow velocities: assessment by transcutaneous and intravascular Doppler sonography. J Hepatol 2000;32: 893-899.36. Materne R,
Van Beers BE, Smith AM, Leconte I, Jamart J, Dehoux JP, et al. Non-invasive quantification of liver perfusion with dynamic computed tomography and a dual-input one-compartmental model. Clin Sci (Lond) 2000;99(6): 517-25.37. Satake S
, Moore MC, Igawa K, Converse M, Farmer B, Neal DW, et al. Direct and indirect effects of insulin on glucose uptake and storage by the liver. Diabetes 2002;51(6): 1663-71.38. Simonsen L
, Coker R, A L Mulla N, Kjaer M, Bulow J. The effect of insulin and glucagon on splanchnic oxygen consumption. Liver 2002;22(6): 459-66.39
.Capaldo B
, Gastaldelli A, Antoniello S, Auletta M, Pardo F, Ciociaro D, et al. Splanchnic and leg substrate exchange after ingestion of a natural mixed meal in humans. Diabetes 1999;48(5): 958-6640. Jakob SM
, Tenhunen JJ, Laitinen S, Heino A, Alhava E, Takala J. Effects of systemic arterial hypoperfusion on splanchnic hemodynamics and hepatic arterial buffer response in pigs. Am J Physiol Gastrointest Liver Physiol 2001;280(5): G819-2741. Seifalian AM
, El-Desoky A, Davidson BR. Hepatic indocyanine green uptake and excretion in a rabbit model of steatosis. Eur Surg Res 2001;33(3): 193-201.42. Lautt WW.
Relationship between hepatic blood flow and overall metabolism: the hepatic arterial buffer response. Fed Proc 1983;42(6): 1662-6.43. Kakkos
SK
, Yarmenitis SD, Tsamandas AC, Gogos CA, Kalfarentzos F. Fatty liver in obesity: relation to Doppler perfusion index measurement of the liver. Scand J Gastroenterol 2000;35(9): 976-80.Table 1.
Individual model parametersStudy number
F
a(ml/min/ml)
(ml/min/ml)
F
p(ml/ml)
V
0V
L 1 0.19 (44) 1.64 (13) 0.08 (7) 0.66 (13) 2 0.17 (29) 1.75 (14) 0.23 (6) 0.67 (5) 3 0.06 (55) 1.08 (7) 0.13 (5) 0.66 (4) 4 0.13 (23) 1.46 (8) 0.09 (7) 0.7 (4) 5 0.14 (23) 1.19 (7) 0.12 (6) 0.64 (5) 6 0.20 (57) 1.04 (20) 0.1 (6) 0.71 (19) 7 0.06 (53) 1.25 (12) 0.11 (6) 0.67 (9) 8 0.29 (52) 0.57 (22) 0.027 (7) 0.63 (5) 9 0.14 (56) 0.59 (66) 0.034 (9) 0.66 (5) 10 - 1.04 (5) 0.07 (6) 0.70 (4) 11 0.04 (52) 1.08 (10) 0.06 (6) 0.70 (9) 12 0.15 (35) 0.91 (12) 0.04 (7) 0.66 (11) 13 0.20 (43) 0.94 (5) 0.057 (6) 0.72 (4) 14 0.21 (36) 1.01 (5) 0.035 (7) 0.68 (3) Mean ± SD 0.15 ± 0.07 1.11 ± 0.34 0.085 ± 0.054 0.67 ± 0.03Values presented are hepatic artery flow (Fa), portal vein flow (Fp), hepatic blood fraction (V0)
and distribution volume (VL). Values in parenthesis represent parameter precision expressed
Figure legends
Figure 1.
Single input model used to estimate liver perfusion. In the model, the whole liver with extra-vascular space, capillaries and cells is simplified as a single compartment. Perfusion from the hepatic artery is represented by Fa and portal vein blood perfusion isrepresented by Fp. The organ outflow rate constant (k) is given by the sum Fa + Fp. CA(t), CV(t)
and CL(t) represent [15O]H2O concentrations in the artery, portal vein and liver compartments,
respectively. CG represents [15O]H2O concentration from a notional gut compartment
(gastrointestinal organs) here defined as portal organ compartment which is assumed to drain into the portal vein.
Figure 2.
Graphical method used to calculate the time delay (∆t) between the arterialsampling site and the liver.
Figure 3.
Typical liver [15O]H2O time-activity curves as measured in arterial, portal venous
blood and in the organ in pig 1. Symbols indicate the measured values, fitted lines are the model-predicted tracer kinetics in each compartment.
Figure 4.
Bland-Altman plots, showing the agreement of ultrasonography and PET estimates of total liver perfusion (k), hepatic arterial (Fa) and portal venous perfusion (Fp). The x-axisand y-axis give mean values, and absolute differences between the two methods.