Publisher’s version / Version de l'éditeur:
Vous avez des questions? Nous pouvons vous aider. Pour communiquer directement avec un auteur, consultez la première page de la revue dans laquelle son article a été publié afin de trouver ses coordonnées. Si vous n’arrivez pas à les repérer, communiquez avec nous à PublicationsArchive-ArchivesPublications@nrc-cnrc.gc.ca.
Questions? Contact the NRC Publications Archive team at
PublicationsArchive-ArchivesPublications@nrc-cnrc.gc.ca. If you wish to email the authors directly, please see the first page of the publication for their contact information.
https://publications-cnrc.canada.ca/fra/droits
L’accès à ce site Web et l’utilisation de son contenu sont assujettis aux conditions présentées dans le site
LISEZ CES CONDITIONS ATTENTIVEMENT AVANT D’UTILISER CE SITE WEB.
ASHRAE Transactions, 90, pp. 212-225, 1984
READ THESE TERMS AND CONDITIONS CAREFULLY BEFORE USING THIS WEBSITE. https://nrc-publications.canada.ca/eng/copyright
NRC Publications Archive Record / Notice des Archives des publications du CNRC :
https://nrc-publications.canada.ca/eng/view/object/?id=6d448233-cbfe-44ae-988e-40b522523532
https://publications-cnrc.canada.ca/fra/voir/objet/?id=6d448233-cbfe-44ae-988e-40b522523532
NRC Publications Archive
Archives des publications du CNRC
This publication could be one of several versions: author’s original, accepted manuscript or the publisher’s version. / La version de cette publication peut être l’une des suivantes : la version prépublication de l’auteur, la version acceptée du manuscrit ou la version de l’éditeur.
Access and use of this website and the material on it are subject to the Terms and Conditions set forth at
The Effect of tracer gas on the accuracy of air-change measurements in
buildings
Ser
THl
N21d
10,
1252
National Research
Conseil national
C. 2
#
Council Canada
de recherches Canada
BrnG
THE EFFECT OF TRACER GAS ON THE ACCURACY OF AIR-CHANGE
MEASUREMENTS I N BUILDINGS
byC.Y. Shaw
Reprinted from
ASHRAE Transactions
Vol. 90, 1984, Part 1A
p. 212
-
225
DBR Paper No. 1252
Division of Building Research
Price $1.50
OTTAWA
4
* I B L I O T H ~ Q U E
I
I
Reh
p r i m .
"- STe- P'JP?c-
= , % T *Y1NRCC
24048
La p r 6 s e n t e Etude compare l e s t a u x d e renouvellement d ' a i r mesur'es
2
p a r t i r d e l ' a f f a i b l i s s e m e n t d e l a c o n c e n t r a t i o n d e d i v e r s gaz t r a g a n t s . Les mesures o n t 6 t 6 e f f e c t u ' e e s d a n s u n e p i k e compl2tement d t a n c h e03
les
t a u x d e f u i t e d ' a i r , s ' g c h e l o n n a n t e n t r e0,05
e t 1 r e n o u v e l l e m e n t d ' a i r p a r h e u r e , p o u v a i e n tGtre
maintenus c o n s t a n t s g r a c eB
un v e n t i l a t e u ra s p i r a n t . Les gaz t r a ~ a n t s 6 t u d i 6 s G t a i e n t
l e
CHq, l e CO, l eC02,
l e N20 e t l e SF6.On
a remarqug une bonne c o r r e s p o n d a n c e e n t r eles
mesures a u gaz t r a g a n t e t l e s mesures d e s d 6 b i t s du v e n t i l a t e u r d a n s l e c a s duCHq,
du CO e tN20.
La concordance G t a i t Egalement s a t i s f a i s a n t e pour l eC02
e t
S F 6 ,mais
l a d i s p e r s i o n d e s donn'ees 6 t a i t beaucoup p l u s i m p o r t a n t e que pour l e s t r o i s a u t r e s gaz.No. 2816
The Effect of Tracer Gas on the Accuracy
of Air-Change Measurements in Buildings
C.Y.
Shaw
ABSTRACT
T h i s s t u d y compares t h e , air-change r a t e s measured u s i n g t h e decay method w i t h s e v e r a l
d i f f e r e n t t r a c e r g a s e s . The t r a c e r - g a s measurements were conducted i n a t i g h t l y s e a l e d room where c o n s t a n t a i r - l e a k a g e r a t e s , r a n g i n g from 0.05 t o 1 a i r changes p e r hour, could be maintained u s i n g an e x h a u s t f a n . The t r a c e r g a s e s i n v e s t i g a t e d were CH4, CO, C02, N20, and SF6. The agreement between t r a c e r - g a s measurements and measured flow r a t e s of t h e e x h a u s t f a n was very good f o r CH4, CO, and N20. The agreement was a l s o s a t i s f a c t o r y f o r C02 and SF6, but t h e s c a t t e r i n t h e i r d a t a was much g r e a t e r than i t was f o r t h e o t h e r t h r e e g a s e s .
INTRODUCTION
The t r a c e r - g a s decay method has been used e x t e n s i v e l y t o measure air-change r a t e s i n b u i l d i n g s . The method i n v o l v e s i n j e c t i n g a s m a l l amount of t r a c e r gas i n t o a b u i l d i n g and t h e n measuring t h e decay i n gas c o n c e n t r a t i o n w i t h time. The air-change r a t e i s c a l c u l a t e d from t h e t r a c e r - g a s decay curve assuming t h e a i r - l e a k a g e r a t e remains c o n s t a n t throughout t h e measurement p e r i o d and t h e incoming a i r mixes w e l l w i t h t h e indoor a i r .
Many t r a c e r g a s e s have been used f o r a i r - i n f i l t r a t i o n s t u d i e s . The choice of a
p a r t i c u l a r gas i s u s u a l l y based on c o n s i d e r a t i o n s of s a f e t y , c o s t , and t h e a v a i l a b l i t y of t h e measuring a p p a r a t u s . Grimsrud e t a l . (1980) and Hunt and Burch (1975), compared air-change r a t e s measured w i t h d i f f e r e n t t r a c e r gases and r e p o r t e d t h a t SF6 gave a s l i g h t l y h i g h e r v a l u e t h a n N20, CHq, and Be. T h e i r comparison was made f o r a i r change r a t e s r a n g i n g from 0.45 t o 1.6 a i r changes per hour ( a c / h ) . B a s s e t t , Shaw, and Evans (1981) a l s o r e p o r t e d t h a t SF6 gave a s l i g h t l y h i g h e r v a l u e than C02 f o r air-change r a t e s g r e a t e r than 0.5 a c / h . Below 0.5 a c / h , however, t h e SF6 r e s u l t s were lower t h a n t h e C02 v a l u e s .
Although t h e f o r e g o i n g s t u d i e s i n d i c a t e d d i f f e r e n c e s i n air-change r a t e s w i t h d i f f e r e n t t r a c e r g a s e s , they d i d not a d d r e s s t h e q u e s t i o n of accuracy. The p r e s e n t s t u d y was,
t h e r e f o r e , planned t o e s t a b l i s h t h e accuracy f o r d i f f e r e n t t r a c e r g a s e s . It d i f f e r s from p r e v i o u s s t u d i e s i n t h a t a wider range of t r a c e r g a s e s was covered, and t h e comparison was made a t lower air-change r a t e s .
C.Y. Shaw, Research O f f i c e r , D i v i s i o n of B u i l d i n g Research, N a t i o n a l Research Council Canada,
TEST FACILITY AND TEST PROGRAM
The t e s t s were conducted i n a t i g h t l y s e a l e d room l o c a t e d on t h e t o p f l o o r of a two-story l a b o r a t o r y - o f f i c e b u i l d i n g . To minimize weather i n f l u e n c e s , t h e suspended c e i l i n g i n t h e t e s t chamber was covered w i t h a p o l y e t h y l e n e s h e e t t o a c t a s t h e t o p boundary of t h e t e s t chamber. T e s t s were conducted w i t h t h e room i n two modes: empty
--
w i t h and w i t h o u t c a r p e t i n g--
and w i t h o f f i c e f u r n i t u r e . The volume of t h e room was 2350 f t 3 (66.5 m3); t h e void volume ( t h e e f f e c t i v e volume) reduced t o 2114 f t 3 (59.9 m3) w i t h f u r n i s h i n g . A t e s t c o n s i s t e d of e s t a b l i s h i n g a s p e c i f i c air-change r a t e i n t h e t e s t room u s i n g a f a n and a flowmeter and t h e n comparing t h i s r a t e w i t h t h e air-change r a t e s measured w i t h two o r more t r a c e r g a s e s .Fan-Induced A i r Change
An air-change r a t e ranging from 0.05 t o 1 a c / h w a s induced and maintained using t h e d u c t and f a n arrangement shown i n f i g u r e 1. The a i r - e x t r a c t i o n r a t e was measured w i t h a laminar a i r f l o w meter ( a c c u r a t e t o 3% of measured flow r a t e ) . The p r e s s u r e d i f f e r e n c e a c r o s s t h e t e s t chamber w a l l was recorded d u r i n g t h e t e s t t o e n s u r e t h a t a l l t e s t chamber a i r exhausted through t h e f a n . The measured volume-flow r a t e was converted t o air-change r a t e u s i n g t h e t o t a l volume of t h e empty room (2350 f t 3 i66.5 m3]) f o r a l l t e s t s .
T r a c e r Gas Air-Change Measurements
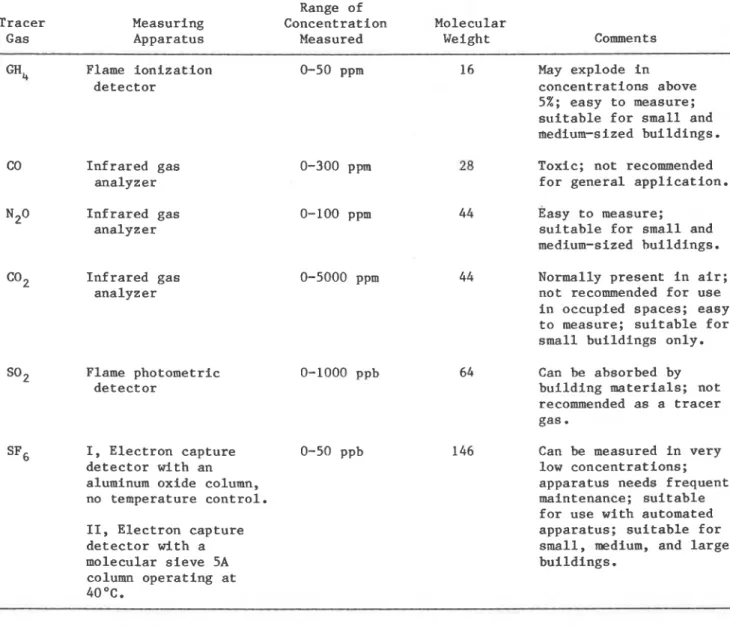
The equipment used t o perform t h e t r a c e r - g a s measurements i s shown i n f i g u r e 1. A des- c r i p t i o n of t h e t r a c e r gases and t h e i r d e t e c t o r s i s given i n t a b l e 1 . S O 2 was used i n i t i a l - l y , but i t was abandoned a f t e r a few t e s t s because of poor r e s u l t s ( s e e t a b l e s 2 and 3 ) .
For each t e s t , a t l e a s t two t r a c e r g a s e s were used. The g a s e s were i n j e c t e d i n t o t h e t e s t room downstream of t h e two mixing -fans through i n d i v i d u a l i n j e c t i o n t u b e s . Mixed gas samples were c o l l e c t e d from t h e chamber upstream of t h e f a n s through i n d i v i d u a l sampling t u b e s . A few of t h e t e s t s measured gas c o n c e n t r a t i o n l e v e l s a t v a r i o u s l o c a t i o n s i n t h e chamber, but no a p p r e c i a b l e d i f f e r e n c e s i n c o n c e n t r a t i o n due t o sampling l o c a t i o n could be d e t e c t e d .
Tracer-gas air-change r a t e was c a l c u l a t e d a s f o l l o w s :
where I = a i r changes p e r u n i t time C, = t r a c e r - g a s c o n c e n t r a t i o n a t time 0 C; = t r a c e r - g a s c o n c e n t r a t i o n a t time t t = measurement p e r i o d ; 1 h TEST RESULTS
The fan-induced and corresponding t r a c e r - g a s air-change r a t e s a r e g i v e n i n t a b l e s 2, 3 and 4 f o r t h e two test-room modes. Each t r a c e r gas i s d i s c u s s e d s e p a r a t e l y i n t h e f o l l o w i n g .
Methane
(a,)
The CH4 r e s u l t s a r e compared w i t h t h e fan-induced air-change r a t e s i n f i g u r e 2 . The two s e t s of measurements a g r e e v e r y w e l l f o r air-change r a t e s between 0.05 and 1 ac/h. The d a t a were f i t t e d t o t h e l i n e a r e x p r e s s i o n
I (Tracer-gas air-change r a t e ) = K(Fan-induced air-change r a t e )
1 A v a l u e of K = 1 i n d i c a t e s t h a t t h e CH4 r e s u l t s a g r e e w i t h t h e f a n r e s u l t s . The s c a t t e r i n t h e CH4 d a t a was w i t h i n 25% of t h e c o r r e l a t i o n l i n e .
CH4 is lighter than air and is, therefore, likely to mix more ~eadily with air than some of the heavier gases. It can be detected quite accurately in concentrations as low as a few parts per million with a chromatograph apparatus equipped with a flame ionization detector. For technical and economic reasons, CH4 is deemed suitable for application in small and medium-sized buildings. CH4 has also been used successfully in houses heated with natural gas (Shaw and Brown 1982). The use of CH4, however, is not without problems. It can form an explosive mixture in air and should, therefore, only be used at a concentration much lower than its explosive limit of 5% by volume.
Carbon Monoxide (CO)
Figure 3 shows good agreement between the CO results and the fan-induced results over the full range of air-change rate tested. The K-value for the CO results was 0.98; that is, the tracer gas underestimated the air-change rate by about 2%. The scatter in the CO data was within f5% of the correlation line.
CO can be most readily measured with an infrared gas analyzer. It should not be used in occupied buildings for health and safety reasons. It has a molecular weight close to that of air
--
one characteristic of a good tracer gas. There was, however, no observable difference between the CH4 and the CO results, even though their molecular weights differ by a factor of 2.Nitrous Oxide (N20)
N20 has been used extensively as a tracer gas for infiltration studies (Hartmann and Muhleback 1980). Figure 4 shows that the agreement between the N20 results and the fan- induced results was as good as those for the two lighter gases. The K-value for the gas was 0.98, indicating an underestimation of the air-change rate by 2%. The scatter in the N20 data was within 25% of the correlation line.
N20 can be measured easily and accurately with an infrared gas analyzer at very low concentrations. Thus, it is suitable for use in small and medium-sized buildings.
Carbon Dioxide (C02)
Figure 5 shows that the C02 results compare favorably with the fan-induced air-change rates. The K-value for C02 was 1.01, indicating an overestimation of the air-change rate by 1%. The scatter in the C02 data, however, was as much as 210% of the value given by the correlation line.
C02 is not considered an ideal tracer gas because it is normally present in air. However, because it is easy to measure, C02 has been used in air-infiltration studies of unoccupied houses.
Sulphur Hexafluoride (SF6)
Figure 6 indicates that, on average, SF underpredicted the air change rate by about 10% (K10.91). The scatter in the SF6 data was slightly greater than flO% of the value given by the correlation line.
DISCUSSION
Although SF6 is the least accurate of the five gases investigated, its use is increasing because it is safe and economical and because it can be sensed at very low concentration values.
S e v e r a l f a c t o r s a f f e c t t h e accuracy of air-change r a t e s measured w i t h SF6. These f a c t o r s a r e :
--
d e t e c t o r t y p e--
measurement chamber s i z e--
measurement technique.F i g u r e 7 compares t h e air-change r a t e s , o b t a i n e d w i t h two d i f f e r e n t t y p e s of SF6 d e t e c t o r s ( t y p e s I and I1 a s d e s c r i b e d i n t a b l e l ) , w i t h t h e f a n r e s u l t s . The t y p e I1
d e t e c t o r , which had a molecular s i e v e 5A column and was c o n t r o l l e d a t 104OF (40°C), a p p e a r s t o g i v e b e t t e r r e s u l t s . U n f o r t u n a t e l y , i t became i n o p e r a b l e a f t e r only a few t e s t s , and f u r t h e r t e s t s could not be conducted t o check i t s c o n s i s t e n c y .
F i g u r e 8 shows a p a i r of SF6 concentration-versus-time curves t h a t were o b t a i n e d s i m u l t a n e o u s l y by t h e two d e t e c t o r s . Although a s t r a i g h t l i n e r e l a t i o n s h i p e x i s t s between t h e l o g a r i t h m s of t h e SF6 c o n c e n t r a t i o n and time, f o r both d e t e c t o r s , t h e s l o p e of t h e two l i n e s ( t h e air-change r a t e ) is q u i t e d i f f e r e n t . T h i s d i f f e r e n c e could be caused by an o f f s e t i n t h e c a l i b r a t i o n of e i t h e r d e t e c t o r , even though i t s o u t p u t was l i n e a r . To i l l u s t r a t e t h i s p o i n t , f i g u r e 8 a l s o shows a l i n e ( l i n e A) t h a t has a s l o p e corresponding t o t h e fan-induced air-change r a t e . T h i s l i n e was c o n s t r u c t e d by s u b t r a c t i n g a c o n s t a n t (0.3 u n i t s ) from t h e c o n c e n t r a t i o n s measured by d e t e c t o r I. A s i m i l a r l i n e could a l s o be c o n s t u c t e d by adding a c o n s t a n t t o t h e c o n c e n t r a t i o n s measured by d e t e c t o r 11. The c a l i b r a t i o n of d e t e c t o r I was checked ( s e e appendix A), and no o f f s e t i n t h e c a l i b r a t i o n was observed. The c a l i b r a t i o n of d e t e c t o r I1 could n o t be checked because i t broke down a f t e r a few t e s t s . Other e r r o r s t h a t can a f f e c t t r a c e r - g a s r e s u l t s a r e s y s t e m a t i c e r r o r caused by incomplete mixing, random e r r o r i n t h e d e t e c t o r o u t p u t , and u n c e r t a i n t y i n t h e f u n c t i o n a l r e l a t i o n s h i p between d e t e c t o r o u t p u t and t r a c e r - g a s c o n c e n t r a t i o n . Although t h e s e e r r o r s can l e a d t o a s much a s a 4% u n d e r e s t i m a t e of t h e air-change r a t e ( B a s s e t t e t a l . 1981), they f a l l s h o r t of e x p l a i n i n g t h e s c a t t e r i n f i g u r e 6 and t h e d i f f e r e n c e i n t h e r e s u l t between t h e two d e t e c t o r s . These
f i n d i n g s , however, would s u g g e s t t h a t t h e r e l a t i v e l y poor accuracy achieved w i t h SF6 could be caused by t h e d e t e c t o r r a t h e r t h a n by t h e gas i t s e l f .
F i g u r e 9 compares t h e c u r r e n t t e s t r e s u l t s measured i n a s i n g l e room w i t h t h o s e o b t a i n e d p r e v i o u s l y i n a two-story unoccupied house ( R a s s e t t e t a l . 1981). Both s t u d i e s used t h e decay method and t h e same d e t e c t o r ( t y p e I ) . The f i g u r e shows t h a t t h e v a l u e s measured i n t h e house a g r e e more c l o s e l y w i t h t h e fan-induced change r a t e than d i d t h e v a l u e s measured i n t h e s i n g l e room. The d i f f e r e n c e , however, was w i t h i n t h e l i m i t s of e x p e r i m e n t a l e r r o r ,
e s t i m a t e d t o be about 10% of t h e measured v a l u e ( B a s s e t t e t a l . 1981).
F i g u r e 9 a l s o shows t h e SFb air-change r a t e s measured i n a n o t h e r p r e v i o u s s t u d y u s i n g t h e c o n s t a n t - c o n c e n t r a t i o n method (Shaw and Brown 1982; Kumar e t a l . 1979). The d a t a were o b t a i n e d i n t h e same two-story house w i t h a d e t e c t o r t h a t was i d e n t i c a l t o d e t e c t o r t y p e I.
There was no o b s e r v a b l e d i f f e r e n c e i n t h e air-change r a t e s measured w i t h t h e decay method and w i t h t h e c o n s t a n t - c o n c e n t r a t i o n method.
One problem always encountered i n a i r - l e a k a g e measurements i s t h a t of e s t i m a t i n g t h e volume of t h e b u i l d i n g t o be used i n c o n v e r t i n g t r a c e r - g a s air-change r a t e s t o volume flow r a t e s . Two methods a r e commonly used; one c a l c u l a t e s t h e t o t a l volume based on t h e o v e r a l l i n s i d e dimensions of t h e space; t h e o t h e r c a l c u l a t e s t h e e f f e c t i v e volume, which i s t h e t o t a l i n t e r i o r volume minus t h e volume occupied by f u r n i t u r e , p a r t i t i o n w a l l s , and o t h e r o b j e c t s w i t h i n t h e space. The d i f f e r e n c e i n volumes c a l c u l a t e d by t h e two methods can be a s much a s 10%.
To determine which of t h e two methods produces t h e b e s t agreement between t r a c e r - g a s and fan-induced r e s u l t s , t h e fan-induced a i r exhaust r a t e s from t h e f u r n i s h e d t e s t chamber ( t e s t mode 2 ) were converted t o air-change r a t e s based on t h e t o t a l i n t e r i o r volume and on t h e e f f e c t i v e volume. The r e s u l t s a r e compared i n f i g u r e 10 f o r both t h e SF6 and N20 t r a c e r - g a s r e s u l t s . The f i g u r e shows t h a t t h e t r a c e r - g a s r e s u l t s a g r e e b e s t w i t h t h e f a n air-change r a t e s based on t h e t o t a l i n t e r i o r volume of 2350 f t 3 (66.5 m3). S i m i l a r r e s u l t s could have been shown f o r CH
,
CO, and C o p . On t h e b a s i s of t h e c u r r e n t s t u d y , it i s suggested t h a t t h e t o t a l i n t e r i o r volume be used when c o n v e r t i n g air-change r a t e s t o volume flow r a t e s .CONCLUSIONS
Following are conclusions that can be drawn from the study:
1. The agreement between fan-induced and tracer-gas measured air-change rates was
slightly worse for SF6 and C02 than that for CH,,, CO, and N20.
2. The current study does not show conclusively that heavy gases produce a less
accurate estimation of air-change rate. It indicates the importance of calibrating the detector.
3. CHq and N20 are suggested as suitable tracer gases for spot measurements in small and medium-sized buildings, provided they are permitted by safety and health regulations.
4.
For continuous measurements using an automatically controlled apparatus, especiallyin large buildings, SF6 is suggested, even though it tends to underestimate the air- change rate.
5. It is suggested that the total interior building volume, based on the overall inside dimensions of the building, be used to convert air-change rates to volume airflow rates.
REFERENCES
Bassett, M.R.; Shaw, C.Y.; and Evans, R.G. 1981. "An appraisal of the sulphur hexafluoride
decay technique for measuring air infiltration rate in buildings." ASHRAE Transactions 87, Part 2, pp. 361-371.
Grimsrud, D.T.; Sherman, M.H.; Janssen, J.E. Jr.; Pearman, A.N.; and Harrje, D.T. 1980. "An
intercomparison of tracer gases used for air infiltration measurements." ASHRAE
Transactions 86, Part 1, pp. 258-267.
Hartmann, P., and Muhlebach, H. 1980. "Automatic measurements of air change rates (decay method) in a small residential huilding without any forced air heating system." Proceedings of 1st AIC Conference, Air Infiltration Instrumentation and Measuring
Techniques, Berkshire
,
U.K.Hunt, C.M., and Burch, D.M. 1975. "Air infiltration measurements in a four-bedroom townhouse
using sulfur hexafluoride as a tracer gas." ASHRAE Transactions 81, Part 1,
pp. 186-201.
Kumar, R.; Ireson, A.D.; and Orr, H.W. 1979. "An automated air infiltration measuring system
using SF6 tracer gas in constant concentration and decay methods." ASHRAE Transactions 85, Part 2, pp. 385-395.
Shaw, C.Y., and Brown, W.C. 1982. "The effect of a conventional gas furnace on the air
leakage of a two-storey detached house." 3d AIC Conference on Energy Efficient Domestic
Ventilation Systems for Achieving Acceptable Indoor Air Ouality, London, September.
ACKNOWLEDGMENT
The author wishes to thank M. Bassett for his contribution in the planning of this study and to acknowledge the assistance of R.G. Evans and J. Payer in the experiment. This paper is a contribution from the Division of Building Research, National Research Council Canada, and is published with the approval of the Director of the Division.
APPENDIX A Detector Calibration
The CO, Cop, and N20 detectors have been periodically calibrated using certified
calibration gases (Bassett et al. 1981). The calibration curve for CO is not linear and was used to correct the measured concentrations. The calibration curves for C02 and N 0 are linear within experimental error (~assett et al. 1981). The CHI detector was califrated by the manufacturer. The calibration curve is linear within fl% of the measuring range.
The type I1 SF6 detector has never been calibrated, but it was operated within the linear range suggested by the manufacturer. The type I SF detector was calibrated using an airtight metal drum as the test space (Bassett et el. 19817. The measured SF6
concentrations, C (in parts per billion), and the corresponding detector output, D (in millivolts), were fitted to the expression C = 0.1712 ~ 1 . ~ 2 2 . Based on this equation, it can be shown that the assumption of a linear sensitivity can lead to a 2% underestimate of air-change rate.
TABLE 1 Range of
Tracer Measuring Concentration Molecular
Gas Apparatus Measured Weight Comments
GH, Flame ionization 0-50 ppm detector CO Infrared gas analyzer N2° Infrared gas analyzer C02 Infrared gas analyzer 0-300 ppm 0-100 ppm 0-5000 ppm S02 Flame photometric 0-1000 ppb detector I, Electron capture detector with an aluminum oxide column, no temperature control. 11, Electron capture detector with a molecular sieve 5A column operating at 40 OC. 0-50 ppb 16 May explode in concentrations above 5%; easy to measure; suitable for small and medium-sized buildings. Toxic; not recommended for general application. Basy to measure;
suitable for small and medium-sized buildings. Normally present in air; not recommended for use in occupied spaces; easy to measure; suitable for small buildings only. Can be absorbed by building materials; not recommended as a tracer gas.
Can be measured in very low concentrat ions; apparatus needs frequent maintenance; suitable for use with automated apparatus; suitable for small, medium, and large buildings.
TABLE 2
Fan-Induced and Tracer-Gas Air-Change Rates, Empty Room
Test No.
Fan-Induced Air-Change Rate, ac/h
TABLE 3
Fan-Induced and Tracer-Gas Air-Change Rates, Empty Room with Carpeted Floor
Test No.
Fan-Induced Air-Change Rate, ac/h
Tracer-Gas Air-Change Rate, ac/h
TABLE 4
Fan-Induced and Tracer-Gas Air-Change Rates, Room with Furniture Fan-Induced Tracer-Gas Air-Change Rate, ac/h Test Air-Change
No. Rate, ac/h*
(3%
co
~ ~ ~ ( 1 1 N2° 1 0 0.009 0.001 0 -0.008 2 0.052 0.051 0.060 0.051 0.038 3 0.052 0.058 0.060 4 0.064 0.078 0.079 5 0.071 0.084 0.089 6 0.100 0.108 0.081 0.116 7 0.102 0.113 0.109 0.112 0.115 8 0.134 0.138 0.133 0.114 0.114 9 0.140 0.144 0.148 0.148 10 0.174 0.179 0.173 0.178 0.153 11 0.203 0.215 0.198 0.215 0.175 12 0.222 0.205 0.195 0.242 13 0.250 0.253 0.247 0.212 14 0.251 0.261 0.261 15 0.321 0.300 0.304 0.265 16 0.350 0.372 0.347 17 0.398 0.412 0.402 0.348 18 0.424 0.437 0.404 0.438 19 0.597 0.618 0.598 0.536 20 0.605 0.654 0.654 0.630 0.639 2 1 0.749 0.814 0.707 0.773 22 0.763 0.746 0.712 0.711 0.668 2 3 0.802 0.809 0.789 0.776 0.653 24 0.804 0.855 0.814 25 0.849 0.909 0.787 0.864 2 6 0.899 0.954 0.919 2 7 0.945 0.916 0.904 0.862 0.832 2 8 1 .OOO 1.013 1.010 0.960 0.915*Fan-induced air-change r a t e = fan rate (ac/h) volume t e s t room
TABLE 5
Fan-Induced and Tracer-Gas Air-Change Rates, Room with Furniture
. . . - . - . . . - . . . . - - - - - - - - - - -
Fan-Induced Tracer-Gas Air-Change Rate, ac/h
Test Air-Change
No. Rate, ac/h** (3%
co
C02 S F ~ ( I ) N2Q**Fan-induced air-change r a t e = fan e x t r a c t i o n r a t e ( a c l h )
ROOM VOLUME 66.5 m3 1 2 3 ~ ft31 PRESSURIZATION APPARATUS TRACER GAS F i g u r e I . S k e t c h of e x p e r i m e n t a l s e t u p a n d a p p a r a t u s F i g u r e 2 . C o m p a r i s o n o f CH4 t r a c e r g a s and f a n - i n d u c e d a i r c h a n g e r a t e s F A N - I N D U C E D A I R C H A N G E RATE. a c / h F i g u r e 3 . C o m p a r i s o n o f CO t r a c e r g a s a n d f a n - i n d u c e d a i r c h a n g e r a t e s
~2~
0 E M P T Y R O O M2
.
o W I T H F U R N I T U R EI
E M P T Y R O O M W I T H C A R P E T E D F L O O R 0 0 . 2 F i g u r e 4 . C o m p a r i s o n o f N 0 t r a c e r g a s 2 a n d f a n - i n d u c e d a i r c h a n g e r a t e s F i g u r e 6. C o m p a r i s o n o f S F 6 t r a c e r g a s a n d f a n - i n d u c e d a i r c h a n g e r a t e s F i g u r e 5. C o m p a r i s o n o f CO 2 . t r a c e r g a s a n d f a n - i n d u c e d a l r c h a n g e r a t e s F A N - I N D U C E D A I R C H A N G E R A T E , a c / h F i g u r e 7. E f f e c t o f e l e c t r o n c a p t u r e d e t e c t o r s o n SF e s t i m a t e d 6 a i r c h a n g e r a t e sL l N E A W I T H S L O P E C O R R E S P O N D I N G TO THE F A N - I N D I I C E D A I R
C
C H A N G E R A T E 2 F A N - I N D U C E D A I R C H A N G E R A T E - 0 . 8 8 4 a c l h \o A I R C H A N C E R A T E a 0 . 8 1 0 a c / h 0 1 . 0 6 3 a c / h 95% C O N F I D E N C E E R R O R a 0 . 0 1 4 a c / h o 0 . 0 1 8 a c / h T I M E . m i n F i g u r e 8 . S a m p l e p l o t o f S F 6 C O n C e n - t r a t i o n v e r s u s t i m e ~ R ~ S J J J ~ > Y ( S I N G L I R O O M ! D D E C A Y M E T H O Dt
P R E V I O U S S T U D Y ( T W O - S T O R E Y U N O C C U P I E D H O U S E 1 a D E C A Y M E T H O D I R E F . 31"7
02
1
0 C O N S T A N T M E T H O D ( R E F . C O N C E N T R A T I O N 41 u t u e F A N - I N D U C E D A I R C H A N G E R A T E , a c / h F i g u r e 9. E f f e c t o f t e s t c h a m b e r s i z e and m e a s u r i n g t e c h n i q u e s o n S F e s t i m a t e d a i r c h a n g e r a t e s 61
EFFECTIVE VOLUME = TOTAL VOLUME - VOLUME OF FURNITUREI
0 8-
.
.
0 . 6-
L I N E OF - A G R E E M E N T 0 a 0 . 4 -/:
:
N 2 0 , 0 SF6.A:-
aFAN FLOW RATE
r a c l h ' ~ ~ ~ TOTAL VOLUME OF ROOM 0 . 2 -
L a
M 2 0 A S F 6-
&"
1ac/hl-
FAN R O W RATEFAN EFFECTIVE VOLUME OF ROOM
O F
I I I I I 0 0 . 2 0 4 0 . 6 0 . 8 1.0 1 . 2 F i g u r e 10. C o m p a r i s o n o f t r a c e r g a s r e s u l t s w i t h f a n - i n d u c e d a i r c h a n g e r a t e s b a s e d o n t h e t o t a l a n d t h e e f f e c t i v e v o l u m e 224DISCUSSION
G. Clausen, Tech. Uni. of Denmark, Lyngby, Denmark: At what level was the
different tracer gases induced to the room in the tests, and which of the
shown methods will be most suitable for air change measurements in rooms with
people present?
Shaw: The tracer gases were introduced into the room near the center of the
room, downstream of the two mixing fans.
T h i s p a p e r , w h i l e b e i n g d i s t r i b u t e d i h r e p r i n t f o r m by t h e D i v i s i o n of B u i l d i n g R e s e a r c h , r e m a i n s t h e c o p y r i g h t of t h e o r i g i n a l p u b l i s h e r . It s h o u l d n o t be r e p r o d u c e d i n whole o r i n p a r t w i t h o u t t h e p e r m i s s i o n of t h e p u b l i s h e r . A l i s t of a l l p u b l i c a t i o n s a v a i l a b l e f r o m t h e D i v i s i o n may be o b t a i n e d by w r i t i n g t o t h e P u b l i c a t i o n s S e c t i o n , D i v i s i o n o f B u i l d i n g R e s e a r c h , N a t i o n a l R e s e a r c h C o u n c i l o f C a n a d a , O t t a w a , O n t a r i o ,