HAL Id: inserm-00730431
https://www.hal.inserm.fr/inserm-00730431
Submitted on 10 Sep 2012
HAL is a multi-disciplinary open access
archive for the deposit and dissemination of
sci-entific research documents, whether they are
pub-lished or not. The documents may come from
teaching and research institutions in France or
abroad, or from public or private research centers.
L’archive ouverte pluridisciplinaire HAL, est
destinée au dépôt et à la diffusion de documents
scientifiques de niveau recherche, publiés ou non,
émanant des établissements d’enseignement et de
recherche français ou étrangers, des laboratoires
publics ou privés.
Arterial Spin Labeling at 3T in semantic dementia:
perfusion abnormalities detection and comparison with
FDG-PET
Isabelle Corouge, Aurore Esquevin, Florence Le Jeune, Jean-Christophe Ferré,
Elise Bannier, Catherine Merck, Serge Belliard, Christian Barillot, Jean-Yves
Gauvrit
To cite this version:
Isabelle Corouge, Aurore Esquevin, Florence Le Jeune, Jean-Christophe Ferré, Elise Bannier, et al..
Arterial Spin Labeling at 3T in semantic dementia: perfusion abnormalities detection and comparison
with FDG-PET. MICCAI 2012 Workshop on Novel Biomarkers for Alzheimer’s Disease and Related
Disorders, Oct 2012, Nice, France. pp.32-40. �inserm-00730431�
Arterial Spin Labeling at 3T in semantic
dementia: perfusion abnormalities detection and
comparison with FDG-PET
Isabelle Corouge1,2,3, Aurore Esquevin1,2,3,5, Florence Lejeune4,
Jean-Christophe Ferr´e1,2,3,5, Elise Bannier1,2,3,5, Catherine Merck6, Serge
Belliard6, Christian Barillot1,2,3,5, and Jean-Yves Gauvrit1,2,3,5
1 INRIA, VisAGeS Project-Team, F-35042 Rennes, France 2
University of Rennes I, CNRS, UMR 6074, IRISA, F-35042 Rennes, France 3 INSERM, U746, F-35042 Rennes, France
4
Nuclear Medicine Department, Centre Eug`ene Marquis, F-35033 Rennes, France 5
Department of Radiology, University Hospital of Rennes, F-35033 Rennes, France 6 Department of Neurology, University Hospital of Rennes, F-35033 Rennes, France
Abstract. Arterial Spin Labeling (ASL) is a non invasive perfusion imaging technique which has shown great diagnosis potential in demen-tia. However, it has never been applied to semantic dementia (SD), a rare subtype of frontotemporal lobar degeneration characterized by the gradual loss of conceptual knowledge, which is actually explored by a now well established marker of SD:18fluorodeoxyglucose-positron emis-sion tomography (FDG-PET) imaging. Although ASL and FDG-PET respectively measure perfusion and metabolism, they have been shown to be strongly correlated. We propose to explore the ability of ASL to detect perfusion abnormalities in SD in comparison with FDG-PET. Us-ing patients and healthy subjects data from an ongoUs-ing clinical study, we apply our analysis framework starting with visual comparison of ASL and FDG-PET, and focusing on ASL data preprocessing and statistical analysis at the individual and group level. Preliminary results yield con-cordant observations between ASL and FDG-PET as well as expected hypoperfusions in SD, namely in the left temporal lobe, thus suggesting the potential of ASL to assess perfusion impairments in SD.
Keywords: ASL, FDG-PET, MRI, semantic dementia.
1
Introduction
Arterial spin labeling (ASL) measures brain perfusion by using blood water pro-tons as an endogenous tracer. An inversion pulse labels the inflowing blood and after a delay called inversion time, a labeled image of the volume of interest is acquired. The subtraction of the labeled image from a control image, i.e., non labeled, reflects the quantity of spins that have perfused the imaged volume, producing a perfusion-weighted (PW) image. The signal to noise ratio of the PW map is increased by acquiring repeated pairs of label/control images. Cere-bral blood flow (CBF in ml/100g/min units) is estimated by application of a quantification model.
As it is a non invasive, reproducible and quantitative technique, ASL has been used in numerous clinical applications [1]. Its diagnosis potential has namely been shown in dementia, for instance to differentiate Alzheimer’s disease (AD) from frontotemporal dementia or to predict cognitive decline and conversion from Mild Cognitive Impairment to AD [2,3]. Previous studies have also compared ASL with 18fluoro-deoxyglucose positron emission tomography (FDG-PET), which
remains the reference technique. Indeed, FDG-PET imaging is particularly sen-sitive in detecting disease-related functional changes [4] and it has been well established as a marker of degenerative dementia. Though ASL and FDG-PET image different physiological processes, perfusion on the one side and glucidic metabolism on the other side, they are generally tightly coupled at rest [5] and they were shown to identify similar abnormality patterns in AD [6].
To our knowledge, ASL has never been applied to semantic dementia (SD). SD is a rare subtype of frontotemporal lobar degeneration [7] characterized by a gradual loss of conceptual knowledge and of word meaning. The SD syndrome arises out of the temporal lobe, usually showing atrophy often bilateral but mostly left-sided on structural MRI, as well as hypometabolism, also predomi-nantly on the left side, in FDG-PET [8].
In this paper we explore the ability of ASL to detect perfusion abnormalities in SD in comparison with FDG-PET, relying on data extracted from an ongoing study. Section 2 describes the population, the imaging protocols as well the methodological framework for data processing and analysis. Section 3 presents preliminary results before discussion in Sect. 4.
2
Materials and Methods
2.1 Participants
Fifteen subjects have been included in the study so far: 6 patients fulfilling the SD diagnostic criteria [9] (2 males, 4 females, mean age = 63.3 ± 2.4 yo), and 9 healthy control subjects (3 males, 6 females, mean age = 60.8 ± 3.9 yo), matched for sex and age (Mann-Whitney U test with p = 0.28). All the subjects underwent an MRI scan, only patients underwent a FDG-PET examination. In addition, cognitive performance was assessed for all the subjects. Note that these neuropsychological data are not included in the analysis presented in this paper.
2.2 Data Acquisition
Anatomical and perfusion MRI Data Patients and control subjects were scanned on a 3T whole body Siemens MR scanner (Magnetom Verio, Siemens Healthcare, Erlangen, Germany) with a 32-channel head coil. Anatomical data included a high resolution 3D T1-weighted MPRAGE sequence (3D T1) with the following imaging parameters: TR/TE/TI = 1900/2.27/900 ms, 256×256 mm2
FOV and 176 sagittal slices, 1x1x1 mm3resolution, parallel imaging GRAPPA2.
Perfusion data were acquired using a pulsed ASL PICORE Q2TIPS sequence with total scan time of approximately 6 minutes. The imaging parameters were:
TR/TE = 3000/18 ms, flip angle 90o, matrix size 64×64, TI
1/TI1s/TI2 =
700/1500/1800 ms. The labeling slice was 10 cm thick and was placed 3 cm below the acquisition volume. Crusher was set to achieve a cutoff velocity of 4 cm/s. Fourteen axial slices were acquired sequentially from inferior to superior in the AC-PC plane, with 3×3 mm2 in-plane resolution, 7 mm slice thickness
and 0.7 mm gap. One control volume plus 60 repetitions, i.e., label/control pairs, (121 volumes), finally composed the ASL data series.
PET Data Only patients underwent the FDG-PET protocol imaging which was conducted on a discovery ST PET/CT Imaging system, GE, Healthcare, Waukesha, WI. PET/CT imaging was initiated 30 minutes after intravenous injection of 148 MBq of18FDG and was conducted at rest in a dark quiet room.
The in-plane PET image resolution was 2.34×2.34 mm2, with 3.27 mm slice
thickness. Non-contrast CT acquisitions were performed (2 mm slice thickness) for anatomical co-registration, attenuation and scatter correction of the PET images.
2.3 Data Pre-Processing
Pre-processing of the image data was performed with an inhouse pipeline using MATLAB (v. 7.12.0, The MathWorks Inc., 2011) and the SPM8 toolbox (Well-come Department of Imaging Neuroscience at University College London, UK) as follows:
Anatomical data The anatomical 3D T1 was first denoised using the NL-means algorithm by [10] and corrected for intensity inhomogeneity using SPM. The images were then segmented into grey matter (GM), white matter (WM) and cerebro-spinal fluid (CSF) probability maps using the MNI template tissue probability as an a priori for brain tissue classification. Estimated by this same unified segmentation model SPM routine, spatial normalisation parameters were applied to register the 3D T1 volume to the MNI space.
ASL data The ASL data series was motion corrected by a rigid body transform minimising the sum of squared differences cost function. A two-pass procedure first realigned all the control and label volumes onto the first volume of the series, then registered the series to the mean of the images aligned in the first pass.
The motion-corrected ASL series was co-registered to the 3D T1 using a rigid transform. The latter was estimated by maximizing normalised mutual information between the mean control image, i.e., the average of all the realigned control volumes, and the 3D T1 GM map.
Letting aside the first volume of the series, pM0, the co-registered ASL images
were pairwise subtracted (control - label images) to produce a series of perfu-sion weighted maps, which was subsequently averaged to produce a perfuperfu-sion weighted (PW) map.
The PW map was quantified to a CBF map by applying the standard kinetic model [11,12] :
f = λ∆M
2αT I1exp(−T I2+idxsl∗T Isl)/T1bM0
(1) where f is the CBF map, ∆M is the perfusion weighted map, λ = 0.9 ml.g−1 is the blood/tissue water partition coefficient, M0 represents the equilibrium
magnetization of arterial blood and is approximated by the first volume of the series pM0, α = 0.95 measures the labeling efficiency, T I2 = 1800 ms is the
inversion time of the ASL sequence, idxsl is the slice index, starting from 0 for
the first acquired slice, TIsl = 45 ms is the duration of acquisition of one slice,
TI1 = 700 ms is the temporal width of the bolus, T1b = 1500 ms is the T1 of
blood [13].
Due to its inherent low resolution, the intensity in a single voxel results from a mixture of the GM, WM, CSF measured signals and ASL suffers from severe partial volume effect. These partial volumes effects (PVE) were corrected as described in [14]. This approach considers the perfusion signal in a voxel as a weighted sum of the GM and WM perfusion signals where the weights are given by the 3D T1 brain tissues probability maps. A total variation optimization algorithm estimates the respective contributions of GM/WM perfusion signals yielding high resolution perfusion maps, henceforth called PVE CBF maps.
In order to perform inter-subject voxelwise comparison, the PVE CBF maps, already aligned to the 3D T1 image, were registered to MNI space using the spatial normalisation parameters estimated on the anatomical data.
As CBF varies greatly across individuals, the PVE CBF maps were intensity normalised to account for a global interindividual variability. The normalisation factor was set to the mean of the PVE CBF values over the voxels having a grey matter probabilty superior to 0.7.
PET Data The attenuation corrected PET images were coregistered to the 3D T1 image using the normalised mutual information cost function. Spatial nor-malisation to the MNI space was then performed using the parameters estimated for the 3D T1.
2.4 Data Analysis
Data analysis is performed in 3 steps: first, the data were visually evaluated, with a focus on the concordance between perfusion and metabolism as observed in the images. Then ASL data were quantitatively analysed at an individual level to identify perfusion defects in each patient based on a template approach. Last, group analysis was done voxelwise and in regions of interest.
Note that only voxels where the brain tissues probability exceeded 0.5 were tested in the subsequent statistical analyses. For voxelwise comparisons, the data were smoothed with a 8×8×8 mm3 Gaussian kernel.
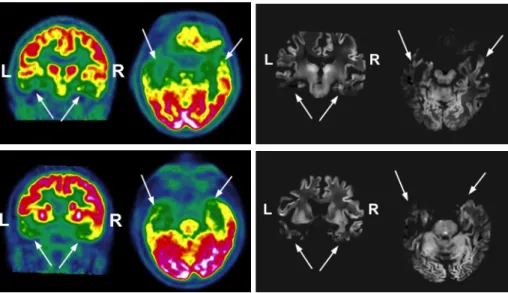
Fig. 1. Visual comparison of ASL and FDG-PET illustrated for 2 patients. Left, PET data with metabolism decreasing from red to green; right, PVE CBF maps. The white arrows indicate the hypometabolic and hypoperfused areas.
Qualitative analysis For each patient, a radiologist visually inspected the PVE CBF and PET maps seeking to detect any metabolic and perfusion ab-normalities. The reading focused on the superior frontal, basifrontal, anterior and posterior temporal, parietal and occipital areas for the right and left hemi-spheres.
Voxelwise Individual Statistical Analysis of ASL Data Hypo- and hyper-perfusions were sought at an individual level by comparing each patient ASL map to an ASL template. Assuming a Gaussian distribution in each voxel, such a template is defined as the mean and associated standard deviation map estimated from a set of input maps. Using the set of smoothed PVE corrected, spatially and intensity normalised CBF maps from the control group as inputs, the ASL template was built as described in [15] and is considered as a reference for brain normal perfusion for an age- and sex-matched population with respect to the patient group.
Voxelwise comparisons between the individual maps and the ASL template were run based on one-tailed t-tests1 as implemented in the SPM General
Lin-ear Model (SPM). Differences were considered significant at the cluster level at a threshold of p < 0.05 (Family-wise-error (FWE) corrected for multiple com-parisons at the cluster level with a cluster defining threshold of p < 0.001).
1 v− ˆµ ˆ
σ√1/N +1 ∼ T N −1
where v is the voxel value to be tested, and ˆµ, ˆσ and N are respectively the sample mean, variance and size.
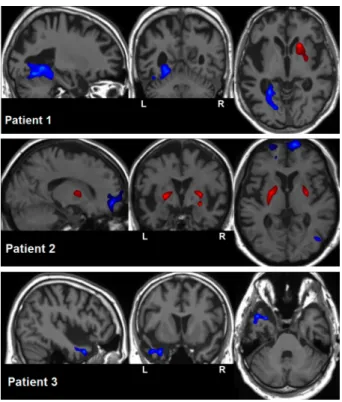
Fig. 2. Voxelwise individual statistic analysis: for 3 patients, detected hypoperfusions (blue) and hyperperfusions (red) superimposed on their anatomical map.
Voxelwise Group Statistical analysis The smoothed PVE corrected, spa-tially and intensity normalised CBF maps of both control and patient groups were fed to GLM one-tailed two-sample t-tests analysis. Between group compar-isons were considered significant at the cluster level at a threshold of p < 0.05, FWE corrected, with a cluster defining threshold of p < 0.001.
ROIs Group Statistical analysis Regions of interest (ROIs) were extracted from the PVE corrected, spatially and intensity normalised CBF maps using the Automated Anatomical Labeling (AAL) template [16]. For each hemisphere, the segmented ROIs were: the brain lobes (frontal, temporal, parietal, occipi-tal), the cingulate gyrus, the insula and the deep grey nuclei (putamen, caudate, thalamus). Contrary to the AAL lobe definition, the hippocampus, the parahip-pocampus and the temporal pole were not included in the limbic but in the temporal lobe as described in [17].
For each subject, the average CBF value was computed over each ROI, left and right, excluding voxels with GM probability less than 0.7. A tailed two-samples t-test tested the difference between the control group and the patients group at a significant level of α = 0.05.
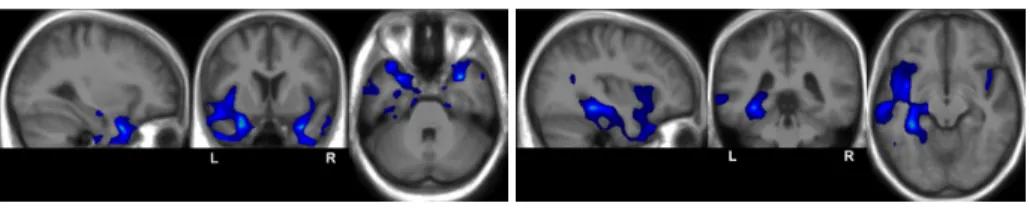
Fig. 3. Voxelwise group statistic analysis: superposition of the detected hypoperfusions (blue) to the average anatomy.
3
Results
Qualitative Analysis The visual inspection of the PVE CBF maps and FDG-PET data showed good agreement between the two modalities as illustrated in Fig. 1. For all the 6 patients, hypoperfusion and hypometabolism were observed bilaterally in the basifrontal as well as in the anterior temporal lobe though the left side was more severely affected. The posterior part of the temporal lobe was particularly impaired on the left side. For all the subjects but one, the left parietal lobe exhibited hypo- ASL and FDG-PET signals while its right counterpart presented normal imaging.
Voxelwise Individual Statistical Analysis of ASL Data Significant per-fusion deviations from the ASL template were found for 3 out of the 6 patients, as illustrated in Fig. 2. Hypoperfusions could be observed in the left fusiform and lingual gyri for patient 1, in the right fusiform gyrus and in the bilateral basifrontal area for patient 2 and in the left anterior temporal area for patient 3. Hyperperfusions could also be observed in the lenticular nucleus, on the right side for patient 1 and on both sides for patient 2. As for the remaining 3 patients, no significant cluster was found.
Voxelwise Group Statistical analysis The voxelwise group statistical anal-ysis detected hypoperfusions in the left temporo-parietal and temporo-occipital regions, and in the left and right temporal and insular regions. However, hypop-erfusions globally predominate in the left anterior temporal region as shown in Fig. 3. No hyperperfusion was detected at the group level.
ROIs Group Statistical analysis The ROIs statistical analysis found signifi-cant differences between the patients and control group in the left temporal lobe (p = 0.0004), in the left parietal lobe (p = 0.02) and in the insula also on the left side (p = 0.002).
4
Discussion
We have applied our framework for ASL data processing to SD, a rare neu-rodenerative disease. Our preliminary results are encouraging as they globally
comply with the perfusion abnormalities expected in SD. First, the qualitative comparison of the PVE CBF maps and the FDG-PET data showed a good agree-ment between the two modalities with concordant regional hypoperfusion and hypometabolism. Second, the group analysis identified perfusion abnormalities in the frontal, insular and temporal regions, particularly pronounced on the left side as already reported in the literature. More surprising were the detected hy-poperfusions in the left temporo-parietal and temporo-occipital regions. They might be related to the stage of the disease, and/or to an impairment of the fasciculi involved in SD [18] (arcuate and fronto-parietal longitudinal superior tracts). An analysis of the atrophy might also shed light on this result. Similary, hyperperfusions of the lenticular globus detected at the individual level should be further investigated. Further analysis on a larger database might reveal more insight on these preliminary findings. Additional subjects are planned to be in-cluded in the next few months to increase the population of each group to at least 15.
This paper focused on the quantitative analysis of ASL data. Future work will include a quantitative analysis of PET data in which hypometabolism should be automatically detected, followed by a quantitative comparison between ASL and FDG-PET. Atrophy and cortical thickness will also be analysed from the 3D T1 structural data. Eventually, correlation of the imaging data with the neuropsychological scores will be studied. Ultimately, such a study might lead to demonstrate the ability of ASL to highlight cerebral abnormalities that give rise to cognitive deficit patterns in SD. This would allow improved clinical care and functional follow-up of SD patients as ASL is a non invasive and easily repeatable technique.
References
1. Detre, J.A., Rao, H., Wang, D.J., Chen, Y.F., Wang, Z.: Applications of Arterial Spin Labeled MRI in the brain. JMRI 35(5) (2012) 1026–37
2. Hu, W.T., Wang, Z., Lee, V.M., Trojanowski, J.Q., Detre, J.A., Grossman, M.: Distinct cerebral perfusion patterns in FTLD and AD. Neurology 75(10) (2010) 881–8
3. Chao, L.L., Buckley, S.T., Kornak, J., Schuff, N., Madison, C., Yaffe, K., Miller, B.L., Kramer, J.H., Weiner, M.W.: ASL perfusion MRI predicts cognitive decline and conversion from MCI to dementia. Alzheimer Dis Assoc Disord. 24(1) (2010) 19–27
4. Jagust, W.: Positron emission tomography and magnetic resonance imaging in the diagnosis and prediction of dementia. Alzheimer’s dementia 2(1) (2006) 36–42 5. Musiek, E.S., Chen, Y., Korczykowski, M., Saboury, B., Martinez, P.M., Reddin,
J.S., Alavi, A., Kimberg, D.Y., Wolk, D.A., Julin, P., Newberg, A.B., Arnold, S.E., Detre, J.A.: Direct comparison of fluorodeoxyglucose positron emission tomogra-phy and arterial spin labeling magnetic resonance imaging in alzheimer’s disease. Alzheimer’s dementia : the journal of the Alzheimer’s Association 8(1) (2012) 51–9 6. Chen, Y., Wolk, D.A., Reddin, J.S., Korczykowski, M., Martinez, P.M., Musiek, E.S., Newberg, A.B., Julin, P., Arnold, S.E., Greenberg, J.H., Detre, J.A.:
Voxel-level comparison of arterial spin-labeled perfusion MRI and FDG-PET in Alzheimer disease. Neurology 77(22) (2011) 1977–85
7. Hodges, J.R., Patterson, K.: Semantic dementia: a unique clinicopathological syn-drome. Lancet Neurol 6(11) (2007) 1004–14
8. Desgranges, B., Matuszewski, V., Piolino, P., Chetelat, G., Mezenge, F., Landeau, B., de la Sayette, V., Belliard, S., Eustache, F.: Anatomical and functional alter-ations in semantic dementia: a voxel-based MRI and PET study. Neurobiol Aging 28(12) (2007) 1904–13
9. Neary, D., Snowden, J.S., Gustafson, L., Passant, U., Stuss, D., Black, S., Freed-man, M., Kertesz, A., Robert, P.H., Albert, M., Boone, K., Miller, B.L., Cummings, J., Benson, D.F.: Frontotemporal lobar degeneration: a consensus on clinical diag-nostic criteria. Neurology 51(6) (1998) 1546–54
10. Coup´e, P., Yger, P., Prima, S., Hellier, P., Kervrann, C., Barillot, C.: An optimized blockwise nonlocal means denoising filter for 3-d magnetic resonance images. IEEE TMI 27(4) (2008) 425–441
11. Buxton, R., Frank, L., Wong, E., Siewert, B., Warach, S., Edelman, R.: A general kinetic model for quantitative perfusion imaging with arterial spin labeling. MRM 40(3) (1998) 383–396
12. C¸ avu¸so˘glu, M., Pfeuffer, J., U˘gurbil, K., Uluda˘g, K.: Comparison of pulsed arterial spin labeling encoding schemes and absolute perfusion quantification. MRI 27 (2009) 1039–1045
13. Wang, Y., Saykin, A.J., Pfeuffer, J., Lin, C., Mosier, K.M., Shen, L., Kim, S., Hutchins, G.D.: Regional reproducibility of pulsed arterial spin labeling perfusion imaging at 3T. NeuroImage 54(2) (2011) 1188 – 1195
14. Petr, J., Ferr´e, J.C., Gauvrit, J.Y., Barillot, C.: Denoising arterial spin labeling MRI using tissue partial volume. In: SPIE Medical Imaging 7623 (2010)
15. Petr, J., Ferr´e, J.C., Bannier, E., Raoult, H., Gauvrit, J.Y., Barillot, C.: Construc-tion and evaluaConstruc-tion of a quantitative arterial spin labeling brain perfusion template at 3T. In: IEEE ISBI (2011) 1035–38
16. Tzourio-Mazoyer, N., Landeau, B., Papathanassiou, D., Crivello, F., Etard, O., Delcroix, N., Mazoyer, B., Joliot, M.: Automated anatomical labeling of activations in SPM using a macroscopic anatomical parcellation of the MNI MRI single-subject brain. NeuroImage 15(1) (2002) 273–289
17. Harnsberger, H.R. and Osborn, A.G. and Macdonald, A.: In: Diagnostic and Sur-gical Imaging Anatomy: Brain, Head & Neck, Spine. Amirsys (2006) 28
18. Acosta-Cabronero, J., Patterson, K., Fryer, T.D., Hodges, J.R., Pengas, G., Williams, G.B., Nestor, P.J.: Atrophy, hypometabolism and white matter abnor-malities in semantic dementia tell a coherent story. Brain 134(7) (2011) 2025–35