Coding of Electric Pulse Trains Presented through
Cochlear Implants in the Auditory Midbrain of Awake
Rabbit: Comparison with Anesthetized Preparations
The MIT Faculty has made this article openly available. Please share
how this access benefits you. Your story matters.
Citation
Chung, Y., K. E. Hancock, S.-I. Nam, and B. Delgutte. “Coding of
Electric Pulse Trains Presented through Cochlear Implants in the
Auditory Midbrain of Awake Rabbit: Comparison with Anesthetized
Preparations.” Journal of Neuroscience 34, no. 1 (December 31,
2013): 218–231.
As Published
http://dx.doi.org/10.1523/jneurosci.2084-13.2014
Publisher
Society for Neuroscience
Version
Final published version
Citable link
http://hdl.handle.net/1721.1/91535
Terms of Use
Article is made available in accordance with the publisher's
policy and may be subject to US copyright law. Please refer to the
publisher's site for terms of use.
Systems/Circuits
Coding of Electric Pulse Trains Presented through Cochlear
Implants in the Auditory Midbrain of Awake Rabbit:
Comparison with Anesthetized Preparations
Yoojin Chung,
1,2Kenneth E. Hancock,
1,2Sung-Il Nam,
2,3and Bertrand Delgutte
1,2,41Eaton-Peabody Laboratories, Massachusetts Eye and Ear Infirmary, Boston, Massachusetts 02114,2Department of Otology and Laryngology, Harvard
Medical School, Boston, Massachusetts 02115,3Department of Otolaryngology, School of Medicine, Keimyung University, Daegu, South Korea 700-712, and 4Research Laboratory of Electronics, Massachusetts Institute of Technology, Cambridge, Massachusetts 02139
Cochlear implant (CI) listeners show limits at high frequencies in tasks involving temporal processing such as rate pitch and interaural
time difference discrimination. Similar limits have been observed in neural responses to electric stimulation in animals with CI; however,
the upper limit of temporal coding of electric pulse train stimuli in the inferior colliculus (IC) of anesthetized animals is lower than the
perceptual limit. We hypothesize that the upper limit of temporal neural coding has been underestimated in previous studies due to the
confound of anesthesia. To test this hypothesis, we developed a chronic, awake rabbit preparation for single-unit studies of IC neurons
with electric stimulation through CI. Stimuli were periodic trains of biphasic pulses with rates varying from 20 to 1280 pulses per second.
We found that IC neurons in awake rabbits showed higher spontaneous activity and greater sustained responses, both excitatory and
suppressive, at high pulse rates. Maximum pulse rates that elicited synchronized responses were approximately two times higher in
awake rabbits than in earlier studies with anesthetized animals. Here, we demonstrate directly that anesthesia is a major factor
under-lying these differences by monitoring the responses of single units in one rabbit before and after injection of an ultra-short-acting
barbiturate. In general, the physiological rate limits of IC neurons in the awake rabbit are more consistent with the psychophysical limits
in human CI subjects compared with limits from anesthetized animals.
Key words: anesthesia; cochlear implant; inferior colliculus; temporal coding
Introduction
Although cochlear implants (CIs) restore open-set speech
com-prehension in a majority of deaf subjects, most CI users still have
difficulty with pitch perception, speech reception in noise, and
sound localization even with bilateral implantation. These
diffi-culties may stem in part from limitations in temporal processing.
A majority of CI users can discriminate the rate of electric pulse
trains up to
⬃300 pulses per second (pps), with a few exceptional
subjects showing limits as high as 1000 pps (
Townshend et al.,
1987
;
Kong and Carlyon, 2010
;
Moore and Carlyon, 2010
).
Re-sponses of auditory neurons to pulse trains delivered through CIs
also show an upper limit of temporal coding, but the
physiolog-ical limits in anesthetized animals are lower than the perceptual
limits in human CI users. For the most part, neurons in the
infe-rior colliculus (IC) show sustained and pulse-locked responses to
periodic pulse trains only up to 30 –300 pps (
Snyder et al., 1995
;
Vollmer et al., 1999
,
2005
;
Middlebrooks and Snyder, 2010
;
Han-cock et al., 2012
,
2013
). A similar pulse rate limit of 10 –200 pps is
observed for neural sensitivity to interaural time differences
(ITDs) in IC neurons (
Smith and Delgutte, 2007
;
Hancock et al.,
2010
,
2012
), but this limit is lower than that the 250 – 600 pps
limit for perceptual ITD sensitivity in CI listeners (
Laback et al.,
2007
;
van Hoesel, 2007
). In anesthetized animals, the underlying
reason for the limits on temporal coding and ITD sensitivity is
that the majority of IC neurons only respond to the onset of pulse
trains at rates
⬎100–200 pps. This lack of sustained responses in
IC of anesthetized animals is inconsistent with percepts lasting
throughout the stimulus even at much higher pulse rates in most
CI users, although some subjects experience loudness adaptation
(
Tang et al., 2006
).
We hypothesize that temporal coding, ITD sensitivity, and
sustained firing to CI stimulation at high pulse rates may be
un-derestimated due to the effect of anesthesia. Barbiturate
anesthe-sia has been shown to reduce both spontaneous and evoked
neural activity in the IC of normal-hearing animals (
Bock and
Webster, 1974
;
Kuwada et al., 1989
;
Torterolo et al., 2002
), which
is consistent with an enhancement of inhibitory influences.
Sim-ilar differences between anesthetized and awake conditions have
been observed in primary cortex of deaf marmosets and guinea
Received May 16, 2013; revised Oct. 21, 2013; accepted Nov. 13, 2013.Author contributions: Y.C. and B.D. designed research; Y.C. and S.-I.N. performed research; Y.C. and K.H. analyzed data; Y.C. and B.D. wrote the paper.
This work was supported by the National Institutes of Health (Grants R01 DC005775 and P30 DC005209), Mas-sachusetts Eye and Ear (Curing Kids Fund), and the Hearing Health Foundation (Emerging Research Grant to Y.C.). We thank Connie Miller and Melissa McKinnon for technical assistance and Saori Fukuda, Csilla Haburcakova, Andrew McCall, and Michael Kaplan for advice regarding surgical methods for cochlear implantation in rabbits.
The authors declare no competing financial interests.
Correspondence should be addressed to Yoojin Chung, Eaton-Peabody Laboratory, Massachusetts Eye and Ear Infirmary, Boston, MA 02114. E-mail: [email protected].
DOI:10.1523/JNEUROSCI.2084-13.2014
pigs with CI stimulation (
Johnson et al., 2011
;
Kirby and
Middle-brooks, 2012
). A degradation of temporal coding by anesthesia
has been reported in the IC (
Tollin et al., 2004
;
Song et al., 2011
)
and auditory cortex (
Ter-Mikaelian et al., 2007
) of
normal-hearing animals.
We developed an awake rabbit model of CIs for single-unit
recording from the IC to eliminate the confound of anesthesia.
Although awake preparations are increasingly common in
single-unit studies of normal-hearing animals, they have not yet been
used to study responses of subcortical auditory neurons to CI
stimulation in deaf animals. Our results show higher pulse rate
limits of temporal coding in the awake rabbit compared with
earlier results from anesthetized preparations. We also found
un-synchronized, sustained responses at high pulse rates that are
rarely observed in the IC of anesthetized animals with CI
stimu-lation. We demonstrate that these differences are largely due to
the effect of anesthesia by monitoring the responses of single
units in one rabbit before and after injection of an
ultra-short-acting barbiturate.
Materials and Methods
Animals
We measured responses of single units in the IC of awake rabbits to electric stimulation presented through CIs. Experiments were performed on four female Dutch-belted rabbits, two of which received unilateral cochlear implantation in the right ear and the other two bilateral cochlear implantations. All procedures were approved by the animal care and use committees of both Massachusetts Eye and Ear and the Massachusetts Institute of Technology. A preliminary report of some of these findings has been published previously (Chung et al., 2013).
Surgical procedures
Methods for recording from single units in the IC of awake rabbits were as described in previous reports with normal-hearing animals (Devore and Delgutte, 2010;Day et al., 2012). Methods for chronic cochlear im-plantation in adult rabbits were newly developed. Anesthesia for all sur-vival surgeries was induced with xylazine (5– 6 mg/kg, s.c.) and ketamine (35– 44 mg/kg, i.m.). For prolonged surgeries such as cochlear implan-tation, a surgical level of anesthesia was maintained by isoflurane mixed with oxygen (2.5%) and delivered via a facemask (0.8 l/min).
Each rabbit underwent three surgical procedures separated by recov-ery and training periods: a first one to affix a headpost and stainless steel cylinder to the skull, a second one to implant intracochlear electrode arrays, and a third one to perform a craniotomy for accessing the IC. In the first surgery, a stainless steel cylinder and brass head bar were affixed to the skull using stainless steel screws and dental acrylic (Jet Denture Repair; Lang Dental). After the rabbit was fully recovered, surgery for cochlear implantation was performed. A postauricular incision was made to access the tympanic bulla and then part of the bulla was drilled to expose the round window. An eight-contact ring-type electrode array (Z60274; Cochlear Ltd) was inserted into the cochlea through the round window. Before inserting the electrode array, 5–10l of distilled water was injected into the cochlea through the round window to deafen the ear by causing hypotonic stress to the organ of Corti (Ebert et al., 2004). The round window was sealed with soft tissue harvested from nearby muscle and secured with dental cement (Durelon; 3M). The percutaneous con-nector terminating the lead wire of the electrode array was secured to the side of the headpost with dental acrylic. The superficial muscles and the skin incision were closed with sutures that were removed 10 –14 d after the operation. Success of cochlear implantation was verified immediately after surgery by measuring the electrically evoked auditory brainstem response (EABR) to biphasic current pulses delivered between the most apical and the most basal electrodes in the intracochlear array. EABR thresholds were usually in the range of⫺16 to ⫺12 dB re 1 mA. The ABR to 100s acoustic clicks at 100 dB peak SPL was also measured to verify the effectiveness of deafening in the implanted ears. No attempt was
made to deafen the unimplanted left ear in the two unilaterally implanted rabbits.
After an⬃1 week recovery from cochlear implantation surgery, rab-bits were habituated to the experimental setup until they could sit quietly for 2–3 h with the head attached by the headpost while receiving electric stimulation through the cochlear implant. After habituation, the animals underwent a third aseptic procedure to make a small (⬃2 mm diameter) craniotomy 10.5 mm posterior and 3 mm lateral to bregma. In the two unilaterally implanted rabbits, the craniotomy was made contralateral to the implanted right ear. The exposed area was covered with a topical antibiotic (Bacitracin) and sealed with dental impression material (Re-prosil). Single-unit recording sessions started after 2–3 d of recovery and lasted until 26 – 431 d after implantation. Rabbits were monitored on a closed-circuit video system throughout the recording sessions and only received auditory stimulation through their cochlear implant during the recording sessions.
Electrophysiological methods
Stimuli. The main stimuli were 300 ms periodic trains of biphasic pulses (50s/phase) presented every 600 ms. Pulse trains were generated using 16-bit D/A converters (PXI-6221; National Instruments) and delivered to each cochlear implant through a pair of custom-built, high-bandwidth, isolated current sources. Stimulation was between the most apical and most basal intracochlear electrodes. This wide bipolar elec-trode configuration stimulates auditory nerve fibers over the entire length of the tonotopic axis while reducing stimulus artifact relative to monopolar stimulation (Litvak et al., 2001). Stimuli were presented di-otically in the bilaterally implanted rabbits and monaurally to the ear contralateral to the recorded IC in the unilaterally implanted rabbits.
The stimulus used for searching for single units in bilaterally im-planted rabbits was a sequence of three biphasic pulses presented alter-nately to both ears (diotically), the left ear, and the right ear. The interval between consecutive pulses in the triplet was 100 ms and the silent inter-val between triplets was 200 ms. In unilaterally implanted rabbits, the search stimulus was a pair of pulses separated by 100 ms with a 300 ms silent interval between pairs.
Single unit recordings. Single units were isolated using epoxy-insulated tungsten electrodes (A-M Systems) advanced with a remote-controlled microdrive. The electrode was advanced in a dorsoventral direction through the occipital cortex up to the IC, which was identified by back-ground entrainment to the search stimuli. Signals from the recording electrode were preamplified (Axoprobe 1A; Molecular Devices), band-pass filtered (1–3 kHz), and sampled at 100 kHz using a high-speed, 12-bit A/D converter (PXI-6123; National Instruments). The stimulus artifact was removed by gating out a short interval (0.3– 0.5 ms) after each stimulus pulse. Spike times were detected by software triggering on level crossings. Only well isolated single units were studied, as assessed by the stability of spike waveforms and amplitudes, which were always at least three times above the noise floor and clearly distinct from the local field potential. Representative spike waveforms recorded from IC neurons are shown inFigure 1, A–C, for pulse-train stimulation. These examples include a range of spike quality, from excellent (Fig. 1C) to cases that are clearly single units but include a small fraction (⬍1%) of false triggers (Fig. 1A, B).
When a single unit was isolated, the threshold for a single biphasic pulse was determined by measuring responses to the search stimulus from just below threshold to at least 2 dB above threshold in 1 or 2 dB steps. Then responses to 300 ms pulse trains were measured for pulse rates ranging from 20 to 1280 pps in half-octave steps. Pulse rates were presented in random order and each rate was repeated 12–20 times. Pulse trains were presented at 2– 4 dB above the single-pulse threshold.
Histological processing. In the last recording session from one unilater-ally implanted rabbit, electrolytic lesions were made to mark the borders of the region showing activity evoked by CI stimulation while the animal was under deep anesthesia (xylazine 6 mg/kg, s.c., and ketamine 44 mg/ kg, i.m.). The rabbit was then perfused intracardially using a solution of 1.5% paraformaldehyde and 2.5% gluteraldehyde in phosphate buffer. The brain was immersed in fixative for 24 h and then transferred to 25% sucrose solution for several days. Coronal sections (80m) were cut with
a freezing microtome and mounted on subbed slides. Borders of IC regions were identified by staining cell bodies with azure-thionin. All identified lesions were located within the cen-tral nucleus.
Injection of
ultra-shorting-acting barbiturate
To assess the effect of anesthesia in individual neurons directly, a catheter was surgically inserted into the right jugular vein of one uni-laterally implanted rabbit to allow the admin-istration of an ultra-short-acting barbiturate while recording from single units (Kuwada et al., 1989). A median ventral neck incision was made to expose the bifurcation of the right jug-ular vein into the anterior and posterior facial veins. A silicon catheter (2 Fr/outer diameter 0.67 mm, 20 cm) filled with diluted heparin (10 U/ml) was inserted at⬃6 cm, approximately to the level of the superior vena cava, into the pos-terior facial vein just above the bifurcation point. The catheter was secured to the vein with ligatures and led subdermally to an injection port on the nape of the neck. The catheter was flushed with diluted heparin (10 U/ml) every day and after each use to keep it patent (Kaplan and Timmons, 1979;Kuwada et al., 1989).In recording sessions from this rabbit, the responses of a single unit to pulse trains were first characterized in the awake condition as a function of pulse rate using 12 repetitions as described above. Following this characteriza-tion, 5 mg/kg methohexital sodium (Brevital) was injected through the intravenous catheter over 10 s. The unit responses to pulse train stimuli were then monitored for 10 –30 min after the injection, yielding 80 –240 repetitions of responses to 12 different pulse rates. Up to two injections separated by at least 30 min were given over a 2 h recording session. A total of 13 injections were made in this rabbit while suc-cessfully maintaining contact with a single unit.
Single unit recordings from anesthetized cats
Because direct data on the effects of anesthesia were only available from a small number of neurons, we reanalyzed data from the IC of anesthe-tized cats that have been described in part previously (Hancock et al., 2010,2012,2013) to allow quantitative comparison with the awake rabbit data at the population level. These data came from six adult cats that were deafened with ototoxic drugs and received cochlear implants bilaterally at the beginning of the neurophysiological experiment.
In the first of two procedures, adult cats were deafened by injection of kanamycin (300 mg/kg, s.c.) followed after 30 min by ethacrynic acid (25 mg/kg, i.v.;Xu et al., 1993) while under ketamine anesthesia (33 mg/kg, i.m.). The effectiveness of deafening was verified by the absence of ABR response to 100s acoustic clicks up to 100 dB peak SPL (Hancock et al., 2010). The neurophysiological experiment took place either 1–2 weeks (n⫽ 3) or 6 months (n ⫽ 3) after deafening. Cats were anesthetized with a combination of urethane (300 mg/kg, i.p.) and either diallyl barbituric acid (75 mg/kg, i.p.) or sodium pentobarbital (37 mg/kg, i.p.). The lateral and dorsal aspects of the skull were exposed. Tympanic bullae were opened bilaterally to allow access to the round window. A small cochleos-tomy was made and eight-contact electrode arrays (Z60274; Cochlear Ltd) were inserted bilaterally. An opening was made in the skull and the dorsal surface of the IC was exposed by aspirating the overlying cerebral cortex and removing part of the bony tentorium.
Aside from the use of anesthesia in cat, all stimulation protocols, re-cording procedures, and methods for data analysis were essentially the same in cat and in rabbit except for minor differences. Single-unit re-cordings in cat were made using 16-site multichannel electrodes (Neu-ronexus) advanced dorsally to ventrally into the exposed IC. Signals were preamplified (RA16; TDT) and then filtered (300 –3000 Hz) and ampli-fied using a digital signal processor (Medusa; TDT). The recording was typically made differentially between adjacent electrodes in the array to minimize the amplitudes of stimulus artifacts and local field potentials. Criteria for defining single units were the same as in rabbit.Figure 1D shows spike waveforms from an example neuron in anesthetized cat.
Data analysis
Spontaneous activity. In some units, spontaneous activity was recorded for 30 s without any stimulation. In cases when the spontaneous activity was not measured directly, we used responses to the search stimulus to estimate the spontaneous firing rate. Specifically, we counted the spikes occurring at subthreshold levels when available. If too few subthreshold responses were available, spikes were counted over the last 100 ms of the 200 –300 ms silent interval between consecutive search stimuli and aver-aged over all tested levels.
Dependence of average firing rate on pulse rate. To compute the “sus-tained” firing rate in response to the 300 ms pulse trains, the onset re-sponse was removed by excluding the smallest integer number of
0 300 600 20 80 320 1280 20 80 320 1280 0 50 100 0 300 600 20 80 320 1280 20 80 320 1280 0 5 10 15 20 0.5 ms off period on period
A
Anesthetized catB
C
Pulse rate (pps)D
Peristimulus time (ms) Pulse rate (pps)
0 300 600 20 80 320 1280 20 80 320 1280 0 50 100 150 200 Stimulus on 0 300 600 20 80 320 1280 20 80 320 1280 0 20 40 60 80 Pulse rate (pps) Pulse rate (pps) Pulse rate (pps) A w ake rabbit
Firing rate (spike/s)
Firing rate (spike/s)
Firing rate (spike/s)
Firing rate (spike/s)
Figure 1. Temporal response pattern (left), average firing rates (middle), and spike waveforms (right) in response to trains of biphasic pulses of different rates for three example IC neurons in awake rabbit (A–C) and one neuron from anesthetized cat (D). Left: Dot-rasters in which each dot represents a spike and alternating shades of gray distinguish blocks of stimulus trials at different pulse rates. Middle: Mean firing rates during the on period (excluding the first⬃30 ms after stimulus onset) and off period (excluding the first 100 ms after stimulus offset) versus pulse rate. Right: Superimposed spike waveforms from each neuron (145, 314, 227, and 95 spikes, respectively).
stimulus periods having a total duration of at least 30 ms. The firing rate was averaged over the remaining stimulus duration with the onset win-dow excluded. In awake rabbits, both background activity and rebound responses after stimulus offset were observed frequently. To minimize the effect of rebound responses, the spike rate during the off period was calculated over a 200 ms window extending from 100 ms after stimulus offset to the onset of the next stimulus.
To test for stimulus-driven activity (excitatory or suppressive) for each pulse rate, we used receiver operating characteristic analysis to compare the sustained firing rates during the on and off periods on a trial-by-trial basis. A response was considered to be significantly excitatory if the firing rate during the on period exceeded the rate during the subsequent off period in at least 75% of stimulus trials. Conversely, the response was considered to be suppressive if the rate during the off period exceeded the rate during the on period in at least 75% of stimulus trials.
A spike will be undetected if the portion of its waveform exceeding the user-set threshold occurs entirely during the 0.3– 0.5 ms stimulus artifact gating window. These missed spikes result in firing rates being underes-timated, especially for high pulse rates, when the gating window covers a substantial fraction of the stimulus period. This underestimation of fir-ing rates durfir-ing the on period could lead to responses befir-ing incorrectly identified as suppressive when they are compared with the off period response, in which there is no artifact gating. To avoid this problem, all apparently suppressive responses were corrected by recomputing the on period firing rate using a stimulus duration excluding the gating win-dows. This correction assumes that spikes are equally likely to occur within and outside of the gating windows. No correction was applied to putatively excitatory responses to avoid overestimating the firing rate in case this assumption does not hold. This method ensures a conservative identification of both excitatory and suppressive responses.
Cluster analysis of on and off period responses. We observed consider-able variability between neurons in both the dependence of responses on pulse rate and on the relative magnitudes of responses during and after the stimulus. To characterize this variability objectively, we used k-means clustering (MATLAB; MathWorks) to categorize neurons based on the joint pulse-rate dependence of on and off responses. For each neuron, the sustained firing rate versus pulse rate curves during the on and off peri-ods were concatenated into a single vector and then normalized by the maximum value over the entire vector. The clustering algorithm itera-tively partitions the set of vectors (one for each neuron) into a prespeci-fied number of clusters to minimize the sum of the Euclidean distances of each vector to the cluster centroid. The number of clusters was chosen by monitoring the summed Euclidean distance between neural responses and the cluster centroid as a function of the number of clusters.
Pulse-locked responses. Two different methods were used to character-ize the synchronization of spikes to the stimulus pulses and to determine an upper rate limit of pulse locking for each unit, a method based on cross-correlation between stimulus and response (Hancock et al., 2013) and a more standard method based on vector strength, a.k.a. synchroni-zation index (Vollmer et al., 2005;Middlebrooks and Snyder, 2010). The two methods differ in that the cross-correlation method requires spikes to occur within a relatively narrow latency range after each pulse to be considered pulse locked, whereas all spikes contribute to the vector strength regardless of when they occur over the stimulus period.
The following description of the cross-correlation analysis supersedes that in our earlier report (Hancock et al., 2013), which was oversimpli-fied. For each pulse rate, the stimulus pulse train was cross-correlated with the spike train (excluding the onset response) and a histogram constructed using a 0.1 ms bin width. When properly normalized, this cross-correlogram represents the mean instantaneous firing rate after each stimulus pulse. A perfectly pulse-locked response would yield a single peak at the spike latency in the cross-correlogram. To assess the statistical significance of correlogram peaks, we computed cross-correlograms for random spike trains containing the same number of spikes as the data, but uniformly distributed over the sustained response window excluding the artifact gating windows. This computation was repeated for 5000 random spike trains and a confidence bound was de-fined as the 99.5th percentile ( p ⫽ 0.005) of these synthetic cross-correlograms (Fig. 3A, B, gray shading). A correlogram peak was
regarded as significant when the average of two consecutive bins ex-ceeded the confidence bound. The height of the largest peak in the cross-correlogram (after averaging consecutive bins) relative to the 99.5% confidence bound was used as a measure of the strength of pulse locking. The pulse-locking limit was computed by interpolating to find the pulse rate where the peak height intercepted the confidence bound (Fig. 3C,D). Spike latency was defined as the latency of the highest significant peak in the cross-correlogram. The latencies were averaged over all pulse rates up to 80 pps to get a single latency for each unit.
The cross-correlograms were also used to separate pulse-locked spikes from unsynchronized spikes and to define a pulse-locked firing rate for each pulse rate. For this purpose, we used the area of each significant cross-correlogram peak lying above the average firing rate (Fig. 3A, B, white filled areas). Some units fired at multiple latencies within an inter-pulse interval and therefore showed multiple peaks in their cross-correlogram. In such cases, the peak areas were summed over all significant peaks. The summed peak areas were converted to units of firing rate (spikes/s) for comparison with the overall firing rate.
Vector strength was computed for each unit and each pulse rate using the method ofGoldberg and Brown (1969). The statistical significance of the vector strength is usually assessed by the Rayleigh test (Yin and Ku-wada, 1983), which assumes a uniform distribution of spikes over the stimulus period under the null hypothesis. This test is not applicable to our data because spikes occurring during the stimulus artifact gating window are not detected, resulting in a nonuniform distribution even when spikes are not synchronized to the pulse train. We therefore used the same 5000 random spike trains as for the cross-correlation analysis to calculate a 99.5th confidence bound for vector strength and assessed statistical significance by comparing the measured vector strength to the bound for each pulse rate. This test would be equivalent to the Rayleigh test (with p⬍ 0.005) if there were no artifact gating. A pulse-locking limit was determined for each unit by interpolating to find the pulse rate where the vector strength intercepted the confidence bound (Fig. 3E, F ). The confidence bounds for vector strength (Fig. 3E, F, dashed lines) increase with pulse rate because the artifact gating window occupies an increasing fraction of the stimulus period.
Results
We recorded from 136 single units in the IC of awake rabbit, 94
units from two unilaterally deafened and implanted rabbits and
42 from two bilaterally deafened and implanted rabbits. The
single-unit recordings from unilaterally implanted rabbits were
made 29 – 431 d after implantation, whereas the recordings from
bilaterally implanted rabbits were made 26 –172 d after
implan-tation. Unless otherwise noted, responses to contralateral
stimu-lation in unilaterally implanted rabbits and to diotic stimustimu-lation
in bilaterally implanted rabbits were combined because the
pat-terns of response were similar.
Dependence of firing rates on pulse rate
Responses to periodic electric pulse trains were measured as a
function of pulse rate in all neurons. We observed wide variability
in both the pulse-rate dependence of responses and the
relation-ship between responses during the on and off periods. Responses
of three example units from awake rabbit and one unit from
anesthetized cat are shown in
Figure 1
. The first neuron from
awake rabbit (
Fig. 1
A) illustrates the suppressive responses
(ex-cept for an onset response) that are commonly observed in this
preparation. A very high level of background activity (
⬃70
spikes/s) is observed during the interstimulus period; this activity
is suppressed during presentation of the pulse train, with the
greatest suppression occurring at 160 pps. In contrast, the second
neuron from awake rabbit (
Fig. 1
B) shows excitatory responses
for all pulse rates and lower background activity. The neuron fires
approximately one spike per pulse up to 160 pps in a pulse-locked
manner, as indicated by periodic patterns in the dot raster.
Pulse-locked firing at low rates transitions to unsynchronized firing at
high rates, and sustained responses are observed up to the highest
rate tested (1280 pps). The background activity is suppressed
after each stimulus, especially at intermediate pulse rates that
evoke the largest sustained response. Although the types of
re-sponses illustrated in
Figure 1
, A and B, are primarily observed in
awake rabbit, responses such as those of the rabbit neuron in
Figure 1
C are observed in both awake and anesthetized
prepara-tions (
Hancock et al., 2012
). This neuron fires approximately two
spikes per pulse at 20 pps; firing efficiency starts to decrease from
56 pps up and only a response to the first pulse is observed for
rates
⬎320 pps, resulting in a “band-pass” pattern for the
sus-tained response. Finally, the pattern illustrated by the neuron
from anesthetized cat in
Figure 1
D is rarely observed in awake
rabbit. This neuron fires one spike per pulse at 20 pps, but firing
efficiency starts to decrease from 40 pps up and there is only a
response to the first pulse for rates
⬎80 pps. The lack of
back-ground activity during the interstimulus period in
Figure 1
D
con-trasts with the strong spiking in neurons from awake rabbit in
Figure 1
, A and B.
The firing rates during the on period (excluding the onset
response) and the off period (excluding the first 100 ms) were
compared for each pulse rate to determine whether the pulse
train elicited a significant excitatory or suppressive response (see
Materials and Methods).
Figure 2
shows the fraction of units that
showed significant excitatory and suppressive responses as a
function of pulse rate for all neurons from awake rabbit. The data
are shown separately for unilaterally and bilaterally implanted
animals. The bars on the positive side represent the fraction of
units that show significant excitatory activity; those on the
nega-tive side represent suppressive activity.
In both unilaterally and bilaterally implanted animals,
excit-atory responses dominate for pulse rates up to 80 pps, with
⬎50%
of units showing excitatory responses and
⬍30% showing
sup-pressive responses. The fraction of excitatory responses decreases
with increasing pulse rate at low rates, with a concomitant
in-crease in the fraction of suppressive responses. For pulse rates of
160 pps and above, excitatory and suppressive responses are
ap-proximately balanced, with 25– 40% of the units showing
excit-atory responses and 25–50% showing suppressive responses.
Suppressive responses are more frequently observed in
unilater-ally implanted animals than in bilaterunilater-ally implanted animals
⬎160 pps. A two-way ANOVA on the arc-sine-transformed
frac-tion of suppressive responses showed significant effects of both
pulse rate and unilateral versus bilateral implantation ( p
⬍ 0.001
for both). A parallel ANOVA for excitatory responses showed
significant effects of pulse rate ( p
⬍ 0.001), but no effect of type of
implantation ( p
⫽ 0.76).
The greater incidence of suppressive responses in unilaterally
implanted animals might reflect increased spontaneous activity
compared with bilaterally implanted animals. However, there
were no significant differences in the distributions of either
spon-taneous firing rates (Kolmogorov–Smirnov, p
⫽ 0.18) or firing
rates during the interstimulus off period (Kolmogorov–Smirnov,
p
⫽ 0.41) between unilaterally and bilaterally implanted rabbits.
Pulse-locked responses and response latency
The degree of synchronization (“pulse-locking”) between neural
spikes and stimulus pulses was assessed using two
complemen-tary methods: one based on cross-correlation between spike
trains and stimulus pulse trains (
Hancock et al., 2013
) and the
traditional method based on vector strength (
Vollmer et al., 2005
;
Middlebrooks and Snyder, 2010
). The cross-correlation method
should provide a more stringent criterion for pulse locking
be-cause it requires spikes to occur within a restricted range of
laten-cies after each stimulus pulse, whereas the vector strength
method counts all spikes regardless of their temporal position
over the stimulus period (
Hancock et al., 2013
).
Figure 3
A, B
shows example cross-correlograms for the same rabbit IC
neu-rons as in
Figure 1
, C and B, respectively. Robust pulse locking
was evoked by low-rate pulse trains in both neurons, as shown by
prominent peaks at a latency of
⬃6 ms in the cross-correlograms.
The peak amplitude dropped markedly (⬎112 pps) in the first
neuron (
Fig. 3
A) and firing was minimal (
⬎224 pps). In contrast,
pulse-locked spikes were observed up to 320 pps in the other
neuron (
Fig. 3
B). The multiple cross-correlogram peaks for pulse
rates between 80 and 320 pps reflect the periodicity of the pulse
train stimulus. Above 320 pps, no cross-correlogram peak
ex-ceeds the 99.5% confidence bound for a random spike train (gray
shading), meaning that the responses are unsynchronized to the
stimulus pulses.
For each neuron, the pulse-locking limit was defined as the
highest pulse rate where a significant peak was observed in the
cross-correlogram (see Materials and Methods).
Figure 3
, C and
D, shows the normalized height of the correlation peaks relative
to the 99.5% confidence bound for random spike trains as a
function of pulse rate. The pulse-locking limit is the rate where
the normalized peak height just falls below 1, meaning the
corre-lation peak no longer exceeds the confidence bound. The
pulse-locking limits were 156 and 356 pps for the two example neurons.
In comparison,
Figure 3
, E and F, show the vector strength and its
99.5% confidence bound for a random spike train as a function of
pulse rate for these two neurons. Pulse-locking limits determined
by the vector strength method were 220 and 312 pps.
The area of the significant cross-correlogram peaks lying
above the average firing rate (
Fig. 3
A, B, white filled area) was
used to define a “pulse-locked firing rate” that was compared
with the overall sustained firing rate during the on period
(com-prising both pulse-locked and unsynchronized spikes).
Pulse-locked firing rates are shown as a function of pulse rate and
compared with overall firing rates for the two example neurons in
Figure 3
, G and H. In the first neuron, the overall and
pulse-locked firing rates approximately parallel each other, which is
consistent with the decrease in firing rates near the pulse-locking
limit (
Figs. 1
C,
3
A). In contrast, in the other neuron, the
pulse-locked firing rate falls sharply above 224 pps, whereas the overall
firing rate remains substantial up to the highest rate tested,
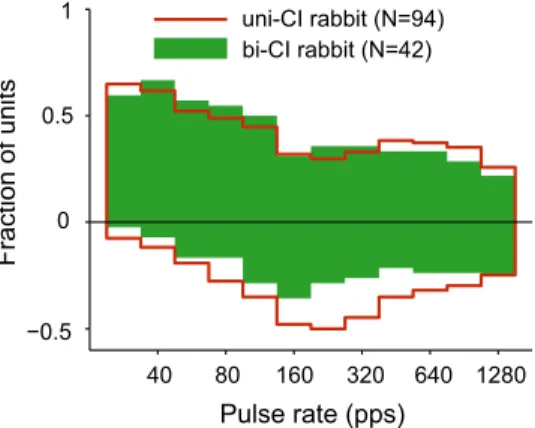
re-40 80 160 320 640 1280 −0.5 0 0.5 1 Pulse rate (pps) Fraction of units uni-CI rabbit (N=94) bi-CI rabbit (N=42)
Figure 2. Fraction of IC units showing excitatory (positive ordinates) and suppressive (neg-ative ordinates) responses to pulse-train stimulation as a function of pulse rate in unilaterally implanted and bilaterally implanted rabbits.
flecting the change from a pulse-locked firing pattern at low rates
to unsynchronized firing at high rates (
Figs. 1
B,
3
B).
The distributions of pulse-locking limits obtained by both
methods in awake rabbit are compared in
Figure 4
A and
Table 1
(the cat data also included in
Table 1
will be discussed later). The
main difference between the two methods is the much higher
fraction of neurons that did not pulse lock at any rate using the
cross-correlation method (29%) compared with using vector
strength (6%), which is consistent with the idea that the
cross-correlation method provides a more stringent criterion for pulse
locking. Differences between the two methods were minimal
when only pulse-locking units were considered and the median
pulse-locking limits were similar (148 pps for cross-correlation vs
158 pps for vector strength). Neither the differences in the shapes
of the distributions (as assessed by the Kolomogorov–Smirnov
test), nor the difference in median pulse-locking limits
(Wil-coxon rank-sum test) reached statistical significance (
Table 1
).
Using the cross-correlation method, there was no significant
difference in median pulse-locking limits for contralateral
stim-ulation in unilaterally implanted rabbits compared with diotic
stimulation in bilaterally implanted rabbits (Wilcoxon rank-sum
test, p
⫽ 0.11). In addition, no significant difference in median
pulse-locking limits between contralateral and bilateral
stimula-tion was observed among 20 neurons from bilaterally implanted
rabbits that were studied with both modes of stimulation
(Wil-coxon signed-rank test, p
⫽ 0.08). Moreover, a linear regression
showed no effect of duration of deafness (the time interval
be-tween implantation and recording) on pulse-locking limits
(R
2⫽ 0.0002, p ⫽ 0.89). Finally, pulse-locking limits were not
correlated with spontaneous firing rates across the sample of
neu-rons (R
2⫽ 0.022, p ⫽ 0.15).
Previous studies of the IC using anesthetized preparations
(
Snyder et al., 1995
;
Vollmer et al., 1999
,
2005
) have reported an
inverse correlation between pulse-locking limit and spike latency
in response to pulsatile CI stimulation. To assess whether such a
correlation also holds in awake rabbit, the spike latency in
re-sponse to pulse trains was calculated from the largest peak in the
cross-correlogram (which excludes the onset response). Only
re-sponses to low-rate pulse trains (
⬍ 80 pps) were used to avoid
ambiguities arising when the latency becomes comparable to the
interpulse interval. The mode of the latency distribution was
cen-tered at 6 –7 ms, with a minority of units (23%) having latencies
⬎10 ms (
Fig. 4
B). In contrast to previous reports from
anesthe-tized preparations, there was no significant correlation between
pulse-locking limit and spike latency in awake rabbit (R
2⫽ 0.006,
p
⫽ 0.47;
Fig. 4
C). This lack of correlation occurs because some
long-latency units had a pulse-locked response up to relatively
high rates. Previous studies in anesthetized animals measured the
first-spike latency in response to the entire pulse train rather than
the latency in response to each individual pulse in the train
(ex-cluding the onset response). To determine whether this
differ-ence in the definition of latency might account for the contrasting
findings, we reanalyzed data from previous experiments in
anes-thetized cat (
Hancock et al., 2010
,
2012
,
2013
) using
cross-correlation to determine latency and pulse-locking limits. There
was a significant negative correlation between the two metrics
(R
2⫽ 0.36, p ⬍ 0.001;
Fig. 4
C) in anesthetized cat, suggesting
that the failure to observe such a correlation in awake rabbit
reflects genuine differences between the two preparations rather
than differences in the definition of latency.
Effect of barbiturate on spontaneous activity and response to
pulse trains
The response properties of IC neurons in awake rabbit possess
unique features that have not been reported in previous studies of
responses to CI stimulation that used anesthetized preparations
(
Snyder et al., 1991
,
1995
;
Vollmer et al., 1999
,
2005
;
Hancock et
al., 2010
,
2012
,
2013
). These features include prominent
sponta-neous activity, a high incidence of suppressive responses to pulse
trains, and unsynchronized, sustained responses at high pulse
rates. To assess directly whether these differences reflect a specific
effect of anesthesia as opposed to other methodological
differ-0 5 10 15 20 40 56 80 112 160 224 320 448 640 896 1280 Pulse rate (pps) 0 5 10 15
Time re stimulus pulse (ms)
Firing rate (spikes/s) Vector strength Pulse rate (pps) All spikes Pulse-locked spikes Normalized XC peak height 356 pps 312 pps 20 80 320 1280 0 5 10 20 80 320 1280 0 50 100 20 80 320 1280 0 5 10 20 80 320 1280 0 0.5 1 20 80 320 1280 0 100 200 156 pps 20 80 320 1280 0 0.5 1 220 pps
A
B
C
D
G
H
E
F
Figure 3. A, B, Cross-correlograms between stimulus pulse trains and neural spike trains for the same two neurons as in Figure 1, C and B, respectively. Each trace shows the cross-correlogram for one pulse rate. Gray shading indicates the 99.5% upper confidence bound for a random spike train; correlation peaks exceeding the confidence bound are filled in white. C, D, Normalized height of the main correlogram peak as a function of pulse rate. The peaks are normalized to the 99.5% confidence bound (dashed line). Filled marker indicates that the peak height exceeds the confidence bound. The pulse-locking limit is defined as the rate where the peak height intercepts the 99.5% upper confidence bound. E, F, Vector strength and 99.5% upper confidence bound for a random spike train as a function of pulse rate. The limit is defined as the rate where the vector strength intercepts the 99.5% upper confidence bound. G, H, Comparison of firing rates computed using all spike to firing rates computed using only pulse-locked spikes.
ences with these earlier studies (none of which was conducted in
rabbit), we monitored changes in the responses of 13 single units
after intravenous injection of an ultra-short-acting barbiturate in
one unilaterally implanted rabbit.
Illustrative results are presented in
Figure 5
for one neuron.
Before injection (
Fig. 5
A), the neuron showed background
activ-ity, clear pulse-locked spikes up to 320 pps, and unsynchronized
sustained firing at higher pulse rates. One minute after injection
(
Fig. 5
B), the background activity largely disappeared,
pulse-locked responses were observed only up to 160 pps and there was
no sustained activity at higher pulse rates. Ten minutes after
injection (
Fig. 5
C), the response largely recovered back to the
preinjection pattern. The firing rate was not uniformly
atten-uated across all pulse rates after injection, but rather the
rela-tive reduction was more pronounced at high pulse rates so that
the “half-maximum pulse rate,” where the firing rate falls to
50% of its maximum value, shifted to a lower value (
Fig. 5
D).
This change in half-maximum rate is especially apparent when
Pulse-locking limit (pps) <10 20 80 320 Max 0 0.1 0.2 0.3 Fraction of units VS based XC based(N=136) 0 5 10 15 20 0 0.1 0.2 0.3 Latency (ms) Fraction of units
A
B
C
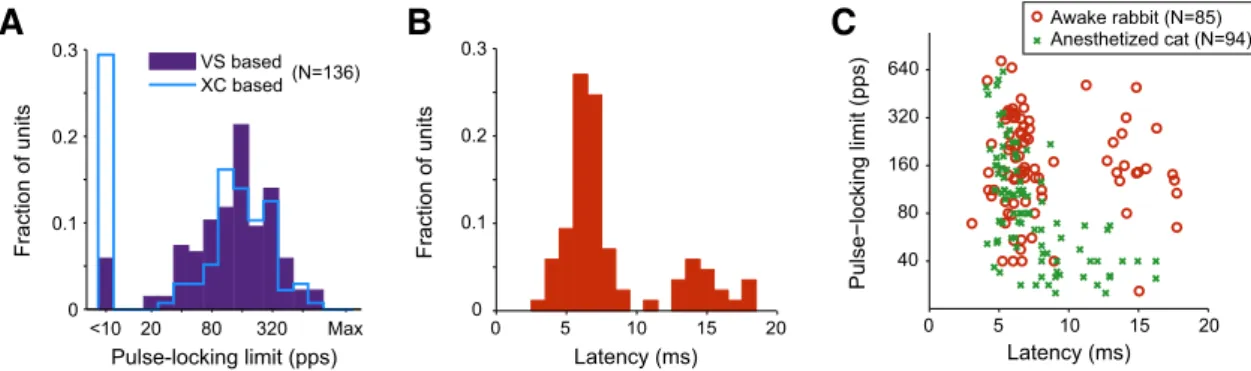
0 5 10 15 20 40 80 160 320 640 Latency (ms) Pulse−locking limit (pps) Awake rabbit (N=85) Anesthetized cat (N=94)Figure 4. A, Histogram of the distribution of pulse-locking limits based on cross-correlation and vector strength across the population of IC neurons in awake rabbit. B, Distribution of spike latencies to low-rate pulse trains in awake rabbit. C, Scatter plot of pulse-locking limit against spike latency in awake rabbit and anesthetized cat.
Table 1. Pulse-locking limits by method and preparation
Method
Cross-correlation Vector strength
XC vs VS
Unsync Median (pps)a IQR (pps) Unsync Median (pps)a IQR (pps)
Awake rabbit 29% 148 103–272 6% 158 80 –274 p⫽ 0.13b
Anesthetized cat 20% 80 45–150 8% 74 40 –137 p⫽ 0.08b
Rabbit vs cat p⫽ 0.07c p⬍ 0.001d p⫽ 0.57c p⬍ 0.001d
aPulse-locked units only. bKolmogorov–Smirnov test. c2test.
dWilcoxon rank-sum test.
A
B
C
0 300 600 20 80 320 1280 Peristimulus time (ms) Pulse rate (pps) 0 300 600 0 300 600 20 80 320 1280 0 50 100 150 Pulse rate (pps)Firing rate (spikes/s) Normalized firing rate
Before injection 1 min after injection 10 min after injection 20 80 320 1280 0 0.2 0.4 0.6 0.8 1 Pulse rate (pps)
Before injection 1 min after injection 10 min after injection
D
E
288 pps
163 pps
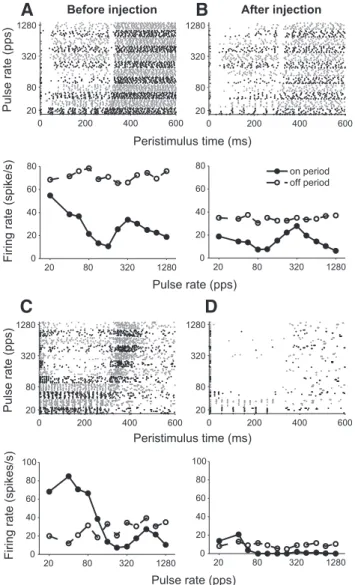
Figure 5. Effect of barbiturate on responses to pulse trains in a single unit from rabbit IC. A–C, Temporal response patterns (dot rasters) just before injection (A), 1 min after injection (B), and 10 min after injection (C). D–E, Absolute (D) and normalized (E) firing rate during the on period against pulse rate for the three time periods in A–C.
the pre- and postinjection curves are each normalized by their
maximum (
Fig. 5
E).
Two additional examples with different response patterns are
presented in
Figure 6
. Before injection, the neuron in
Figure 6
, A
and B, showed high background activity of
⬃70 spikes/s and
firing was strongly suppressed during pulse train stimulation.
One minute after injection, the background firing rate was
re-duced to half its preinjection value and the firing rate during the
stimulus was also reduced, especially at low pulse rates. The unit
in
Figure 6
, C and D, fired several spikes per pulse at low pulse
rates before injection and showed pronounced rebound
re-sponses at high pulse rates. One minute after injection, the
back-ground activity was greatly reduced, pulse-locked responses were
limited to 20 and 40 pps, and rebound responses were eliminated.
Three metrics were used to characterize these changes for the
13 single units studied with barbiturate injection: the background
firing rate between stimulus presentations, the pulse-locking
limit based on cross-correlograms, and the half-maximum pulse
rate.
Figure 7
A compares the background firing rates before and
after barbiturate injection across the unit sample. Background
activity was decreased in all units and the median decrease in
background rate (from 8.6 to 1.2 spikes/s) across the sample was
statistically significant (Wilcoxon signed-rank test, p
⬍ 0.001).
Figure 7
B compares the preinjection and postinjection
half-maximum rates and pulse-locking limits. All of the data points lie
below the main diagonal, meaning that both the half-maximum
rate and the pulse-locking limit were decreased after injection in
all 13 units studied. In five units, pulse locking was completely
eliminated. The median changes in half-maximum rate (from
176 to 64 pps) and pulse-locking limit (from 224 to 95 pps) across
the unit sample were both highly significant (Wilcoxon
signed-rank tests, p
⬍ 0.001 for both). However, the median response
latencies measured by cross-correlation were not significantly
altered by anesthesia (Wilcoxon signed-rank test, p
⫽ 0.48),
which is consistent with the lack of correlation between latency
and pulse-locking limit in the awake state (
Fig. 4
C).
Comparison with results from anesthetized cat
We have shown that injection of barbiturate anesthesia causes
decreases in background activity, pulse-locking limits, and
sus-tained responses to high rate stimulation in a small number of
single units from rabbit IC. The response properties altered by
anesthesia in rabbit are precisely those that distinguish results in
0 200 400 600 20 80 320 1280 20 80 320 1280 0 20 40 60 80
Firing rate (spike/s)
Pulse rate (pps) 0 200 400 600 20 80 320 1280 Peristimulus time (ms) 20 80 320 1280 0 20 40 60 80 Pulse rate (pps) 0 200 400 600 20 80 320 1280 20 80 320 1280 0 20 40 60 80 100 Pulse rate (pps)
Firing rate (spikes/s)
0 200 400 600 20 80 320 1280 Peristimulus time (ms) 20 80 320 1280 0 20 40 60 80 100 Pulse rate (pps)
A
B
C
D
Before injection After injection
off period on period
Figure 6. Effect of barbiturate in two single units from rabbit IC. A–B, Unit with high spon-taneous rate and suppressive responses to pulse trains. C–D, Unit with multiple spike responses to each pulse at low rates and rebound responses at high pulse rates. For each unit and condi-tion, temporal discharge patterns are shown on the top and mean firing rates during on and off periods versus pulse rate on the bottom.
0.1 1 10 100 0.1 1 10 100
Before injection
After injection
Background activity (spikes/s)
20 80 320 1280 <10 20 80 320 1280
Before injection
After injection
Limit rate (pps)
A
B
<10 Half-max Pulse-locking limit~~
~ ~
Figure 7. A, Scatter plot of background firing rate before and 1–2 min after injection in the 13 units studied with barbiturate injections. B, Scatter plots of half-maximum pulse rate and pulse-locking limit before and 1–2 min after injection.
the awake rabbit preparation from responses previously
mea-sured in anesthetized animals with CI stimulation, suggesting
that anesthesia is a major factor underlying the differences with
previous studies. However, the sample of units studied with
bar-biturate injection is too small (n
⫽ 13) to allow a detailed,
quan-titative comparison with these earlier studies at the neural
population level. Moreover, the level of anesthesia induced by the
ultra-short-acting barbiturate in rabbit is not as deep as the level
used in previous studies (which were based on nonsurvival
ex-periments), so that the effects of anesthesia are likely to be
under-estimated in the rabbit.
To address these issues, we reanalyzed data from previous
experiments in anesthetized cats (
Hancock et al., 2010
,
2012
,
2013
) that used the same intracochlear electrodes, pulse train
stimuli, and recording methods to quantitatively compare key
response properties of IC neurons in the awake rabbit with those
in an anesthetized preparation. This anesthetized cat preparation
has been the leading animal model for studies of neural coding
with CI stimulation in both the IC (
Snyder et al., 1991
,
1995
;
Vollmer et al., 1999
,
2005
;
Shepherd et al., 2001
;
Smith and
Del-gutte, 2007
;
Middlebrooks and Snyder, 2010
) and auditory cortex
(
Raggio and Schreiner, 1994
,
1999
,
2003
;
Kral et al., 2000
,
2005
,
2009
;
Fallon et al., 2009
). Specifically, data from 117 single units
in six bilaterally implanted, anesthetized cats were analyzed.
Un-less otherwise noted, data from both short-term-deafened (1
week) and long-term-deafened (6 months) cats were combined
because the differences between the two groups were minor for
the response measures of interest.
Spontaneous activity
There were obvious differences in spontaneous activity between
anesthetized cats and awake rabbits.
Figure 8
A shows histograms
of the distribution of spontaneous firing rates (SRs) across our
neuron samples in the two preparations. Approximately 94%
of units in awake rabbit had SRs
⬎ 1 spike/s with a median SR
of 17.27 spikes/s. In contrast, a majority of units in
anesthe-tized cats did not have any SRs and only 25% of the units had
SRs
⬎1 spike/s. The difference in SR distributions between the
two preparations was highly significant
(Kolmogorov–Smir-nov test, p
⬍ 0.001).
We reported previously that spontaneous firing rates are
higher in long-term-deafened cats than in short-term-deafened
cats (
Hancock et al., 2013
), which might confound the
compari-son with the rabbit data when both groups of cats are combined.
However, the median spontaneous rates in awake rabbit (17.27
spike/s) were significantly higher than those in
long-term-deafened cats (0.10 spike/s; Wilcoxon rank-sum test, p
⬍ 0.001).
Prevalence of excitatory and suppressive responses
There were also major differences in the prevalence of excitatory
and suppressive responses between the two preparations. In
anes-thetized cats, the fraction of units showing significant excitatory
responses dropped rapidly with increasing pulse rate so that only
11–15% of the units had an excitatory response for rates of 160
pps and above (
Fig. 8
B). Although a drop with increasing pulse
rates is also observed in awake rabbit, the fraction of units with
excitatory responses remains
⬎30% for all pulse rates and is
higher is higher than the cat fraction for all pulse rates except 20
pps. A two-way ANOVA on the arc-sine-transformed data
showed significant effects of both pulse rate and preparation ( p⬍
0.001 for both). There is an even clearer contrast in suppressive
response between the two preparations. Only 5–10% of the units
at in anesthetized cat show a suppressive response for any pulse
rate, as opposed to 20 –50% in awake rabbits. A two-way ANOVA
showed a significant effect of preparation on the incidence of
suppressive responses ( p
⬍ 0.001) but no effect of pulse rate
( p
⫽ 0.48).
Temporal coding
Using the cross-correlation method to determine pulse locking,
there were fewer neurons that did not pulse lock at any rate in
anesthetized cat (20%) than in awake rabbit (28%) (
Table 1
).
This result is consistent with the high incidence of suppressive
responses that did not give rise to a short-latency
cross-correlogram peak in rabbit. Among the units that did show pulse
locking, the distribution of pulse-locking limits based was
strongly biased toward higher rates in awake rabbit compared
with anesthetized cat and this held for both the cross-correlation
method and the vector strength method. The difference is clearly
apparent in the cumulative distributions based on the
cross-correlation method (
Fig. 8
C), which include only pulse-locking
units. The median pulse-locking limit was 1.9 times higher in
awake rabbit (148 pps) than in anesthetized cat (80 pps).
Approx-imately 50% of pulse-locking limits fell in the range 45–150 pps in
anesthetized cat versus 103–272 pps in awake rabbit. The
differ-ence in median pulse-locking limits between the two
prepara-tions was highly significant when only pulse-locking units were
compared (Wilcoxon rank sum test, p
⬍ 0.001) and remained
significant ( p
⫽ 0.03) when all units were included despite the
higher proportion of unsynchronized units in rabbit.
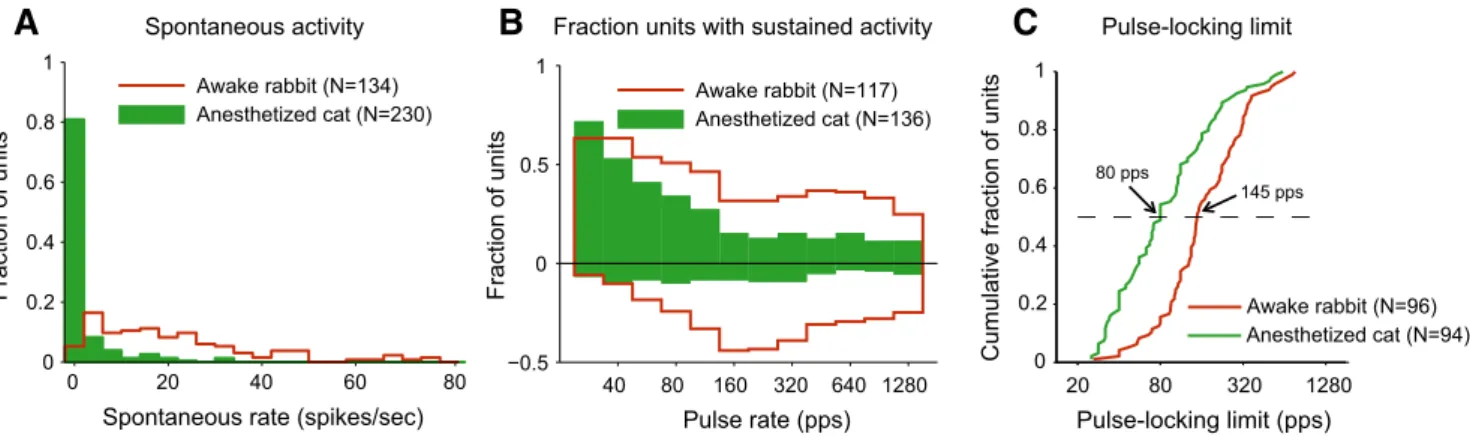
Awake rabbit (N=134) Anesthetized cat (N=230) 40 80 160 320 640 1280 −0.5 0 0.5 1 Pulse rate (pps) Fraction of units Anesthetized cat (N=94) Awake rabbit (N=96) 20 80 320 1280 0 0.2 0.4 0.6 0.8 1 Pulse-locking limit (pps)
Cumulative fraction of units
0 20 40 60 80 0 0.2 0.4 0.6 0.8 1
Spontaneous rate (spikes/sec)
Fraction of units
Awake rabbit (N=117) Anesthetized cat (N=136)
A
Spontaneous activityB
Fraction units with sustained activityC
Pulse-locking limit80 pps
145 pps
Figure 8. Comparison between response properties of sample IC neurons from awake rabbit and anesthetized cat. A, Distribution of SRs. B, Fraction of IC units showing sustained excitatory (positive ordinates) and suppressive (negative ordinates) responses to pulse-train stimulation as a function of pulse rate. C, Cumulative distribution of pulse-locking limits using cross-correlation method excluding units that do not pulse lock at any rate.
In summary, the three effects that were observed directly in a
few rabbit single units after barbiturate injection (i.e., decreases
in background activity, pulse-locking limits, and incidence of
excitatory responses at high pulse rates) are also observed when
response properties are compared quantitatively across much
larger samples of IC neurons from awake rabbit and anesthetized
cat, suggesting that anesthesia is a major factor underlying the
differences between the two preparations.
Characterization of the variability in pulse rate dependence of
on and off responses
The example neurons in
Figures 1
illustrate the wide variability
that was observed in both the pulse-rate dependence of responses
to pulse trains and the degree to which responses are primarily
excitatory or suppressive. To characterize this variability
objec-tively, we used k-means clustering to categorize the various
re-sponse patterns observed in awake rabbit and anesthetized cat
(see Materials and Methods). This clustering analysis was applied
to the combined data from both preparations so that the full
range of variability would be represented and the distributions of
the different clusters could be compared between the two
prepa-rations. We chose to split the neuron population into four
clus-ters because this categorization accounted for
⬎50% of the
variance in the data and the clusters were easily interpretable. The
pulse rate dependence of responses for the four cluster centroids
is shown in
Figure 9
, A–D. The first cluster (
Fig. 9
A) contains
neurons with predominantly suppressive responses, in that the
off period response is greater than the on period response at most
pulse rates. The other three clusters (
Fig. 9
B–D) contain
pre-dominantly excitatory responses but differ in the pulse rate
yielding the largest response. Cluster 2 (
Fig. 9
B) contains
“all-pass” neurons that have an excitatory response over a broad
range of pulse rates, often with the maximum firing rate
oc-curring at higher pulse rates (
⬎ 320 pps). Cluster 3 (
Fig. 9
C)
contains “band-pass” neurons that have a maximum in firing
rate near 80 pps, with a clear drop on either side. Finally,
Cluster 4 (
Fig. 9
D) contains “low-pass” neurons in which the
firing rate decreases rapidly with increasing pulse rate and
there is little or no sustained response
⬎80 pps. The example
neurons in
Figure 1
, A–D, belong to the suppressive, all-pass,
band-pass, and low-pass clusters, respectively.
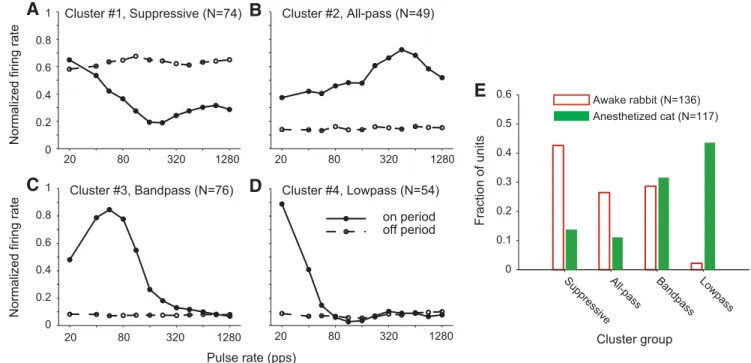
The relative incidence of the four response types differed
markedly between the two preparations (
2test, p
⬍ 0.001;
Fig.
9
E). In awake rabbit, the most common response pattern was the
suppressive type (43%), followed by band-pass and all-pass
re-sponses in similar proportions (25–30%). Very few neurons in
awake rabbit showed the low-pass response pattern. In contrast,
the most common response pattern in anesthetized cats was
low-pass followed by band-low-pass.
⬍14% of units in anesthetized cats
showed all-pass or suppressive responses. There was no
signifi-cant difference in the distribution of neurons across the four
clusters between unilaterally deafened rabbits and bilaterally
deafened rabbits (
2test, p
⫽ 0.92).
The four clusters defined based on average firing rates also
differ in pulse-locked responses.
Figure 10
shows both the
pulse-locked firing rate (as presented in
Fig. 3
G,H ) and the overall
firing rate as a function of pulse rate for each of the four cluster
centroids defined in
Figure 9
. In suppressive neurons (
Fig. 10
A),
the pulse-locked firing rate is much lower than the overall firing
rate for all pulse rates, reflecting the lack of a sharp peak in the
cross-correlogram for these neurons, which are mostly recorded
from awake rabbit. All-pass neurons (
Fig. 10
B) show a similar
dependence of overall and pulse-locked firing rates at low pulse
rates, but the pulse-locked rate begins to fall markedly for
pulse rates
⬎224 pps. At high pulse rates (⬎320 pps), the overall
firing rate is much larger than the pulse-locked rate, which is
characteristic of the sustained, unsynchronized responses only
observed significantly in awake rabbit. In band-pass neurons
(
Fig. 10
C), the pulse-locked firing rate approximately parallels
the overall firing rate with some attenuation. Finally, in low-pass
20 80 320 1280 0 0.2 0.4 0.6 0.8 1 Pulse rate (pps)
Normalized firing rate
Cluster #1, Suppressive (N=74) 20 80 320 1280 Cluster #2, All-pass (N=49) 20 80 320 1280 Cluster #3, Bandpass (N=76) Lowpass Bandpas s All-pass Suppressive 0 0.1 0.2 0.3 0.4 0.5 0.6 Cluster group Fraction of units Awake rabbit (N=136) Anesthetized cat (N=117) 20 80 320 1280 Cluster #4, Lowpass (N=54) on period off period 0 0.2 0.4 0.6 0.8 1
Normalized firing rate
E
A
B
C
D
Figure 9. Neurons clusters based on on period and off period responses to pulse train stimuli. A–D, Centroids of the four neuron clusters generated by k-means clustering. Each curve shows the normalized mean firing rate during the on and off periods as a function of pulse rate. A, “Suppressive” cluster. B, “All-pass” cluster. C, “Band-pass” cluster. D, “Low-pass” cluster. E, Relative incidence of each cluster differs between the two preparations.