HAL Id: hal-02640938
https://hal.inrae.fr/hal-02640938
Submitted on 6 Jan 2021
HAL is a multi-disciplinary open access
archive for the deposit and dissemination of
sci-entific research documents, whether they are
pub-lished or not. The documents may come from
teaching and research institutions in France or
abroad, or from public or private research centers.
L’archive ouverte pluridisciplinaire HAL, est
destinée au dépôt et à la diffusion de documents
scientifiques de niveau recherche, publiés ou non,
émanant des établissements d’enseignement et de
recherche français ou étrangers, des laboratoires
publics ou privés.
mechanisms of segmental rediploidization
Kang Du, Matthias Stöck, Susanne Kneitz, Christophe Klopp, Joost
Woltering, Mateus Contar Adolfi, Romain Feron, Dmitry Prokopov, Alexey
Makunin, Ilya Kichigin, et al.
To cite this version:
Kang Du, Matthias Stöck, Susanne Kneitz, Christophe Klopp, Joost Woltering, et al.. The sterlet
sturgeon genome sequence and the mechanisms of segmental rediploidization. Nature Ecology &
Evolution, Nature, 2020, 4 (6), pp.841-852. �10.1038/s41559-020-1166-x�. �hal-02640938�
1Physiological Chemistry, Biocenter, University of Wuerzburg, Wuerzburg, Germany. 2Developmental Biochemistry, Biocenter, University of Wuerzburg, Wuerzburg, Germany. 3Leibniz-Institute of Freshwater Ecology and Inland Fisheries, IGB, Berlin, Germany. 4Plate-forme Bio-informatique Genotoul, Mathématiques et Informatique Appliquées de Toulouse, INRA, Castanet-Tolosan, France. 5SIGENAE, GenPhySE, Université de Toulouse, INRA, ENVT, Castanet-Tolosan, France. 6Lehrstuhl für Zoologie und Evolutionsbiologie, Department of Biology, University of Konstanz, Konstanz, Germany. 7Department of Ecology and Evolution, University of Lausanne, and Swiss Institute of Bioinformatics, Lausanne, Switzerland. 8Institute of Molecular and Cellular Biology, Siberian Branch of the Russian Academy of Sciences, Novosibirsk State University, Novosibirsk, Russia. 9INRAE, US 1426, GeT-PlaGe, Genotoul, Castanet-Tolosan, France. 10Montpellier GenomiX (MGX), c/o Institut de Génomique Fonctionnelle, Montpellier, France. 11McDonnell Genome Institute, Washington University School of Medicine, St. Louis, MO, USA. 12Institute of Neuroscience, University of Oregon, Eugene, OR, USA. 13Department of Integrative Biology, Michigan State University, East Lansing, MI, USA. 14Bond Life Sciences Center, University of Missouri, Columbia, MO, USA. 15INRA, UR1037 LPGP, Fish Physiology and Genomics, Rennes, France. 16The Xiphophorus Genetic Stock Center, Department of Chemistry and Biochemistry, Texas State University, San Marcos, TX, USA. 17Hagler Institute for Advanced Study and Department of Biology, Texas A&M University, College Station, TX, USA.
✉e-mail: matthias.stoeck@igb-berlin.de; phch1@biozentrum.uni-wuerzburg.de
V
ertebrate genome evolution has been strongly impacted by
polyploidization events
1,2. Early on, vertebrate ancestors
experienced two rounds (1R and 2R) of whole-genome
dupli-cations (WGDs)
3. The evolutionary history of the ~30,000 species of
teleost fish, which make up more than 99% of all ray-finned fishes
(Actinopterygia), is defined by a third WGD (3R) that occurred in
their common ancestor about 320 million years ago (Ma), but not in
the basal fish (bichirs, reedfish, sturgeons, paddlefishes, bowfins and
gars), the land vertebrates or their sarcopterygian forbearing
rela-tives (coelacanths and lungfishes). Some teleost groups, such as
sal-monids and carps, independently underwent another round (4R) of
WGD. Interestingly, among the basal fishes only the sturgeon lineage
is known to be prone to polyploidization events and includes
many-ploid species, some with up to 380 chromosomes.
Sturgeon genomes, however, are a missing puzzle piece for
understanding vertebrate ancestry. Sturgeons are a group of
ray-finned fish that diverged from the actinopterygian stem before
the teleost-specific 3R duplication and after the ancient 2R
event
4,5. After their divergence from the other ray-finned fish,
the various lineages of Acipenseriformes (sturgeon and
paddle-fish) experienced several polyploidization events
6, resulting in
karyotypes, comprising between ~120 chromosomes in some
species, and ~360 chromosomes in species that are considered
dodecaploid
7. The genomic basis for this parallelism between
basal and derived fish lineages to acquire WGDs is not clear.
While teleost lineages that experienced more recent 4R events are
still recognizable apparent tetraploids, the other teleost lineages
retained on average only 17% of gene duplicates from the ancient
3R ohnologues
5. The evolutionary trajectories and forces driving
species from polyploids to meiotic diploids are the subject of
major adaptive hypotheses and their empirical evaluations
8,9.
The genomic state of sturgeons is much less clear. They are often
seen as ancient polyploids. On the basis of some cytogenetic and
microsatellite data, others have considered sturgeons to be
func-tional diploids
10as result of an evolutionary process, where the gene
content of a tetraploid species degenerates to become functionally
diploid but maintains twice as many chromosomes, which form
regular bivalents
11. Such far-reaching redundancy reduction leads
one to question their polyploidy state
12.
Because sturgeons branched off early from modern fishes, their
genomes may harbour traces of the ancient vertebrate ancestors
13.
Notably, their early embryonic development is of the classical
The sterlet sturgeon genome sequence and the
mechanisms of segmental rediploidization
Kang Du
1,2, Matthias Stöck
3✉, Susanne Kneitz
1, Christophe Klopp
4,5, Joost M. Woltering
6,
Mateus Contar Adolfi
1, Romain Feron
7, Dmitry Prokopov
8, Alexey Makunin
8, Ilya Kichigin
8,
Cornelia Schmidt
1, Petra Fischer
1, Heiner Kuhl
3, Sven Wuertz
3, Jörn Gessner
3, Werner Kloas
3,
Cédric Cabau
4,5, Carole Iampietro
9, Hugues Parrinello
10, Chad Tomlinson
11, Laurent Journot
10,
John H. Postlethwait
12, Ingo Braasch
13, Vladimir Trifonov
8, Wesley C. Warren
14, Axel Meyer
6,
Yann Guiguen
15and Manfred Schartl
2,16,17✉
Sturgeons seem to be frozen in time. The archaic characteristics of this ancient fish lineage place it in a key phylogenetic
posi-tion at the base of the ~30,000 modern teleost fish species. Moreover, sturgeons are notoriously polyploid, providing unique
opportunities to investigate the evolution of polyploid genomes. We assembled a high-quality chromosome-level reference
genome for the sterlet, Acipenser ruthenus. Our analysis revealed a very low protein evolution rate that is at least as slow as
in other deep branches of the vertebrate tree, such as that of the coelacanth. We uncovered a whole-genome duplication that
occurred in the Jurassic, early in the evolution of the entire sturgeon lineage. Following this polyploidization, the
rediploidiza-tion of the genome included the loss of whole chromosomes in a segmental deduplicarediploidiza-tion process. While known adaptive
pro-cesses helped conserve a high degree of structural and functional tetraploidy over more than 180 million years, the reduction of
redundancy of the polyploid genome seems to have been remarkably random.
amphibian type and very different from that of all modern fish
14,15,
reflecting the basal divergence of the lineage.
Sturgeons are distributed from subtropical to subarctic rivers,
lakes and coastlines of Eurasia and North America
16. They are
long-lived and reproduce late, usually not before reaching an age of ten
years. In many sturgeon species, adults migrate repeatedly from
the sea into freshwater to spawn
17. Sturgeons are celebrities among
fishes because of their pre-ovulation female gametes, known as
cav-iar. Habitat destruction, the lack of river connectivity, pollution
16,18and the 2,000-year-old rural caviar production
19culminated in
ongoing devastating overexploitation that drove most sturgeon
spe-cies into a threatened status (
https://www.iucnredlist.org/
). Because
wild caviar can no longer be traded legally, sturgeon aquaculture has
gained high economic importance, and in turn can contribute to the
protection of wild populations by providing a safe market supply.
Despite their ancient lineage, peculiar biological features and
economic value, sturgeon genomes have remained largely
unex-plored owing to their dauntingly polyploid state
20. We therefore
sequenced the sterlet sturgeon, Acipenser ruthenus, a species with
only 120 chromosomes, and present here an annotated
chromo-some-scale genome assembly. We found that this genome represents
an ancient WGD, which remained close to tetraploidy owing to the
slow evolutionary rate and serves as a good representative of the
ancestral actinopterygian genome. In contrast to other polyploid
fish, deduplication after the sterlet WGD involves the loss of entire
homeologous chromosomes (segmental rediploidization). Adaptive
processes in the retention of duplicate genes are only partly
respon-sible for determining the gene content, and they worked in
paral-lel with stochastic events to shape the genomic landscape of the
tetraploid sterlet sturgeon.
Results
Genome assembly and annotation. Polyploid genomes are extremely
challenging for de novo assembly because of the coexistence
of ohnologous and allelic sequences of each original locus with
vari-ous degrees of sequence similarities. To generate a high-quality
ref-erence sturgeon genome, we produced 42-fold coverage of Illumina
sequences, 54-fold coverage with PacBio long reads and 20-fold
cov-erage of Hi-C sequences of the estimated 1.8-gigabase (Gb) genome
of a male A. ruthenus
21. For the assembly process, we considered
possible complications owing to the simultaneous presence of
poly-ploidy and heterozygosity (Supplementary Note 1). After
redupli-cation and Hi-C scaffolding, we produced a 1.8-Gb assembly with
a final N50 scaffold size of 42.4 megabases (Mb) (Supplementary
Fig. 1, and Supplementary Tables 1 and 2). The 60 largest scaffolds
correspond to 120 chromosomes of the sterlet karyotype. The
chro-mosome number of A. ruthenus can vary, however, by two to four
small chromosomes, indicating the occurrence of B chromosomes
22.
B chromosomes are enigmatic accessory elements to the regular
chromosome set. They are found in some but not all individuals
within a population and are considered to be either non-functional,
beneficial or harmful
23. Scaffold 60 consists mainly of interspersed
repetitive DNA (83.9%) and contains only three corrupted gene
remnants, thus probably representing a fully assembled B
chromo-some (Supplementary Table 2 and Supplementary Note 2).
Genome annotation combined gene evidence from
homol-ogy annotation, de novo annotation and transcripts with a
previ-ously established pipeline
24. We predicted 47,424 protein-coding
genes. BUSCO analysis revealed that the annotation contains 2,543
(98.3%) out of 2,586 conserved and complete vertebrate genes
(Supplementary Table 3).
Ancient origin and slow evolution. Sturgeons are one of the most
deeply diverging groups of bony fishes and have been referred to
as both the Leviathans and Methuselahs of freshwater fish. They
appear in the fossil record between 250 and 200 Ma, near the end of
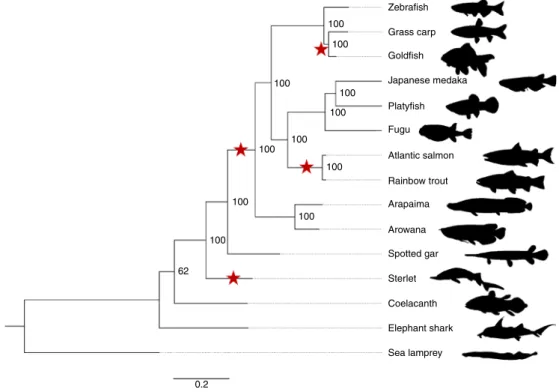
the Triassic. Our phylogenomic trees place the sterlet sturgeon basal
to the other ray-finned fishes (Fig.
1
and Supplementary Fig. 2),
100 Zebrafish Grass carp Goldfish Japanese medaka Platyfish Fugu Atlantic salmon Rainbow trout Arapaima Arowana Spotted gar Sterlet Coelacanth Elephant shark Sea lamprey 100 100 100 100 100 100 100 100 100 100 62 0.2
Fig. 1 | Phylogeny of sterlet and related species. Species tree built using RAxML on the basis of 47 one-to-one orthologues. The sea lamprey was used as the outgroup. The topology of the tree was confirmed by MrBayes (see also Supplementary Fig. 2). Red stars indicate WGDs after the 1R/2R event; numbers at branches indicate bootstrap support values based on 100 resampled data sets; the scale bar indicates the average substitutions per site; the dotted lines associate the taxon names with the branch ends.
in agreement with the current tree of life
25–28. Divergence time
infer-ence based on 275 one-to-one orthologues revealed that the
ster-let lineage had already diverged from the actinopterygian fish 345
(295–400) Ma during the Upper Devonian or Carboniferous period
(Supplementary Fig. 3), in the range of earlier estimates
28.
Because extant sturgeons show remarkably little morphological
change compared with fossils from the Triassic and because most
of the 27 extant species differ relatively little except in body size
29,
Charles Darwin called them living fossils
30. We therefore asked
whether the morphological stasis in sturgeons is matched by a
slowly evolving genome as inferred from the slower substitution
rates of several mitochondrial and nuclear genes
31. Calculations
of pairwise distances from phylogenetic trees (Supplementary
Table 4) revealed that proteins in sterlet are indeed evolving
much more slowly than in teleosts, including basal species such
as arowana and arapaima. The rate of protein evolution is even
slower than in gar, and similar to those basal lineages such as
coelacanth or elephant shark (Fig.
1
, Supplementary Tables 4–6
and Supplementary Note 3).
The repeat content (40.3%) and transposable element (TE)
composition (Supplementary Table 7) of the sterlet genome are
comparable to those in other fish (teleosts, gar, elephant shark
and coelacanth) studied so far
32. Despite representing an old,
slowly evolving lineage, the inferred transposon activity revealed
a recent expansion of all major types of TEs (Supplementary
Fig. 4a). The presence of TEs in sterlet transcriptomes, in
par-ticular of endogenous retrovirus long terminal repeat (EVR-LTR)
retrotransposons and transfer-RNA short interspersed nuclear
ele-ments (tRNA-SINEs), indicates that the sterlet retains some active
transposons (Supplementary Fig. 4b). The mobilome of the
ster-let sturgeon thus seems to be similar to that of many modern fish
genomes, including fast-evolving teleosts. This situation contrasts
notably with the slow evolution of sterlet protein-coding genes, but
recently expanding TEs and slow protein evolution also occur in
the coelacanth genome
33.
The sterlet WGD and its initial rediploidization. Cytogenetic
and microsatellite data supported the notion that polyploidy is a
general feature of sturgeons. We identified 11,765 genes that have
two copies in sterlet but only a single-copy orthologue in gar,
coel-acanth or elephant shark. We further identified in sterlet 9,914
high-fidelity ohnologue pairs with positional orthology (Supplementary
Table 8). A comparison with gar revealed double conserved synteny
for 8,752 genes (Supplementary Table 9). This all indicates a WGD
in the sterlet lineage (Ars3R) (Supplementary Fig. 5).
To estimate the timing of the Ars3R event, we calculated the
pairwise synonymous substitutions per synonymous site (dS) value
among sterlet ohnologue pairs (median, 0.064) and between sterlet
and one-to-one orthologues of five other sturgeon species (
http://
publicsturgeon.sigenae.org/home.html
) (Supplementary Note 4).
On the basis of our timing of the sterlet–Atlantic sturgeon (A. oxy
-rinchus) divergence at 166 (115–208) Ma (Supplementary Fig. 6a)
and the dS value between their orthologous pairs (median, 0.059;
Supplementary Fig. 6b and Supplementary Table 10), we deduced
that the sterlet WGD must have happened around 180 (124–225)
Ma. Thus, the Ars3R genome duplication event is older than the
salmonid WGD at 80–100 Ma (refs.
34,35) and the carp–goldfish 4R
estimated at 14 Ma (ref.
36).
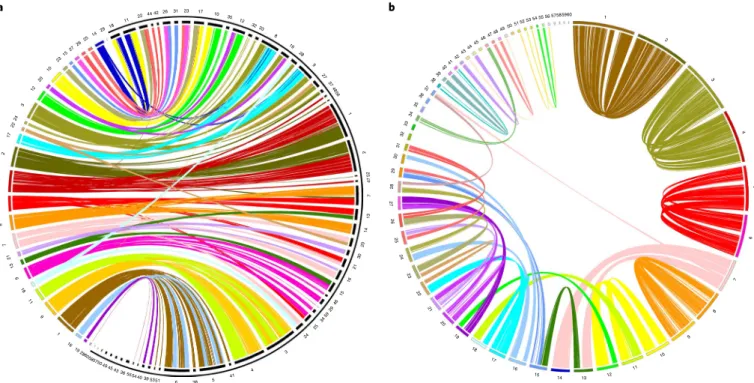
The analysis of conserved syntenies between sterlet and gar
revealed that most gar chromosomes have two counterparts in
sterlet (Fig.
2a
). When sterlet ohnologous gene pairs were mapped
against the genome scaffolds, they delineated 46 scaffolds, also in a
pairwise fashion. This result indicates homeologous chromosome
segments, as expected from a WGD event (Fig.
2b
, Supplementary
Figs. 7 and 8, and Supplementary Notes 5 and 6). To confirm this
conclusion, we used sequence libraries, prepared from individual
31 26 42 44 22 11 18 29 51 50 49 48 47 14 25 26 27 15 23 10 20 4445 46 43 42 41 40 39 38 37 12 3 24 22 17 2 4 5 8 7 36 35 34 33 32 31 30 29 28 27 26 25 24 23 22 21 20 19 18 17 16 15 14 13 12 11 10 9 8 7 6 5 4 3 2 1 21 13 9 18 11 9 1 16 19 2860 585750 49 4543 36 55544039 5351 6 38 5 41 4 3 24 25 3459 29 46 15 16 21 30 20 14 13 7 47 52 2 1 56 48 37 27 9 28 19 8 33 32 12 23 59 58 57 56 52 5354 55 60 17 10 35 a b
Fig. 2 | Homology and homeology relationships of sterlet chromosomes. a, Chord diagram displaying the gene orthologies between 29 spotted gar chromosomes (left, coloured) and 60 sterlet chromosomes (right, black, bracketed by outer black partial circle) on the basis of 21,085 orthologous pairs (pairwise synteny was confirmed by the criterion of at least four orthologous genes, arranged in a row with the largest gap being fewer than 15 genes). b, Chord diagram depicting homeology relationships of 60 sterlet chromosomes on the basis of 9,301 ohnologue pairs (pairwise synteny was confirmed by the criterion of at least five ohnologues, arranged in a row with the largest gap being fewer than 15 genes). The chromosomes are ordered by size.
microdissected chromosomes or chromosome arms of the
ster-let
37,38. In whole-mount in situ-hybridizations, each of these probes
painted two pairs of sterlet metaphase chromosomes and
chromo-some arms, respectively, identifying likely ohnologous pairs. Reads
from each of the libraries aligned specifically to individual scaffolds,
which thereby could be assigned to either of the homeologous
chro-mosome segments (Supplementary Figs. 9 and 10, Supplementary
Note 6 and Supplementary Data 1).
Remarkably, most of the large homeologous chromosomes (1–6,
8 and 9) are conserved over their full length, while the majority of
the intermediate-sized chromosomes have ohnology-relationships
to two other chromosomes. The alignment of chromosomes by
LAST indicated that whole chromosome arms were exchanged,
most probably in reciprocal translocation events (Supplementary
Figs. 8 and 11, and Supplementary Note 5).
Interestingly, the remaining 11 scaffolds, corresponding to
smaller chromosomes, contain exclusively singletons or only a
small region with ohnologues on another chromosome, while the
remainder of the chromosome only contains singletons. Those
small ohnologue regions are obviously translocations from other
chromosomes (Supplementary Fig. 12a). We conclude that the
entire homeologue or the majority region of the counterparts of
those smaller, whole-chromosome-representing scaffolds, were lost
after the Ars3R (Supplementary Fig. 13). This result indicates that a
relevant part of the deduplication process in sterlet occurred by the
loss of whole chromosomes or large chromosome fragments and is
segmental. This mechanistic conclusion is in contrast to the
contin-uous and genome-wide small-scale ohnologue-by-ohnologue loss
in carp/goldfish and salmonids (Supplementary Fig. 12b–d). Earlier
molecular cytogenetic studies of sterlet also pointed to a karyotype
that is segmental rather than ubiquitously polyploid
38. Such
large-scale reduction of duplicates in polyploid organisms, through the
loss of whole chromosomes or large chromosome segments, has so
far been reported only in autotetraploid yeasts
39,40, flowering plants
41and endopolyploid human cancer cells
42.
Polyploidy can result from duplication of the whole genome in
one organism (autopolyploidy) or from the interbreeding of two
divergent species with subsequent genome doubling that restores
meiotic pairing and disomic inheritance (allopolyploidy). Both of
these mechanisms—interspecific hybridization and
autopolyploidi-zation—have been discussed to account for the origin of the sterlet
chromosome complement, on the basis of conflicting evidence
12.
To clarify this controversy, we used a strategy that was employed
to investigate this problem in the allopolyploid African clawed
frog, Xenopus laevis, where the fast-evolving repeats and relics of
the mobilome are specific to the allopolyploid ancestors, and thus
markers for the ancestral chromosomal segments of the two
paren-tal species
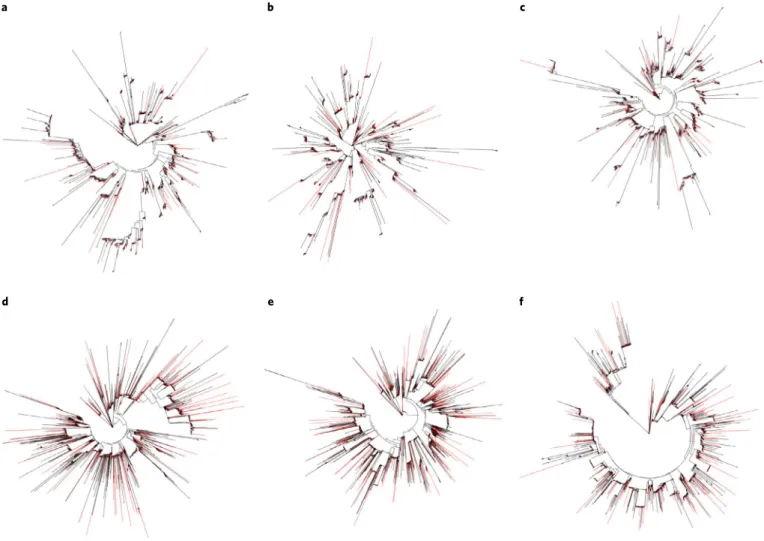
43. A comparison of the TE landscape of sterlet paralogous
chromosomes revealed that each pair has an almost identical TE
content and that individual TE families are monophyletic (Fig.
3
a b c
d e f
Fig. 3 | Phylogeny of DNA/PIF-Harbinger and DNA/TcMar-Tc1 repeat families on homologous chromosomes. a, DNA/PIF-Harbinger on homologous chromosomes 1 (red) and 2 (black). b, DNA/PIF-Harbinger on homologous chromosomes 3 (red) and 4 (black). c, DNA/PIF-Harbinger on homologous chromosomes 5 (red) and 6 (black). d, DNA/TcMar-Tc1 on homologous chromosomes 1 (red) and 2 (black). e, DNA/TcMar-Tc1 on homologous chromosomes 3 (red) and 4 (black). f, DNA/TcMar-Tc1 on homologous chromosomes 5 (red) and 6 (black).
and Supplementary Fig. 14). The sterlet genome thus shows no
evi-dence for allopolyploidy.
Chromosomes that have retained a homeologous partner share
to a large extent even their gene order (Supplementary Figs. 7 and 8).
This phenomenon has also been observed in many polyploid plant
species and is called positional orthology
44,45. It is explained as a
consequence of multivalent pairing in meiosis. Multivalent pairing
would also explain tetrasomic inheritance in sterlet, noted earlier
from microsatellite studies
12.
The duplication of a whole genome creates a situation, where
one of the two copies is in principle dispensable. The retention of
duplicates is explained by several models
46. They may be preserved
if one copy evolves a new positively selected function and
simul-taneously loses the essential function retained by the other copy
(neofunctionalization) or if ancestral positively selected functions
partition between the two copies (subfunctionalization)
9. The gene
balance hypothesis posits that ohnologues persist because the loss
of one copy would lead to a detrimental change in the
stoichiom-etry of macromolecular complexes, the interactome and signalling
pathways
47. The majority of duplicates, however, are predicted to
become non-functional or get lost (degeneration)—for example,
the ohnologue retention rate from the teleost WGD in the extant
teleosts is estimated to be only 15–20%
48. On the basis of
non-coding microsatellites, the sterlet was proposed to have undergone
extensive duplicate gene degeneration and has been classified since
then even as a functional diploid species
10. To estimate the duplicate
retention rate, we identified 9,914 high-fidelity pairs of ohnologues
and 4,175 singletons (Supplementary Note 7). This dataset
repre-sents a duplicate retention rate of 70% (Supplementary Table 11),
considerably higher than in all teleosts, including the 4R salmonids
(Supplementary Note 8). Considering functional terms, we found
that sterlet ohnologues are enriched for transcriptional regulators
(genes involved in protein turnover, signal transduction, cell
prolif-eration and development), in agreement with predictions from the
gene-balance-hypothesis
47. Sterlet singletons are enriched for genes
with functions in DNA metabolism, intracellular transport and
mitochondria. Enrichment for such categories has been observed
in other polyploids, even in plants
49–51(Supplementary Table 12).
Like the situation reported for rainbow trout
34, we found the coding
sequence of singletons to be significantly shorter than that of
ohno-logues (12%, P
< 2.2 × 10
−16; Supplementary Fig. 15). Long genes
may be over-retained as ohnologues, potentially owing to more
opportunities for protein domain subfunctionalization.
In our analysis of transcriptomes from 23 different sterlet
organs and developmental stages, we observed the expression
of one or both genes for 9,243 of the 9,914 ohnologue pairs. We
found 1,139 ohnologue pairs, which showed equal expression in
all samples (Supplementary Fig. 16a). We then searched for genes
with differing expression patterns among samples, which would be
explained by drift models of expression change or would indicate
the degeneration or neofunctionalization of one duplicate, or
sub-functionalization of both copies. We found 3,230 ohnologue pairs
with different expression in at least two samples (Supplementary
Fig. 16b and Supplementary Note 8). From just 38 of these
ohno-logue pairs, only one of them was expressed but never the other in
all organs tested. Such a pattern is expected if regulatory elements
are degenerating in the redundant copy. For 341 ohnologue pairs,
the expression of duplicates was partitioned between different
organs or developmental stages. This may indicate
subfunctional-ization of this subset of genes.
The availability of the sterlet genome now allows the revisitation
of important questions concerning the forces that affect the
evolu-tionary fate of gene duplicates. We compared the genomes of sterlet,
salmon, trout, goldfish and zebrafish, using gar as the outgroup, to
find genes that were commonly retained in duplicate after the
vari-ous polyploidization events (Supplementary Note 9). We found only
27 such genes (Supplementary Figs. 17a and 18, and Supplementary
Table 13). This finding suggests complex, independent, lineage-
specific evolutionary processes of duplicate retention.
In the same set of species, we identified 191 genes that are
single-tons in all of them (Supplementary Note 9). Notably, 39 of these
sin-gletons are arranged in eight syntenic blocks. A similar phenomenon
was seen for the commonly retained ohnologues (Supplementary
Figs. 17b and 19, and Supplementary Table 14). The loss or
reten-tion of linked genes after WGDs could be explained by the
func-tional relationships of their gene products—for example, through
protein–protein interactions
52. However, a search of singleton genes,
embedded in syntenic blocks using the STRING
53database, did not
reveal such protein–protein interactions. An alternative explanation
for the conservation of microsynteny is the bystander relationship
54,
where the regulatory region of one gene is located in neighbouring
genes. Further studies are required to validate this type of physical
association of genes on chromosomes over long evolutionary times
rather than functional relationships of their encoded proteins.
Genome and gene evolution. Positive selection. Up to 210 genes
(Supplementary Table 15) in sterlet are under positive
selec-tion, depending on the set of actinopterygian or vertebrate
genomes, with which its full gene complement was compared
(Supplementary Table 16). Positively selected genes spanned a
wide spectrum of cellular and molecular functions and pathways
with no particular enrichment.
When the ratios of substitution rates at non-synonymous versus
synonymous sites (dN/dS values) were compared between sterlet
singletons and ohnologues, we found that most retained
ohno-logues present higher dN/dS values than singletons (Supplementary
Fig. 20), indicating relaxed purifying selection on ohnologues. This
result would be expected because of ohnologue redundancy
55,56. A
pairwise test of dN/dS for the 9,914 ohnologue pairs revealed that
207 are under positive selection in sterlet, pointing to
neofunction-alization or subfunctionneofunction-alization at the protein level (Supplementary
Table 17). Notably, many immune-related genes are positively
selected, indicating that the sterlet host defence system may have
made have especially profited from the WGD for evolutionary
prog-ress sensu Susumo Ohno
57. A similar phenomenon was observed
for duplicated immune genes in salmon
58.
Dynamics of gene family size. We compared the rates of gene family
(8,150 gene families) dynamics between phylogenetic tree branches
with different WGD histories and found that gene family sizes
changed much faster in branches with 4R and Ars3R than in branches
with more ancient polyploidization (Supplementary Note 10).
Interestingly, one of the most expanding families is the zona
pel-lucida (Zp) sperm-binding proteins (ID: 4190). Zp-proteins
pre-vent polyspermy in mammals
59and provide thickness and hardness
to the fish egg envelope
60. A total of 116 zp genes were annotated
in sterlet (Supplementary Table 18 and Supplementary Note 11).
A similar expansion was noted in cold-adapted teleosts and
explained as a protection mechanism from physical forces for the
developing embryo
61,62. The biological reason for the zp gene
fam-ily expansion in sturgeon is unclear. Because sturgeons spawn on
a coarse substrate often in high current velocities, a hard envelope
provides protection against mechanical stress of the adhesive eggs
on the spawning substrate as well as against polyspermy that would
be possible through the multiple micropyles of their eggs. This
bio-logical feature might contribute to the crispness of the caviar.
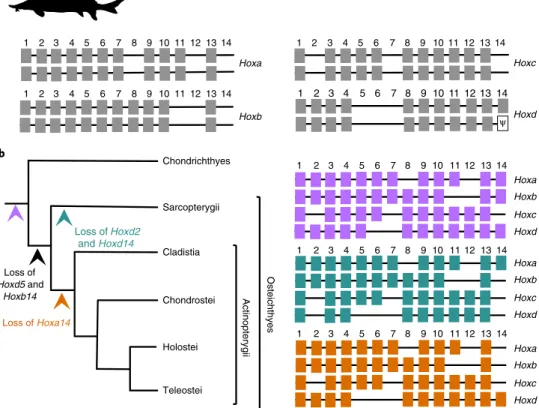
Evolution of sterlet hox clusters after genome
tetraploidiza-tion and inference of the ancestral vertebrate Hox complement.
The sterlet has eight hox clusters containing 88 genes, reflecting
the 1R/2R/3R history of its genome (Fig.
4a
and Supplementary
Note 12). Pseudogenization was apparent for only one hoxd14 gene.
The sterlet therefore retains the most complete 3R hox cluster
dupli-cates and the highest number of 3R hox gene ohnologues amongst
ray-finned fish. The comparison of the hoxd flanking gene deserts,
containing long-range regulatory elements
63–66, indicates high
con-servation of ultraconserved elements (Supplementary Fig. 21). The
preservation of all duplicated hox clusters as well as their low
diver-gence, including that of their regulatory regions, shows a
remark-able slow evolution of these genomic loci. This stability contrasts
sharply with rapidly evolving teleosts, which often show extensive
remodelling of duplicated hox clusters
4,67–73.
The hox gene complement in sterlets indicates an identical
pre-tetraploidization hox gene arrangement and repertoire with the gar
(diverging ~345 Ma). Because both species represent
early-branch-ing ray-finned fish, this similarity strengthens the scenario whereby
hoxd5 and hoxb14 were lost in the common ancestor of bony
verte-brates (Euteleostomi) and hoxa14 in the common ancestor of
acti-nopterygians
66(Fig.
4b
).
Over-retention of glutamate receptor genes. Glutamate receptor genes
(GRGs) show particularly high ohnologue retention rates in
tele-osts
74, which has been connected to the extraordinary cognitive
abilities of many teleost species compared with other basal
verte-brates. We found that 23 of 26 GRGs retained their Ars3R
ohno-logue, an ohnologue retention rate of 88.5% (Supplementary Fig. 22,
Supplementary Table 19 and Supplementary Note 13). Compared
with the genome-wide rate of 70% (9,914 ohnologs and 4,175 As3R
singletons), the GRG Ars3R ohnologue retention rate is
signifi-cantly higher (P = 0.04345, chi-square test). GRGs have thus been
convergently over-retained, following the Ars3R and teleost 3R
WGD, although to a lower extent in sturgeons.
Absence of differentiated sex chromosomes. The relative rarity of
polyploidy in animals versus plants has been ascribed to the
dis-ruption of sex determination in gonochoristic animals after genome
duplication
75–77. Differentiated sex chromosome pairs have largely
different gene contents, to which many animals have adjusted by
elaborate expression dosage compensation mechanisms. The
dis-turbance of dosage compensation and the disruption of the
chro-mosomal system that determines the sex ratio are thus immediate
negative consequences of polyploidization
78. Data from induced
gynogenesis led to the common belief that all Acipenser species,
including sterlet, have a female heterogametic (ZZ/ZW) sex
chro-mosome system
79,80. To find out if the polyploid sterlet has
differ-entiated sex chromosomes, we searched for sex-linked sequence
differences using a restriction site associated DNA (RAD)
sequenc-ing approach. A total of 176,735 markers were obtained, but none
showed a bias or specificity for males or females (Supplementary
Fig. 23). This result indicates that the sterlet does not have sex
chro-mosomes with considerable sequence differentiation that would
require dosage compensation and impair the occurrence of
poly-ploidy. Our data are in agreement with the absence of differences
in chromosome morphology and previous failures to isolate
sex-specific molecular markers
81.
Discussion
The high-quality chromosome-level genome of the sterlet sturgeon
permitted important advances in our understanding of the
evolu-tion of this lineage of ancient fish. Our results show that the
ster-let lineage branched from the vertebrate tree of life about 345 Ma,
shortly after the basal split between the linage of ray-finned fish and
that of lungfish, coelacanth and land vertebrates happened. While
Chondrichthyes Sarcopterygii Cladistia Chondrostei Holostei Teleostei Actinopterygi i Loss of Hoxd5 and Hoxb14 Loss of Hoxd2 and Hoxd14 Loss of Hoxa14 14 13 11 10 9 1 2 3 4 5 6 7 8 12 14 13 11 10 9 1 2 3 4 5 6 7 8 12 14 13 11 10 9 1 2 3 4 5 6 7 8 12 Hoxa Hoxb Hoxc Hoxd Hoxa Hoxb Hoxc Hoxd Hoxa Hoxb Hoxc Hoxd Osteichthyes Hoxb Hoxa 14 13 11 10 9 1 2 3 4 5 6 7 8 12 14 13 11 10 9 1 2 3 4 5 6 7 8 12 Hoxd 14 13 11 10 9 1 2 3 4 5 6 7 8 12 a b Hoxc 14 13 11 10 9 1 2 3 4 5 6 7 8 12 ψ
Fig. 4 | Structure and evolution of hox clusters. a, Schematic illustration of the sterlet hox complement. We identified 88 hox genes plus one
pseudogenized hoxd14 gene (indicated by psi). All hox clusters are retained in duplicate. b, Reconstruction of the ancestral actinopterygian condition and the inference of gene losses across the gnathostome phylogeny on the basis of the sterlet pretetraploidization hox complement in combination with that of the gar. The inferred ancestral Hox complements are shown in purple (likewise indicated by the purple arrowhead in the tree) for gnathostomes, in blue for Sarcopterygii and in orange for Actinopterygii.
the sterlet’s slow evolutionary rate of protein-coding genes is not
entirely unexpected, given the morphological stasis exhibited in
the sturgeon lineage, many of the features of the sterlet’s polyploid
genome are much different from those of other polyploid lineages.
Clearly, genomic and phenotypic evolution do not always march to
the beat of the same drummer.
All sturgeons are characterized by polyploidy as a genetic
hall-mark and paramount feature. It has been proposed that those
extant sturgeons with ~120 chromosomes (like the sterlet)
repre-sent functional diploids, which originated over 200 Ma by a WGD
of a 60-chromosome diploid ancestor
82. The transition between the
ancestral fully tetraploid and the modern functional diploids was
proposed to have been accompanied by a reduction of duplicate
gene functions
12. Our estimate of 180 Ma for the Ars3R provides
evidence for a WGD in the ancestor of all sturgeons, and that the
WGDs that led to the ~240- and ~360-chromosome species
hap-pened later, on top of the Ars3R. We found that despite the long
evolutionary time that has elapsed since the sturgeon WGD, the
sterlet has not returned to a diploid state by gene content or gene
expression. Instead, the sterlet has retained an unexpectedly high
degree of structural and functional polyploidy. This retention can
be ascribed to the slow pace of molecular evolution of most
frac-tions of the sterlet genome.
The slow evolution may also explain why the sterlet genome in
several aspects represents an earlier step in the process of
redun-dancy-reduction than the salmonid genomes, which originated
from a more recent WGD. During the evolution of a polyploid
genome, the initial one-to-one relationship of whole chromosomes
(as still seen in the goldfish) is reduced to homeology between arms
of chromosomes and then further to much smaller regions (as
evi-dent in salmonids). Sterlet seems to be in the transition towards the
highly dynamic pattern of colinear duplicated blocks, but still has
some fully homeologous chromosomes (Supplementary Fig. 24).
A recent wave of TE multiplication apparently swept through
the sterlet genome after the Ars3R. The large-scale expansion and
movement of TEs are known to increase under genomic stress
83,
suggesting that WGDs cause TE activation. TE expansions in the
centromere induce chromosomal instability
84and might have
facilitated the large chromosome rearrangements of homeologue
arm changes.
The timing of the Ars3R to have evolved earlier than the
cyp-rinid and salmonid 4Rs allows comparisons of the three apparent
tetraploid lineages to give insights into the processes of polyploid
genome evolution. Despite its apparent evolutionary advantage as
a source of genomic matter for evolution in the long term,
tetra-ploidy seems to be an evolutionarily unstable situation. In all known
instances, the initial dispensability of two sets of genes led to
dedu-plication of the genome, with only a certain fraction of gene
dupli-cates being retained.
The process of duplicate gene loss after the teleost, salmonid
and goldfish WGDs affected the whole genome in a homogenous
fashion. Unexpectedly, the sterlet genome analysis uncovered a
phenomenon that creates a segmental rather than a continuous
par-tial tetraploidy. In the sterlet, most chromosomes or chromosome
arms were found to be in either a diploid or a tetraploid state. The
loss of entire chromosomes can be seen as a fast stochastic process
for rediploidization.
The numbers of genes that were either commonly retained or
deduplicated after the WGDs in the fish lineages are substantially
above random but are much lower than one would expect if strong
adaptive processes determined duplicate retention or loss on the
single-gene level. This conclusion, and our finding that structural
features rather than protein–protein interactions are relevant for
the deduplication of neighbouring genes, suggest complex
pro-cesses of different lineage-specific evolutionary drivers of duplicate
retention, and largely stochastic events in redundancy reduction.
In sterlet, besides the adaptive evolutionary mechanisms, neutral
processes have considerably shaped its genome, most obviously
man-ifested by the loss of whole chromosomes from homeologues pairs.
Methods
Experimental animals. All fish used in this study were derived from the sterlet sturgeon population maintained at the Leibniz-Institute of Freshwater Ecology and Inland Fisheries. This stock is derived from the Danube population of A. ruthenus. Adult individuals were sexed by gonad morphology and gamete content. The fish were euthanized by state-of-the-art humane killing (American Veterinary Medical Association, Canadian Council of Animal Care in Science). The experiments were carried out in accordance with the European Directive 2010/63/EU and German national legislation (animal protection law, TierSchG). All experimental protocols that are part of this study were approved through an authorization (File No. ZH 114, issued 6 February 2014) of the LAGeSo, Berlin, Germany.
Genome sequencing and assembly. The DNA for sequencing was derived from the testis and blood of a single adult male. We generated ×42 Illumina reads (150-base-pair (bp) paired end) on a Novaseq 6000 platform with libraries produced using the TruSeqDNA PCR-Free kit. A 53.7-fold coverage of genome sequences was produced with PacBio Sequel technology. Hi-C library generation
was carried out according to a protocol adapted from Foissac et al.85. A blood
sample was spun down, and the cell pellet was resuspended and fixed in 1% formaldehyde. Five million cells were processed for the Hi-C library. After overnight digestion with HindIII (NEB), the DNA ends were labelled with Biotin-14-DCTP (Invitrogen), using Klenow enzyme (NEB), and then religated. Next, 1.4 µg of DNA were sheared by sonication (Covaris) to an average size of 550 bp. Biotinylated DNA fragments were pulled down using M280 Streptavidin Dynabeads (Invitrogen) and ligated to paired-end adaptors (Illumina). The Hi-C library was amplified using paired-end primers (Illumina) with 10 PCR amplification cycles. The library was sequenced using HiSeq3000 (Illumina) generating 150-bp paired-end reads at 20-fold genome coverage.
The raw Sequel BAM files were converted into subreads in fasta format using
the SMRT Link software package (v.5.0.1) from Pacific Biosciences86. PacBio reads
were assembled with smartdenovo (v.1.0)87 with standard parameters. Contigs
were polished with two rounds of racon88 (v.1.3.1), using long reads aligned
with minimap2 (ref. 89) (v.2.7) and three rounds of pilon90 (v.1.22), using 42-fold
Illumina reads. The Illumina reads were aligned with bwa mem (v.0.7.12-r1039)91
with standard parameters and the same file, which had been compressed, sorted
and indexed with samtools view, sort and index v.1.3.192, using standard parameters
before pilon polishing. The genome size was 15% smaller than expected, and a fraction of the contigs showed twice the expected read alignment depth, indicating that chromosome parts had merged during assembly. The single- and double-copy coverage threshold was found by visual inspection of the contig coverage bimodal distribution, and the contigs were separated into two sets, corresponding to single and double coverage. A polymorphism VCF file was generated from the short
read alignment file with freebayes93 (v.1.1.0) under standard parameters. The VCF
file shows an overall much higher variation density in double coverage contigs. PacBio long reads were used in the next steps to generate haplotypes of these variations to split the genomic locations that had been merged. Long reads were aligned to contigs, and the alignments of double coverage contigs were processed
with HapCut294 (v.1.0) using the following parameters: extractHAIRS –ont 1 and
HAPCUT2 –ea 1. For each contig, a haplotyped VCF file was produced. Some of these files contained more than one haplotypic segment. These contigs have been split according to the haplotypic segment information found in the VCF file, using an in-house script. The resulting haplotyped VCF files were then processed
with fgbio (v.0.7.0 using standard parameters)95 to generate VCF files, separated
by haplotype. These VCF files and the reference were used to produce haplotypic
contigs using vcf-consensus from the bcftools96 package v.1.8 under standard
parameters. Both contig sets, unique and split, were then merged using the Unix
cat command. The Hi-C short reads were aligned to the contigs with Juicer97, and
the scaffolding was performed with 3D-DNA98 with parameter -r = 0. Finally, the
candidate assembly was manually reviewed using the Juicebox Assembly Tools99.
The contig metrics were calculated with the assemblathon_stats.pl script. Repeat annotation and TE analysis. To search for repeated elements, the sterlet genome and raw Illumina reads were used as input. The assembled genome
was used in the RepeatModeler open-1.0.11 tool100 with standard settings.
LTR-retriever v.2.5 (ref. 101) was used to search for full-length LTR elements, and the
data were used as input derived from the LTRharvest102 (-similar, 90; -vic, 10;
-seed, 20; -seqids, yes; -minlenltr, 100; -maxlenltr, 7,000; -mintsd, 4; -maxtsd, 6;
-motifmis, 1) and LTR_FINDER103 (-D, 15,000; -d, 1,000; -L, 7,000; -l, 100; -p, 20;
-CM, 0.9) tools. To exclude non-LTR (-linelib) and DNA transposons (-dnalib), protein sequences of these TEs from the RepeatPeps database of the RepeatMasker
tool104 were used. This also excluded protein sequences that were not related to
TEs. The SWISS-PROT sequence library105 was also used (-plantprotlib).
The sequences obtained using the previous steps were combined into a single
file was aligned against the RepBase v.24.07 (ref. 107) and FishTEDb108 databases
using blastn (-evalue, 10 × 10−100) and against SWISS-PROT and RepeatPeps using
blastx (-evalue, 10 × 10−100)109 to filter incorrectly annotated sequences.
Raw reads were used in the TAREAN tool110, which is part of RepeatExplorer111.
The reads were first trimmed using the fastp tool112 to remove low-quality
and adapter sequences (detect_adapter_for_pe -g -c -l 50 -5 -3), after which RepeatExplorer was used with standard settings. We saved only satellite sequences with high confidence and added them to the library of repeated
sequences. In addition, using REXdb113, a database of TE domains implemented
in RepeatExplorer2, the correctness of the previous TE annotation was further verified. The content of repeated elements in the genome was estimated using RepeatMasker open-4-0-9-p2 (-s −no_low −lib). To build the Kimura plot, the createRepeatLandscape.pl script from the RepeatMasker tool was used.
To analyse the expression of TEs, raw reads from RNA-seq were used. The reads were trimmed using fastp (–detect_adapter_for_pe -g -c -5 -3) and then aligned against the FASTA file containing TE sequences obtained in the previous
step using bowtie2 v.2.3.5.1 (ref. 114) (–very-sensitive –dovetail). The raw read
count for each superfamily was calculated. The raw counts were normalized to the total number of sequences (reads per million, the number of aligned reads for each superfamily × 1000000/total number of reads), and then the proportion
of superfamilies in the transcriptome was calculated (reads per million × 100/
total number of aligned reads). To compare the RNA-seq data with the genome proportion of the respective TE superfamily, the proportion of TEs in the genome was calculated (the number of nucleotides occupied by superfamily in the genome × 100/total nucleotides occupied by TEs in the genome). The results were
transformed to the log10 values and visualized with ggplot2115 and MATLAB116.
Genome annotation. Genome annotation was done by an in-house pipeline
(Supplementary Fig. 25) improved from a previous version24. First, the pipeline
assessed the assembly quality using BUSCO on the basis of the Actinopterygii odb9
database117. The parameter -long was used for the first training of AUGUSTUS
v.3.2.3 (ref. 118). The pipeline then identified and masked repeat elements from
the assembly. Repeat elements were identified using blastx v.2.2.28+ with the protein repeat database RepeatPeps (http://www.repeatmasker.org/), and using RepeatMasker with two nucleotide repeat databases, one produced by RepeatModel (http://www.repeatmasker.org/), and the other an in-house fish
repeat database combining our annotation and the one from Shao et al.108. Simple
and low-complexity repeats were then softmasked, while those with known family were hardmasked. After repeat masking, the pipeline collected gene evidence from homology annotation, de novo annotation and RNA-seq annotation. For homology annotation we first pooled protein sequences from SWISS-PROT (www. uniprot.org) and 13 Ensembl genomes (v.95, http://www.ensembl.org): human (Homo sapiens), mouse (Mus musculus), coelacanth (Latimeria chalumnae), spotted gar (Lepisosteus oculatus), zebrafish (Danio rerio), cod (Gadus morhua), tilapia (Oreochromis niloticus), medaka (Oryzias latipes), platyfish (Xiphophorus maculatus), fugu (Takifugu rubripes), tetraodon (Tetraodon nigroviridis), stickleback (Gasterosteus aculeatus) and sea lamprey (Petromyzon marinus), and reduced the redundancy using CD-HIT (http://www.bioinformatics.org/cd-hit/), which resulted in 544,476 proteins. These were mapped to the assembly using
exonerate v.2.2.0119 and Genewise2-2-0 (ref. 120) respectively. Before Genewise was
implemented, genBlastA1.0.1 (ref. 121) was used to roughly locate each protein on
the assembly. For de novo annotation, SNAP v.2006-07-28 (http://korflab.ucdavis.
edu) and GeneMark-ES122 were independently used. For RNA-seq annotation,
RNA-seq reads from juvenile male mixed organs, adult male muscle, spleen, skin, testis, female brain, liver and ovary were mapped and assembled using Tophat
and cufflinks v.2.1.1 (ref. 123). In parallel, HISAT2 v.2.1.0, Trinity v.2.4.0 and PASA
v.2.2.0 (refs. 124,125) were also used for RNA-seq read mapping and assembly. In total,
89.5% of all transcriptome reads mapped to the genome.
All gene evidence obtained from the three kinds of annotation was collected
and transferred to EVidenceModeler v.1.1.1 (ref. 126), where gene models confirmed
by all lines of evidence were extracted as high-quality gene models. They were used for the second training of AUGUSTUS. Finally, the AUGUSTUS specially trained for sterlet took all the hints from BUSCO, repeat masking and all three annotations to predict the final set of gene models for sterlet. Some broken or artificial chimaeric gene models were found and replaced by comparing the AUGUSTUS prediction with the homology gene evidence. Low-quality gene models were removed afterwards. To assign gene symbols, their protein sequences were blasted
to the SWISS-PROT database (www.uniprot.org/e) (blastp v.2.2.28+ (ref. 127);
percentage of identical matches, >20%; e-value, <1 × 10⁻⁵), and the symbol of the
best hit was taken (https://biodbnet-abcc.ncifcrf.gov/)128. DeepGO was used to
annotate gene ontology terms for each gene129.
To annotate non-coding RNAs (ncRNAs), we adapted the method from Ensembl (http://ensemblgenomes.org/info/data/ncrna). tRNAs were screened
using tRNAscan-SE v.2.0.3 (ref. 130), and ribosomal RNAs were identified using
RNAmmer131. The rest of the ncRNAs were then predicted using Infernal with
Rfam v.14.1 (ref. 132,133).
Orthology assignment. To infer gene homology among sterlet, P. marinus (sea lamprey), C. milii (elephant shark), L. chalumnae (coelacanth), L. oculatus (spotted
gar), A. gigas (Arapaima), S. formosus (arowana), O. mykiss (rainbow trout), S. salar (Atlantic salmon), T. rubripes (Japanese fugu), X. maculatus (platyfish), O. latipes (Japanese medaka), C. auratus (goldfish), C. idellus (grass carp) and D. rerio (zebrafish) (see Supplementary Table 20), we used a method that reconciles species trees for the inference of orthologues. We kept the longest protein sequence for each gene and performed an all-against-all blast using blastp v.2.2.28+ with
an e-value cut-off at 1 × 10⁻⁵ (ref. 127). Between each two protein sequences, the
similarity distance was measured using H-score134, on the basis of which all protein
sequences were clustered into groups (gene families) using Hcluster_sg135 with sea
lamprey set as the outgroup. For each group, a gene tree was constructed using
TreeBeST v.0.5 (ref. 136) with the species tree guiding. Then, on the basis of the gene
tree, orthology relationships among genes were determined as n to m (n and m are positive integers; there are cases where n = m) using an in-house Perl (https://www. perl.org) script.
Phylogenetic analysis and divergence time estimation. We reconstructed the phylogenomic tree for sterlet on the basis of one-to-one orthologues across 15 species. These protein sequences were first aligned using MUSCLE v.3.8.31
(ref. 137); regions with bad quality were then trimmed using trimAl138 with the
following parameters: -gt, 0.8; –st, 0.001; –cons, 60. The resulting alignments
were concatenated and transferred to RAxML v.8.2.9 (ref. 139) for phylogenetic
tree reconstruction. The parameter PROTGAMMAAUTO was used to select the optimal amino acid substitution model. Sea lamprey was set as the outgroup, and 100 bootstraps were performed to test for robustness.
For an additional confirmation of the phylogenomic tree, we also used
MrBayes v.3.2.6 (ref. 140). The Markov chain Monte Carlo algorithm was
implemented in 3 runs with a total of 6 chains for 500,000 generations. Trees were sampled every 1,000 generations, and in the end the first 25% of the sampling were discarded as burn-in. After the burn-in threshold, the average standard deviation of split frequencies remained ≤0.01.
To infer divergence time, we used MCMCTree141 under a relaxed-clock
model (correlated molecular clock) with approximate likelihood calculation
and maximum likelihood estimation of branch lengths performed142. First,
the phylogenetic tree and the coding sequences alignment were imported into
baseml141 to roughly estimate the substitution rate. The substitution model was
determined using modelgenerator.jar143. Then mcmctree was run for the first time
to estimate the gradient and Hessian. The resulting file, out.BV, was then used for the final run of MCMCTree to perform approximate likelihood calculations. The final Markov chain Monte Carlo process was run for 2,005,000 steps. The first 5,000 steps were discarded as burn-in; then 20,000 samples were collected with sampling every 100 steps. We set four fossil calibrations: O. latipes–T. nigroviridis
(~96.9–150.9 Ma), D. rerio–G. aculeatus (~149.85–165.2 Ma)144, A. gigas–
S. formosus (~110–156 Ma)145,146 and a time for the root (<700 Ma).
Positive selection analysis. Protein and complementary DNA fasta files from all fish (Supplementary Table 14) were downloaded. To identify orthologous proteins,
all protein sequences were compared with sterlet using inparanoid147 with default
settings. To match proteins and cDNA, sequences were blasted by tblastn, and only 100% hits were kept. Codon alignments for the protein–cDNA sequence pairs
were constructed using pal2nal v.14 (ref. 148). The resulting sequences were aligned
by MUSCLE137 (option: -fastaout), and poorly aligned positions and divergent
regions of cDNA were eliminated by Gblocks v.0.91b (ref. 149) (options: -b4, 10;
-b5, n; –b3, 5; –t = c). An in-house script was used to convert the Gblocks output to paml format.
For the generation of a phylogenetic tree as input for the detection of positive selection, sequences from all homologous genes, detected by inparanoid, were concatenated after the selection of conserved blocks by Gblocks and aligned using
MUSCLE. The tree was generated using Phylip v.3.696150 with Callorhinchus milii
(comparison1–3) or L. chalumnae (comparison4) as the outgroup (Supplementary Table 14). For the phylogenetic analysis by maximum likelihood, we used the
Environment for Tree Exploration toolkit151, which automates CodeML and
Slr analyses by using preconfigured evolutionary models. For the detection of genes under positive selection in sterlet, we compared the branch-specific model bsA1 (neutral) with the model bsA (positive selection) using a likelihood ratio test (FDR ≤ 0.05). To detect sites under positive selection, naive empirical Bayes probabilities for all four classes were calculated for each site. Sites with a probability >0.95 for either site class 2a (positive selection in the marked branch and conserved in the rest) were considered. The common species tree was drawn by the interactive Tree of Life tool (iTOL, https://itol.embl.de/) with default settings. Transcriptome analysis. Total RNA was isolated using TRIzol Reagent (Thermo Fisher Scientific) according to the supplier’s recommendation, in combination with the RNeasy Mini Kit (Qiagen). To support genome annotation, the same adult female and male sterlets (from the broodstock of the Leibniz-Institute of Freshwater Ecology and Inland Fisheries) as used for the whole-genome sequencing were sampled. RNAs were obtained from six adult male (brain, testes, muscle, spleen, liver and skin) and three adult female (ovary, liver and brain) tissues. In addition, mixed RNAs (brain, heart, eyes and spleen) of one juvenile male (20 cm) were sequenced. RNA-Seq reads were used as transcriptomic
evidence for genome annotation and sex-biased expression analysis. Custom sequencing (BGI) of TruSeq libraries generated 25–30 million 100-bp paired-end reads for each sample on the Illumina Hiseq4000 platform.
For differential gene expression analysis, reads were aligned to the sterlet
genome using STAR (–quantMode GeneCounts)152.
Owing to the sequence similarity between ohnologues, the mapping results were further filtered for uniquely mapped reads and reads with no mismatches to be able to obtain a reliable read assignment. To compare expression between different genes from an ohnologue pair, we used transcripts per million
(TPM) values. For further analyses, genes not expressed (TPM < 5) in both
ohnologues and in all included organs or ohnologue pairs without sufficient discriminating single nucleotide polymorphisms were excluded. Ohnologues were considered to be expressed at different levels if the absolute value
(ohnologue1(log2TPM + 1) − ohnologue2(log2TPM + 1)) was greater than one
(representing a twofold difference) in at least two different sterlet organs and developmental stages. For functional clustering, the web tool DAVID (https:// david.ncifcrf.gov/) was used, on the basis of human orthologues and all ohnologues as background.
RAD-tag sequencing and analysis of sex-specific tags. The genomic DNA of 31 females and 30 males was extracted from 90% ethanol-preserved fin clips using a classical phenol/chloroform protocol. The sterlet RAD-tag library was
built according to standard protocols153, using Sbf1 as a single restriction enzyme,
and sequenced on a single lane of Hiseq 2500, using the v4 SR100nt mode. The resulting read file was then demultiplexed using the process-radtags.pl script of
STACKS software v.1.44 (ref. 154) with default settings.
Demultiplexed reads were analysed with RADSex v.0.2.0155. RADSex sorts reads
from the demultiplexed dataset into groups sharing the exact same sequence, and reads that would belong to the same polymorphic locus using standard analysis software are simply split into multiple markers. As a result, RADSex markers are non-polymorphic, thus allowing straightforward presence–absence comparison between individuals.
First, a table of depth for each RADSex marker in each individual from the dataset was generated using radsex process with default settings. The distribution of markers in males and females was then computed with radsex distrib, using a minimum depth of 10 (--min-cov 10) to consider a marker present in an individual, and a tile plot was generated from this distribution using the plot_ sex_distribution() function from RADSex-vis (https://github.com/RomainFeron/ RADSex-vis). The same analysis was performed with minimum depths of 1, 2 and 5, but the results were not qualitatively affected. A total of 176,735 markers were obtained that were present in at least one individual with a minimum depth of 10. Reporting Summary. Further information on research design is available in the Nature Research Reporting Summary linked to this article.
Data availability
The Acipenser ruthenus Whole Genome Shotgun project has been deposited at DDBJ/ENA/GenBank under the accession number VTUV00000000. The version described in this paper is version VTUV01000000. Genomic and transcriptomic reads are deposited in the Sequence Read Archive under accession numbers SRR10188515-10188518 and SRR11013451-11013458.
Code availability
The in-house scripts have been deposited in Github (https://github.com/ dukecomeback/sterlet_Msch).
Received: 19 August 2019; Accepted: 27 February 2020;
Published online: 30 March 2020
References
1. Van de Peer, Y., Maere, S. & Meyer, A. The evolutionary significance of ancient genome duplications. Nat. Rev. Genet. 10, 725–732 (2009). 2. Lynch, M. & Conery, J. S. The evolutionary fate and consequences of
duplicate genes. Science 290, 1151–1155 (2000).
3. Dehal, P. & Boore, J. L. Two rounds of whole genome duplication in the ancestral vertebrate. PLoS Biol. 3, e314 (2005).
4. Meyer, A. & Van de Peer, Y. From 2R to 3R: evidence for a fish‐specific genome duplication (FSGD). Bioessays 27, 937–945 (2005).
5. Braasch, I. & Postlethwait, J. H. in Polyploidy and Genome Evolution (eds Soltis P. & Soltis, D.) 341–383 (Springer, 2012).
6. Symonová, R. et al. Molecular cytogenetic differentiation of paralogs of Hox paralogs in duplicated and re-diploidized genome of the North American paddlefish (Polyodon spathula). BMC Genet. 18, 19 (2017).
7. Havelka, M., Hulák, M., Bailie, D., Prodöhl, P. & Flajšhans, M. Extensive genome duplications in sturgeons: new evidence from microsatellite data. J. Appl. Ichthyol. 29, 704–708 (2013).
8. Otto, S. P. The evolutionary consequences of polyploidy. Cell 131, 452–462 (2007).
9. Force, A. et al. Preservation of duplicate genes by complementary, degenerative mutations. Genetics 151, 1531–1545 (1999).
10. Ludwig, A., Belfiore, N. M., Pitra, C., Svirsky, V. & Jenneckens, I. Genome duplication events and functional reduction of ploidy levels in sturgeon (Acipenser, Huso and Scaphirhynchus). Genetics 158, 1203–1215 (2001). 11. Wolfe, K. H. Yesterday’s polyploids and the mystery of diploidization.
Nat. Rev. Genet. 2, 333–341 (2001).
12. Rajkov, J., Shao, Z. & Berrebi, P. Evolution of polyploidy and functional diploidization in sturgeons: microsatellite analysis in 10 sturgeon species. J. Heredity 105, 521–531 (2014).
13. Crow, K. D., Smith, C. D., Cheng, J.-F., Wagner, G. P. & Amemiya, C. T. An independent genome duplication inferred from Hox paralogs in the American paddlefish—a representative basal ray-finned fish and important comparative reference. Genome Biol. Evol. 4, 937–953 (2012).
14. Miller, M. J. in Sturgeons and Paddlefish of North America. Fish & Fisheries Series Vol. 27 (eds LeBreton, G. T. O., Beamish, F. W. H. & McKinley, R. S.) 87–101 (Springer, 2004).
15. Saito, T. et al. The origin and migration of primordial germ cells in sturgeons. PLoS ONE 9, e86861 (2014).
16. Hochleithner, M. & Gessner, J. The Sturgeon and Paddlefishes of the World—Biology and Aquaculture Aquatech Publication 106 (Aquatech, 2001).
17. Allen, P. J., Cech, J. J. & Kültz, D. Mechanisms of seawater acclimation in a primitive, anadromous fish, the green sturgeon. J. Comp. Physiol. B 179, 903–920 (2009).
18. Haidvogl, G. et al. Typology of historical sources and the reconstruction of long‐term historical changes of riverine fish: a case study of the Austrian Danube and northern Russian rivers. Ecol. Freshw. Fish 23, 498–515 (2014). 19. Saffron, I. Caviar: The Strange History and Uncertain Future of the World’s
Most Coveted Delicacy (Broadway Books, 2002).
20. Cheng, P. et al. Draft genome and complete Hox-cluster characterization of the sterlet sturgeon (Acipenser ruthenus). Front. Genet. 10, 776 (2019). 21. Bytyutskyy, D., Srp, J. & Flajšhans, M. Use of Feulgen image analysis
densitometry to study the effect of genome size on nuclear size in polyploid sturgeons. J. Appl. Ichthyol. 28, 704–708 (2012).
22. Fontana, F. et al. Fluorescent in situ hybridization with rDNA probes on chromosomes of Acipenser ruthenus and Acipenser naccarii (Osteichthyes Acipenseriformes). Genome 42, 1008–1012 (1999).
23. Valente, G. T. et al. B chromosomes: from cytogenetics to systems biology. Chromosoma 126, 73–81 (2017).
24. Du, K. et al. The genome of the arapaima (Arapaima gigas) provides insights into gigantism, fast growth and chromosomal sex determination system. Sci. Rep. 9, 5293 (2019).
25. Betancur-R, R. et al. Phylogenetic classification of bony fishes. BMC Evol. Biol. 17, 162 (2017).
26. Betancur-R, R. et al. The tree of life and a new classification of bony fishes. PLoS Curr. 5 http://doi.org/dpxx (2013).
27. Near, T. J. et al. Resolution of ray-finned fish phylogeny and timing of diversification. Proc. Natl Acad. Sci. USA 109, 13698–13703 (2012). 28. Hughes, L. C. et al. Comprehensive phylogeny of ray-finned fishes
(Actinopterygii) based on transcriptomic and genomic data. Proc. Natl Acad. Sci. USA 115, 6249–6254 (2018).
29. Rabosky, D. L. et al. Rates of speciation and morphological evolution are correlated across the largest vertebrate radiation. Nat. Commun. 4, 1958 (2013).
30. Darwin, C. On the Origin of Species by Means of Natural Selection, or the Preservation of Favoured Races in the Struggle for Life (Oxford Univ. Press, 1859).
31. Krieger, J. & Fuerst, P. A. Evidence for a slowed rate of molecular evolution in the order Acipenseriformes. Mol. Biol. Evol. 19, 891–897 (2002). 32. Chalopin, D., Naville, M., Plard, F., Galiana, D. & Volff, J.-N. Comparative
analysis of transposable elements highlights mobilome diversity and evolution in vertebrates. Genome Biol. Evol. 7, 567–580 (2015).
33. Amemiya, C. T. et al. The African coelacanth genome provides insights into tetrapod evolution. Nature 496, 311–316 (2013).
34. Berthelot, C. et al. The rainbow trout genome provides novel insights into evolution after whole-genome duplication in vertebrates. Nat. Commun. 5, 3657 (2014).
35. Lien, S. et al. The Atlantic salmon genome provides insights into rediploidization. Nature 533, 200–205 (2016).
36. Chen, Z. et al. De novo assembly of the goldfish (Carassius auratus) genome and the evolution of genes after whole-genome duplication. Sci. Adv. 5, eaav0547 (2019).
37. Andreyushkova, D. et al. Next generation sequencing of chromosome-specific libraries sheds light on genome evolution in paleotetraploid sterlet (Acipenser ruthenus). Genes 8, 318 (2017).
38. Romanenko, S. A. et al. Segmental paleotetraploidy revealed in sterlet (Acipenser ruthenus) genome by chromosome painting. Mol. Cytogenet. 8, 90 (2015).