HAL Id: hal-02159114
https://hal.archives-ouvertes.fr/hal-02159114
Submitted on 19 Jun 2019
HAL is a multi-disciplinary open access
archive for the deposit and dissemination of
sci-entific research documents, whether they are
pub-lished or not. The documents may come from
teaching and research institutions in France or
abroad, or from public or private research centers.
L’archive ouverte pluridisciplinaire HAL, est
destinée au dépôt et à la diffusion de documents
scientifiques de niveau recherche, publiés ou non,
émanant des établissements d’enseignement et de
recherche français ou étrangers, des laboratoires
publics ou privés.
charge-density-wave order in HgBa2CuO4+δ
Wojciech Tabis, B. Yu, I. Bialo, M. Bluschke, T. Kolodziej, A. Kozlowski, E.
Blackburn, K. Sen, M. Forgan, M. Zimmermann, et al.
To cite this version:
Wojciech Tabis, B. Yu, I. Bialo, M. Bluschke, T. Kolodziej, et al.. Synchrotron x-ray scattering
study of charge-density-wave order in HgBa2CuO4+δ. Physical Review B: Condensed Matter and
Materials Physics (1998-2015), American Physical Society, 2017, 96 (13), pp.134510.
�10.1103/Phys-RevB.96.134510�. �hal-02159114�
published as:
Synchrotron x-ray scattering study of charge-density-wave
order in HgBa_{2}CuO_{4+δ}
W. Tabis, B. Yu, I. Bialo, M. Bluschke, T. Kolodziej, A. Kozlowski, E. Blackburn, K. Sen, E. M.
Forgan, M. v. Zimmermann, Y. Tang, E. Weschke, B. Vignolle, M. Hepting, H. Gretarsson, R.
Sutarto, F. He, M. Le Tacon, N. Barišić, G. Yu, and M. Greven
Phys. Rev. B 96, 134510 — Published 10 October 2017
W. Tabis,1, 2, 3, ∗B. Yu,1 I. Bialo,2 M. Bluschke,4, 5 T. Kolodziej,2, 6 A. Kozlowski,2 E. Blackburn,7 K. Sen,8 E. M. Forgan,7 M. v. Zimmermann,9 Y. Tang,1 E. Weschke,4 B. Vignolle,3 M. Hepting,5
H. Gretarsson,5 R. Sutarto,10 F. He,10 M. Le Tacon,8 N. Bariˇsi´c,1, 11 G. Yu,1 and M. Greven1, †
1
School of Physics and Astronomy, University of Minnesota, Minneapolis, Minnesota 55455, USA
2
AGH University of Science and Technology, Faculty of Physics and Applied Computer Science, 30-059 Krakow, Poland
3Laboratoire National des Champs Magnetiques Intenses (CNRS, INSA, UJF, UPS), 31400 Toulouse, France 4
Helmholtz-Zentrum Berlin fur Materialien und Energie, D-12489 Berlin, Germany
5
Max Planck Institute for Solid State Research, D-70569 Stuttgart, Germany
6Advanced Photon Source, Argonne National Laboratory, Lemont, IL 60439, USA 7
School of Physics and Astronomy, University of Birmingham, Birmingham, B15 2TT, UK
8
Institut f¨ur Festk¨orperphysik, Karlsruher Institut f¨ur Technologie, 76021 Karlsruhe, Germany
9Hamburger Synchrotronstrahlungslabor (HASYLAB) at Deutsches Elektronen-Synchrotron (DESY), 22603 Hamburg, Germany 10
Canadian Light Source, Saskatoon, Saskatchewan S7N 2V3, Canada
11
Institute of Solid State Physics, TU Wien, 1040 Vienna, Austria (Dated: September 22, 2017)
We present a detailed synchrotron X-ray scattering study of the charge-density-wave (CDW) order in simple tetragonal HgBa2CuO4+δ(Hg1201). Resonant soft X-ray scattering measurements reveal
that short-range order appears at a temperature that is distinctly lower than the pseudogap tem-perature and in excellent agreement with a prior transient reflectivity result. Despite considerable structural differences between Hg1201 and YBa2Cu3O6+δ, the CDW correlations exhibit similar
doping dependences, and we demonstrate a universal relationship between the CDW wave vector and the size of the reconstructed Fermi pocket observed in quantum oscillation experiments. The CDW correlations in Hg1201 vanish already below optimal doping, once the correlation length is comparable to the CDW modulation period, and they appear to be limited by the disorder potential from unit cells hosting two interstitial oxygen atoms. A complementary hard X-ray diffraction mea-surement, performed on an underdoped Hg1201 sample in magnetic fields along the crystallographic c-axis of up to 16 Tesla, provides information about the form factor of the CDW order. As expected from the single-CuO2-layer structure of Hg1201, the CDW correlations vanish at half-integer values
of L and appear to be peaked at integer L. We conclude that the atomic displacements associated with the short-range CDW order are mainly planar, within the CuO2layers.
PACS numbers: 61.05.C, 74.25.Dw, 74.72.Jt, 74.62.Dh
I. INTRODUCTION
The discovery of superconductivity in the lamel-lar cuprates three decades ago triggered a tremendous amount of scientific activity, yet it has been a challenge to understand the strange-metal (SM) and pseudogap (PG) states from which the superconducting (SC) state evolves upon cooling (Fig. 1).1 The extreme cases of zero and
high hole-dopant concentrations are well understood: the undoped parent compounds are antiferromagnetic (AF) Mott insulators, whereas the highly-doped materials ex-hibit the characteristics of a conventional Fermi-liquid (FL) metal with a large Fermi surface (FS). The PG phenomenon is associated with myriad ordering tenden-cies, e.g., intra-unit-cell (q = 0) magnetism that preserves the translational symmetry of the crystal lattice2,3 and a significant enhancement of dynamic, short-range AF correlations.4,5 Evidence for charge order (in the form of
charge-spin “stripes”) was first reported for the La-based cuprates.6 Subsequent STM,7,8 NMR9 and X-ray
scat-tering work10,11 found that charge-density-wave (CDW) correlations are a universal characteristic of the under-doped cuprates.
Among the central goals in current cuprate research is
to firmly establish the universality and hierarchy of or-dering tendencies in the PG state and to shed light on the connection between CDW and SC order. A second goal is to achieve a consistent understanding of CDW-related phenomena observed with distinct probes. A third goal is to establish the connection between CDW order and charge transport. The CDW correlations develop in the part of the phase diagram where normal-state FL be-havior has been observed.12–15 Moreover, CDW
correla-tions are thought to be responsible for the FS reconstruc-tion implied by low-temperature transport experiments in high magnetic fields.16–21Finally, it is essential to
un-derstand the role of disorder, which might both stabilize otherwise fluctuating CDW order and limit the spatial extent of CDW domains.22
Here we tackle these questions through a systematic Cu L−edge resonant X-ray scattering (RXS) and non-resonant hard X-ray diffraction (XRD) study of the dop-ing and temperature dependence of the CDW correla-tions in HgBa2CuO4+δ (Hg1201). Hg1201 is ideal for
experimental study due to its simple tetragonal crys-tal structure, with only one CuO2 layer per primitive
cell, no intervening CuO chains, and an optimal Tc of
com-pounds. All cuprates exhibit inherent inhomogeneity and disorder,23,24 and Hg1201 is no exception in this
regard.25,26 In particular, the interstitial oxygen atoms
are likely randomly distributed in the HgOδ layer (δ ≈
0.18 at optimal doping),27–29yet the quasiparticle
mean-free path and the screening of the Coulomb repulsion have been estimated to be rather large, which may con-tribute to the high Tc of Hg1201.30This is supported by
the observation of a tiny residual resistivity,12,40 of
field-cooled/zero-field-cooled magnetic susceptibility ratios of nearly 100%,40 of Shubnikov-de-Haas oscillations,20,21 and of Kohler scaling of the magnetoresistance in the PG state.14Samples of comparable quality than those
inves-tigated in the present work have enabled state-of-the-art electronic Raman scattering, optical spectroscopy, and hard X-ray experiments.13,31–39 Such Hg1201
sam-ples feature a small density of vortex pinning centers,40 which has enabled the observation of a magnetic vortex lattice.41
This paper is organized as follows: In Section II, we provide sample information and further describe the ex-perimental techniques. In Section III, we present the experimental results, which then are further discussed in Section IV. The conclusions follow in Section V. Addi-tional information on the calculations and simulations presented in this article are detailed in Appendix A, B and C.
II. EXPERIMENTAL METHODS
A. Samples
Hg1201 single crystals were grown by a previously re-ported flux method,46 subsequently annealed to achieve
the desired oxygen (and hence hole) concentration,40and then quenched to room temperature. The superconduct-ing transition was determined from magnetic suscepti-bility measurements (magnetic field strength 5 Oe), and the critical temperature Tc was defined as the onset of
the diamagnetic response. The hole concentration was estimated from the Tc vs. p relationship established for
polycrystalline samples in ref.43 Sample information is
summarized in Table I. The typical sample dimensions were 2 x 2 x 0.5 mm3, with the short side along the
crystallographic c axis. The X-ray penetration length in Hg1201 is about 0.2 µm at the energy used in the soft X-ray experiment (~ω ≈ 932 eV). In order to ensure flat and clean surfaces, the samples were polished multi-ple times with sandpaper with increasingly finer grade, ranging from 1 µm to 0.05 µm. The X-ray diffraction measurements at 80 keV were performed in transmission geometry and thus no particular surface preparation was required.
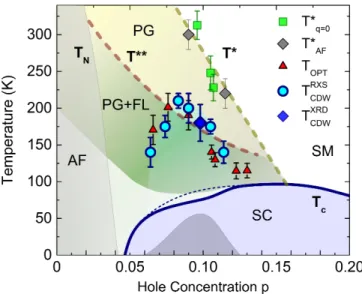
FIG. 1. (color online) Phase diagram of Hg1201
(p > 0.04), extended to p = 0 based on data for YBa2Cu3O6+δ (YBCO).12,42 Solid blue line: doping
depen-dence of the superconducting (SC) transition temperature Tc(p).43 Dark-grey region: deviation (not to scale) of Tc
from estimated parabolic doping dependence (dashed blue line). T *: pseudogap (PG) temperature, estimated from deviation of T -linear planar resistivity in the strange-metal (SM) state.12,15 T **: temperature below which Fermi-liquid
(FL) behavior is observed in the PG state.12–15 Tq=0 and
TAF: characteristic temperatures below which q = 0
mag-netic order3,44and an enhancement of antiferromagnetic (AF)
fluctuations4,5 are observed. TCDW: estimated from RXS
(blue circles) and XRD (blue diamond) onset of short-range CDW order (p = 0.09 result from ref.45). T
opt:
characteris-tic temperature observed in time-resolved opcharacteris-tical reflectivity measurements.38
B. Resonant X-ray scattering
Resonant X-ray scattering (RXS) measurements at the Cu L3 edge were performed at the UE46 beam
line of the BESSY-II synchrotron in Berlin, Germany, and at the REIXS beam line47 of the Canadian Light
Source. In order to determine the exact resonance en-ergy, X-ray absorption measurements were performed in total-fluorescence-yield configuration. The incident X-ray beam was then tuned to the maximum of the flu-orescence signal for each individual sample (~ω ≈ 932 eV). Since the structure of Hg1201 contains only one Cu site per formula unit, a fluorescence spectrum dis-plays a single maximum.45 Momentum scans were
per-formed by rotating the sample about the axis perpendic-ular to the scattering plane, and the detector angle was set to 2θ = 160◦. We quote the scattering wave-vector Q = Ha∗+ Kb∗+ Lc∗= (H, K, L) in reciprocal lattice units, where a∗= b∗ = 1.62 ˚A−1 and c∗ = 0.66 ˚A−1 are
the approximate room-temperature values. In the config-uration used in the experiment, K was set to zero, and H was coupled to L during the scans. The maximum of the
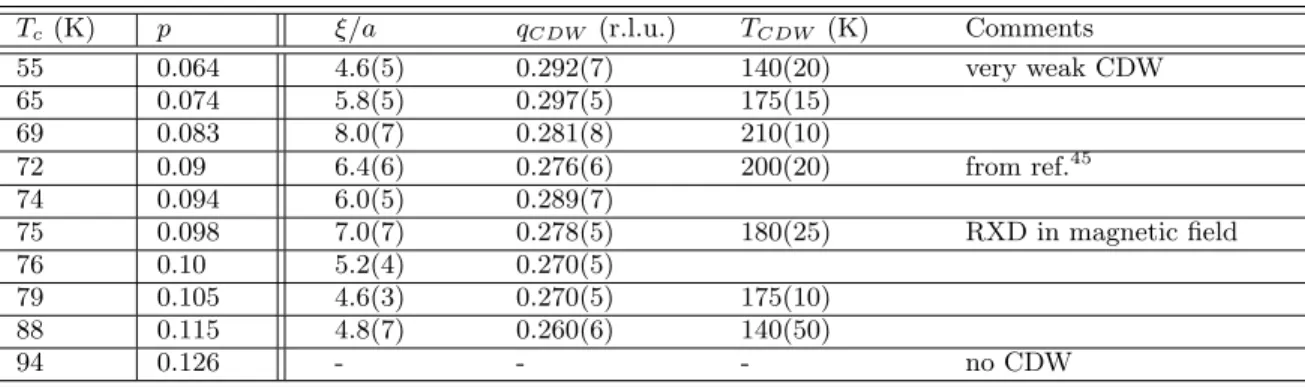
Tc (K) p ξ/a qCDW (r.l.u.) TCDW (K) Comments 55 0.064 4.6(5) 0.292(7) 140(20) very weak CDW 65 0.074 5.8(5) 0.297(5) 175(15) 69 0.083 8.0(7) 0.281(8) 210(10) 72 0.09 6.4(6) 0.276(6) 200(20) from ref.45 74 0.094 6.0(5) 0.289(7) 75 0.098 7.0(7) 0.278(5) 180(25) RXD in magnetic field 76 0.10 5.2(4) 0.270(5) 79 0.105 4.6(3) 0.270(5) 175(10) 88 0.115 4.8(7) 0.260(6) 140(50) 94 0.126 - - - no CDW
TABLE I. Hg1201 sample information. The superconducting critical temperature was determined from the onset of the diamagnetic response in magnetic susceptibility measurements. The hole concentration was estimated from the Tc vs. p
relationship established in ref.43The CDW correlation length ξ/a = (1/(π · FWHM)), was determined near Tc, from the
full-width-at-half-maximum (FWHM) of Gaussian fits to the data, as described in the text. Similarly, the wave vector was obtained from the center of the peak. TCDW was estimated as described in the text.
CDW peak was observed at doping dependent H values (also denoted as qCDW) in the approximate range 0.26
to 0.29 r.l.u., near the largest experimentally accessible value of L ≈ 1.25 r.l.u. Due to the large X-ray wave-length at the Cu L-edge, only the first Brillouin zone was accessible, and hence Q is equivalent to the reduced wave vector. We denote the reduced two-dimensional wave vector as q; CDW peaks are observed at the equiv-alent positions q = (qCDW, 0) and (0, qCDW).
C. Hard X-ray Diffraction
Hard X-ray diffraction (XRD) measurements were car-ried out in transmission geometry on a Tc= 75 K sample
using the 80 keV synchrotron radiation at the P07 beam-line of the Petra III storage ring at DESY, Hamburg, Ger-many. The 17-Tesla horizontal cryomagnet provided by the University of Birmingham was installed on the triple-axis diffractometer.48 Following prior work on YBCO,11
the magnetic field was used to enhance the CDW cor-relations and thus increase the sensitivity of the exper-iment at low temperatures. In order to achieve good mechanical stability and thermalization, the sample was mounted to a silicon wafer, then glued to a temperature-controlled aluminum plate within the cryomagnet vac-uum, and thermally shielded by aluminized mylar foils glued to this plate. The sample temperature was con-trolled in the range 2−300 K. The incident and scattered X-rays passed through the kapton cryostat vacuum win-dows, which gave a maximum of ±10◦ input and output angles relative to the field direction. The high energy of the X-rays allowed us to access a significantly larger portion of the reciprocal space compared to the RXS ex-periment. In the XRD experiment, H-scans centered at the CDW peak position qCDW were performed across
many Brillouin zones; the accessible values of H (in the range of ∼ 1 − 8) were dependent on the L values. The XRD experiment was performed in an applied magnetic field of 16 T, and the field component along the
crystal-lographic c-axis (i.e., perpendicular to the CuO2 planes)
was dependent on Q. For larger Q values (L > 2), the angle between the c-axis of the crystal and the magnetic field direction was about 30◦, which resulted in a max-imum c-axis field of approximately 14 T. The magnetic field was applied at a temperature above Tc, and the
sample was then field-cooled to base temperature. As a function of the magnetic field, minor changes in the position and angle of the sample holder were observed; these were corrected with horizontal and vertical motion stages situated under the cryostat rotation stage, and by realigning the sample on the (0 2 0) Bragg peak. Due to time constraints, no measurements of the CDW peak were performed in zero applied field.
III. RESULTS
A. Doping dependence of the CDW order
Building on prior work for p ≈ 0.09 (Tc ≈ 72 K),45
we studied crystals at eight doping levels in the range 0.064 ≤ p ≤ 0.126 (Tc ≈ 55 - 94 K) via RXS. In
addi-tion, we measured one crystal via XRD at a doping level (p ≈ 0.098, Tc ≈ 75 K) at which the charge correlations
are relatively strong. The onset temperature of the CDW order, TCDW, was determined for a subset of these
sam-ples (Fig. 1, Table I). As demonstrated in Figs. 2 - 5, a CDW signal was observed at all doping levels, except for the most highly doped sample with Tc≈ 94 K (Fig. 3(b)).
As demonstrated in Fig. 3(c), the CDW order is observed at equivalent wave vectors (magnitude qCDW) along [100]
and [010], as expected, given the tetragonal structure of Hg1201.
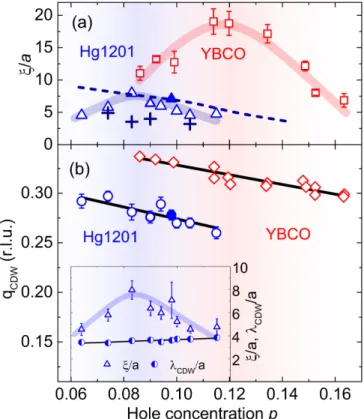
Figure 6 compares the CDW correlation length ξ and peak position qCDW for Hg1201 (obtained from
Gaus-sian fits; Figs. 2, 5 and Ref.45) with results for YBCO.49
The “SC domes” Tc(p) of Hg1201 and YBCO differ
somewhat,3,43 and p should be viewed as an effective parameter,50,51 yet in both cases the maximum
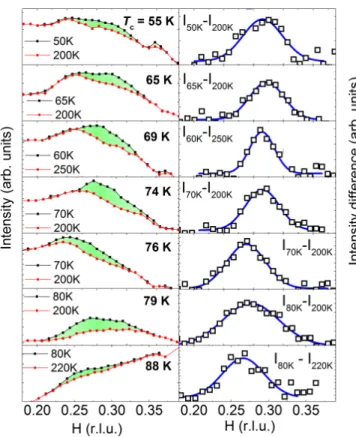
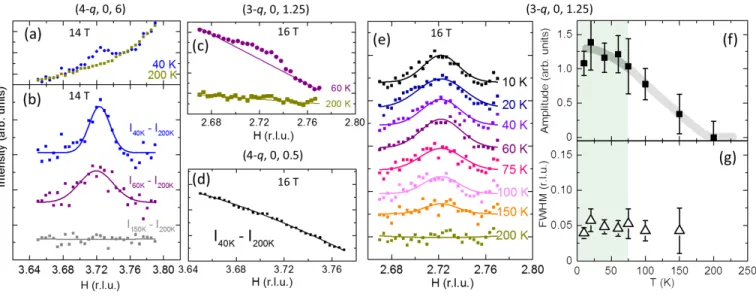
correla-FIG. 2. (color online) Momentum dependence of the CDW peak observed via RXS in seven underdoped samples along [100]. Left: raw spectra collected at indicated temperatures. Right: intensity difference of data in left panels. The high-temperature data constitute an estimate of the background scattering. Although the location of the CDW peak is not clear from the raw data, the background-subtracted scans clearly reveal CDW peaks. Blue lines: Gaussian fits to the data.
tion length (ξmax) corresponds to the center of the Tc(p)
plateau, where TCDW and the deviation from the
interpo-lated parabolic Tc(p) dependence are the largest (Fig. 1).
The suppression of Tc appears to be material specific
and stronger in YBCO than in Hg1201.43,52 Whereas for Hg1201 the intensity of the CDW peak saturates in the SC state (Figs. 4, 5(f) and Ref.45), for YBCO it
de-creases below Tc (in the absence of an applied magnetic
field).49 For Hg1201, ξ
max/a ≈ 8, which is about 40%
of ξmax/a ≈ 20 for YBCO.49Although qCDW is smaller
than for YBCO, the respective rates of decrease with doping, −0.6 ± 0.1 and −0.49 ± 0.05 r.l.u./[holes/planar Cu], are the same within error (Fig. 6(b)). The different magnitudes reflect differences in the FS shapes of the two compounds.
RXS is sensitive to the modification of the Cu 3d (va-lence) electronic states on nominally equivalent resonat-ing ions. Whereas this technique is very sensitive to small CDW amplitudes, only a fraction of the first Brillouin zone can be reached due to the large wavelength of the X-rays. As a result, RXS only allows the determination of the in-plane component of the CDW wave vector, i.e.,
FIG. 3. (color online) Momentum scans across the CDW wave vector at the Cu L3 resonance at various temperatures for
two Hg1201 samples with (a) Tc = 55 K (p = 0.064) and
(b) Tc = 94 K (p = 0.126). Due to the very low intensity
of the CDW peak in the first sample, systematic subtraction of high-temperature “background” from the low-temperature scans did not result in a reliable estimate of the temperature dependence. Instead, the onset temperature of the CDW or-der was determined from the temperature dependence of the integrated intensity (between H = 0.2 and 0.35 r.l.u.) after introducing an offset to match the background level at 200 K; the result is shown in the inset of (a). The onset temperature TCDW= 140(20) K is the temperature at which the integrated
intensity saturates. No intensity change with temperature is observed in the nearly optimally-doped sample (Tc = 94 K),
consistent with the absence of CDW order. (c) Background-subtracted momentum scan across qCDW for a sample with
Tc = 76 K (p = 0.105) along the equivalent directions [100]
and [010]. The solid lines are Gaussian fits (with linear back-ground) to the data, yielding equivalent peak positions, am-plitudes and widths, within the experimental uncertainty.
the component parallel to the CuO2planes. On the other
hand, (hard) XRD is sensitive to the entire charge cloud residing on an ion, and probes atomic displacements asso-ciated with the charge order. The relatively short wave-length of hard X-rays permits access to a large volume of reciprocal space. As shown in Figs. 5 and 6, the in-plane component of the CDW peak determined from XRD is consistent with the RXS results. The XRD measurement revealed a broad CDW signal along [001] that vanishes at half-integer L values (Fig. 5(d)) and appears to be strongest at the integer values of L (Fig. 5(a-b)).
B. Temperature dependence of the CDW order
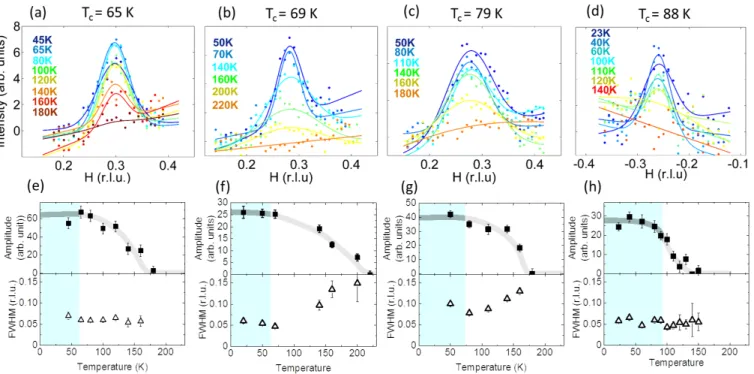
Figure 4 displays the temperature dependence of the CDW peak for four of our samples (Tc = 65 K, 69 K,
79 K, and 88 K) measured via RXS. The correspond-ing temperature dependence for the Tc = 75 K sample
studied by XRD is shown in Fig. 5(e-f). Measurements were typically carried out at temperatures that ranged from 12 K to 250-300 K. The intensity variation was carefully analyzed in order to estimate the onset
tem-FIG. 4. (color online) (a-d) Temperature dependence of the background-subtracted CDW peak for four Hg1201 samples observed by RXS. The peak intensity decreases above Tc and saturates at the characteristic doping-dependent temperature
TCDW. In order to obtain the most accurate temperature dependence of the CDW peak parameters, high-temperature data
were subtracted from the low-temperature scans (i.e., data at 200 K, 240 K, 200 K and 155 K were selected as reference background for the samples with Tc= 65 K, 69 K, 79 K and 88 K, respectively). The solid lines are the result of subsequent
Gaussian-function fits. (e-h) Temperature dependence of the peak amplitude and width (FWHM). Blue areas indicate the superconducting state for each sample. The thick gray lines are guides to the eye.
perature TCDW. For the RXS results, high-temperature
data were used as reference “background” and subtracted from each low-temperature scan. We checked that the intensity at qCDW does not vary further at higher
tem-peratures. For the sample with the lowest doping level (Tc= 55 K), the CDW signal was too small to allow this
analysis. Instead, as shown in Fig. 3(a), the intensity in the range H = 0.2 − 0.35 r.l.u. was integrated at each temperature and the temperature at which the integrated intensity saturates upon heating was identified as TCDW.
Figure 3(b) demonstrates that no intensity variation was observed in the nearly optimally-doped sample (Tc = 94
K). In order to obtain the temperature dependence in the XRD measurement, a linear background was subtracted from the scans, as shown in Fig. 5(c). The background-subtracted peaks were fit to a Gaussian function (Fig. 5(e)), and the amplitude and FWHM was extracted. In overall agreement with the previous result for Tc = 72 K
in ref.45, the intensity around q
CDW increases smoothly
below TCDW and saturates below Tc.
IV. DISCUSSION
There remain numerous open questions regarding the hierarchy of ordering tendencies in the PG state, the
cor-relation between CDW signatures observed with different probes, the connection among CDW order, SC order and charge transport, the connection between the real-space charge modulations and the FS topology, and the role of disorder. The short-range CDW order appears well below TAF (TAF ≈ T∗), the temperature below which a distinct
enhancement of AF fluctuations is observed,4,5consistent
with theoretical proposals that AF correlations drive the charge correlations53–58 and with the notion15,45,60 that
the PG and CDW formation are distinct phenomena. In Hg1201, the CDW correlations appear at or below T∗∗, the temperature below which FL charge transport is observed12–14 and below which the Hall constant is
nearly independent of temperature, and thus the PG and associated FS is likely fully formed;15only at the doping
level where CDW order is most robust do TCDW and
T∗∗ coincide. On the other hand, TCDW coincides at
all doping levels with TOP T, the characteristic
temper-ature from transient reflectivity measurements,38 which
suggests that both probes detect the same correlations. As seen in Fig. 6, at p ≈ 0.115, ξ becomes comparable to the CDW modulation period (this is also the case close to TCDW). Thus, the CDW loses spatial coherence
al-ready below optimal doping. Interestingly, a qualitative change in the behavior of the quasiparticle recombina-tion rate (τqp) was observed at about the same doping
FIG. 5. (color online) CDW peak in a Hg1201 sample, with p = 0.098 (Tc = 75 K), observed via 80 keV XRD in various
Brillouin zones, in an effective 14 T or 16 T c−axis magnetic field, as indicated. The high energy of the hard X-rays allowed access a large portion of momentum space. The corresponding Brillouin zone is marked above each panel. (a) Momentum scans across the CDW wave vector at 40 K and 200 K. (b) Intensity difference of the scans collected at the indicated temperatures. The solid lines are the result of subsequent fits to a Gaussian function. (c) Two representative momentum scans across the CDW wave vector at 60 K and 200 K. The solid lines represent the estimated linear background. (d) Corresponding intensity difference of the 40 K and 200 K data. These temperatures lie well below and above TCDW, respectively. No clear evidence of
CDW intensity is seen at half-integer L. (e) Linear-background-subtracted data at the indicated temperatures. The solid lines are the results of fits to a Gaussian function. (f-g) Temperature dependence of the CDW peak amplitude and width (FWHM) from the fit in (e). Green area indicates the temperature region of the superconducting state, in the absence of the magnetic field. Thick gray line in (f) is a guide to the eye. The data in (a-c) and (e) are offset for clarity.
level:38 whereas the behavior of τ
qp near optimal doping
(where TOP T is not much larger than Tc) was found to
be consistent with the mean-field BCS theory of super-conductivity, the data at lower doping are best under-stood upon considering composite SC and CDW fluctua-tions near Tc. We note that CDW order was reported for
optimally-doped (p ≈ 0.16) Hg1201,61 yet the very high
onset temperature and the values for ξ and qCDW are
inconsistent with those extrapolated to optimal doping based on our study (see also Appendix A).
A. CDW order and the FS reconstruction in the cuprates
Transport measurements have demonstrated the ex-istence of a single quantum oscillation (QO) frequency in Hg1201, and hence of a single electron pocket at the Fermi level.20,21 This is in stark contrast to
orthorhom-bic double-layer YBCO which, in addition to the main oscillation frequency at ∼ 550 T, features satellites at ± 100 T62due to magnetic breakdown between the
com-plex electron pockets that originate from a coupling be-tween adjacent CuO2 layers,63 and additionally a slow
frequency (∼ 100 T), possibly due to small hole-like FS pockets.64Hg1201 thus is a pivotal system to seek a con-nection between CDW order and FS topology. In ref.45,
it was demonstrated for Hg1201 (p ≈ 0.09) that folding the underlying FS with the measured qCDW, and with
assumed biaxial CDW order, results in a small electron pocket whose size agrees with the QO frequency observed at the same doping level20,21. Similar agreement was also
found for YBCO, but considering only the bonding FS and main QO frequency. Our new result for the dop-ing dependence of qCDW in Hg1201, in combination with
a tight-binding FS calculation, allows us to simulate the doping dependence of the electron pocket and to compare with the QO data.20,21
Figure 7(a) shows the tight-binding FS of Hg1201. The electron pockets were obtained by solving a Hamilto-nian linking the tight-binding FS, consistent with pho-toemission spectroscopy measurements,65with the CDW
wavevector values qCDW estimated from Fig. 6(b). Due
to the PG in the antinodal regions, no additional hole-pockets are expected in the reconstructed state, con-sistent with experiment.20,21 The resultant relationship
between electron pocket size (or, equivalently, QO fre-quency) and qCDW (and p) is shown in Fig. 7(b) (see
Appendix B for details). The high-precision QO data are in very good agreement with this prediction.21
Our experiments for tetragonal Hg1201 were con-ducted either in the absence of an applied magnetic field (RXS), or in relatively low magnetic fields
com-FIG. 6. (color online) (a) CDW correlation length (in units of the planar lattice parameter a) near Tcfor Hg1201. Open and
filled blue triangles indicate RXS and XRD (at 14 T) results, respectively; the p ≈ 0.09 result is from ref.45. For compari-son, the data for YBCO from ref.49are shown as red squares.
For Hg1201, ξ/a estimated about 20 K below TCDW is shown
as well (blue crosses). Blue dashed line: simulated character-istic size of CDW domains, as discussed in the text. (b) qCDW
for Hg1201 (blue circles) and YBCO (red diamonds). Black lines are linear fits (see text). Inset compares the correlation length of the CDW order in Hg1201 with the corresponding wavelength λCDW, expressed in lattice units. The red and
blue bands for ξ(p)/a are guides to the eye.
pared to the upper critical field (XRD), and the data do not allow us to discern whether the short-range CDW order is unidirectional66 or bidirectional67.
Neverthe-less, the discussed FS reconstruction scenario points to a bidirectional character. X-ray scattering work revealed that orthorhombic YBCO (Tc = 67 K)
ex-hibits three-dimensional long-range CDW order in fields above about 18 T,68 consistent with prior NMR
evi-dence for a field-induced phase transition.9 This
field-induced order is unidirectional and observed only along [010].68,69NMR work suggests that the three-dimensional
order does not simply evolve from the short-range two-dimensional correlations, but rather that the latter coex-ist with the former.70 Fermi-surface reconstruction does
not necessarily require long-range CDW correlations.21
Furthermore, Fermi-surface reconstruction by unidirec-tional (criss-crossed in a bilayer system) order would re-sult in multiple QO frequencies,71which are not observed in Hg1201.21Although multiple frequencies are observed
in YBCO,16 this is not inconsistent with Fermi-surface reconstruction due to bidirectional CDW order.56,59
Upon treating the hole concentration as an implicit pa-rameter, a comparison between Hg1201 and YBCO can be made regarding the relationship between qCDW
(mea-sured in the absence of an applied magnetic field) and F (estimated in the case of YBCO from the central QO frequency): Fig. 7(b) demonstrates that these two ob-servables exhibit a universal linear relationship despite the different FS topologies of the two compounds. It is thus reasonable to assume that the CDW order observed in the absence of an applied magnetic field is universally responsible for the reconstruction of the pseudogapped FS.
Our calculation for Hg1201 points to a possible Lif-shitz transition due to overlap of the electron pockets as the hole concentration approaches p ∼ 0.105 (Fig. 7(a)), which would result in the formation of a hole pocket cen-tered at the Brillouin zone center. This transition would significantly alter the electronic properties of Hg1201, with distinct signatures expected in transport experi-ments in high magnetic fields.
B. Influence of disorder on the CDW order in Hg1201
It has been suggested that disorder pins otherwise fluc-tuating CDW correlations and disrupts CDW coherence, rendering ξ finite.22 This is supported by recent NMR
work for YBCO that indicates static correlations pinned by native defects below TCDW, although ξ may indeed
be set by the correlation length of the pure system.70
Al-ternatively, CDW order might be long-ranged, static and unidirectional in the absence of disorder.73
Although we are not able to experimentally distin-guish between these scenarios, we can gain new insight from considering the fact that a major source of disor-der in Hg1201 are the interstitial oxygen (i-O) atoms in the HgOδ layers. Under the assumption that the i-O
atoms are randomly distributed, we have simulated the effects of these i-O atoms on the CDW correlation length (Appendix C) and find that the average size of ordered patches pinned (in the form of halos around the pinning centers) or limited by i-O is very small, ξ/a ≈ 2.6 at p = 0.083, whereas the experimental value around this doping is ξ/a ≈ 7 − 8 at low temperatures (ξ/a ≈ 4 − 5 close to TCDW). This suggests that individual i-O atoms
have a rather weak effect. However, the local interactions should be more significantly altered by unit cells with two i-O atoms (one in each of the two HgOδ layers adjacent to
a CuO2 layer). Indeed, in this case we find that the
sim-ulated correlation length agrees rather well with the low-temperature data (Fig. 8). In this picture, the correlation length increases with doping, but the phase decoherence among neighboring CDW patches naturally limits their extend at doping levels above p ≈ 0.09 (see Fig. 6(a)). The increasing density of the lattice units hosting two i-O
FIG. 7. (color online) (a) Noninteracting tight-binding FS of Hg1201 at p = 0.07 (light blue) and p = 0.11 (light red) with hopping parameters from Ref.72. Thick lines: reconstructed electron pocket; double-arrows: qCDW (see main text). (b)
Pocket size, as a fraction of the Brillouin zone, and associated quantum-oscillation frequency (F ) for Hg1201 and YBCO as a function of qCDW. Blue square (Hg1201)20,45 and red
tri-angles (YBCO)62represent the doping levels for which both
qCDW and F have been determined experimentally. F is
re-lated to the Fermi pocket size S via the Onsager relation, F = ~S/2πe. Blue circles: pocket size estimated from tight-binding calculation, with qCDW obtained from the linear fit in
Fig. 6(b). Horizontal error bars: experimental uncertainty in qCDW. Blue triangles: recent high-precision experimental
re-sult for F .21Inset: doping dependence of the electron pocket in the reduced Brillouin zone (increments: ∆p = 0.01). Pre-dicted Lifshitz-type change in FS topology at p ≈ 0.105 (black arrow) due to overlap of reconstructed pockets (see result for p ≈ 0.11 in panel (a)).
can explain why the CDW correlation length in Hg1201 never reaches the values observed for YBCO and why CDW order vanishes at lower doping. In YBCO, various types of oxygen-dopant defects are observed that may similarly limit ξ/a.74Hg1201 exhibits the highest optimal
Tc of all single-layer cuprates.24It is an intriguing
possi-bility that, for Hg1201, Tcat optimal doping is so high in
part because the disorder potential of i-O pairs disrupts CDW order that would otherwise compete with SC order up to or even beyond optimal doping, as in YBCO or in single-layer electron-doped Nd2−xCexCuO4+δ.75
Disorder and electronic inhomogeneity are inherent to the cuprates.23,24NMR measurements indicate that,
sim-ilar to other cuprates, Hg1201 exhibits a considerable local electric-field gradient distribution.26 As a result,
volume-averaging probes (e.g., RXS, XRD, optical spec-troscopy and charge transport) integrate contributions from regions with different local electronic environments. This averaging might mask a possible inherent electronic instability at a distinct doping level where the CDW phe-nomenon is most robust (p ≈ 0.08 in the case of Hg1201). On the other hand, if the CDW properties evolve mono-tonically as a function of doping, we expect the inhomo-geneity to have little effect (as the averaged properties are effectively represented by the median value).
C. Nature of the atomic displacements associated with the CDW order in Hg1201
We can furthermore make some inferences about the nature of the atomic displacements associated with the CDW order. In YBCO, the primary displacements are shear displacements in the c-direction.67 Because this material contains a bilayer, these displacements have a first-order effect on local carrier energy and dop-ing, and therefore couple directly to the Fermi surface reconstruction.59 In Hg1201, the single CuO
2 plane per
primitive cell is a mirror plane, and c-axis atomic dis-placements will only affect carrier energies to second or-der, and so will have a negligible coupling to the Fermi surface reconstruction. A similar argument also holds for basal-plane displacements transverse to the CDW wavevector. We therefore deduce that in Hg1201, the CDW in the CuO2 planes must have a
longitudinally-polarized component in order to couple to the Fermi-surface reconstruction.
Figure 9 contains a sketch of the atomic displacements required by group theory for a mode with a single in-commensurate wavevector. The biaxial case is the su-perposition of two such patterns at right angles. Longi-tudinal displacements in a CuO2 plane necessarily imply
c-axis displacements in the BaO layers which are mirror-symmetric about the CuO2 plane. By symmetry, there
will be no c-axis displacements in the HgOδ layer,
al-though there will be basal-plane displacements.
We have not measured sufficiently many CDW satel-lites to quantify the displacements represented in Fig. 9,
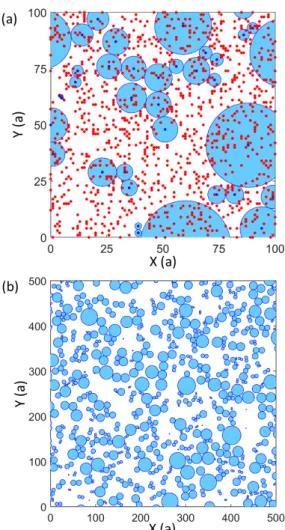
FIG. 8. (color online) Representation of the two HgOδlayers
adjacent to a CuO2 layer in Hg1201. (a) Red and blue dots
represent randomly distributed i-O atoms with a density that corresponds to p = 0.083 (ref.27–29), the doping level at which the CDW correlation length is the largest (Fig. 6). The red dots indicate unit cells with one i-O, either in the top or the bottom HgOδ layer. The dark blue dots indicate unit cells
with two i-O, one in each of the two HgOδlayers. In the model
considered here (see also Appendix C), CDW patches (light blue circles) nucleate in these relatively rare unit cells and extend to the closest doubly-occupied site. This results in a CDW correlation length of ξ/a ≈ 7.7, in good agreement with the experimental value ξ/a = 8.0(7) at this doping level. With increasing doping, the calculated correlation length decreases and follows the experimental values, as shown in Fig. 6(b). Displayed area: (100 a)2. (b) Same as in (a), but on a larger
scale (displayed area: (500 a)2) for better visualization of the CDW patch distribution.
which arise from physical and group theory arguments. However, we can show that this picture is consistent with the results obtained so far. First, we note that the contri-bution of an atomic displacement to the amplitude that determines the intensity of a CDW satellite is propor-tional to the scalar product of the scattering vector Q and the displacement67. Hence, the intensity at (3-qCDW,
0, 1.25) primarily depends on basal-plane displacements,
FIG. 9. (color online) Illustration of the average atomic dis-placements proposed for the CDW order in Hg1201. The red, green and black dashed lines correspond to the CuO2, BaO
and HgOδlayers, respectively. Black (blue) arrows represent
the longitudinal (transverse) atomic displacements. Small and large displacements are indicated by the length of the arrows (not to scale). See the text for further details.
whereas the (4-qCDW, 0, 6) satellite weights basal plane
to c-axis amplitudes in the ratio ∼ 1.5 : 1. If out-of-plane displacements of Ba atoms dominated the structure fac-tor, the L = 6 satellite peak would be expected to be more than an order of magnitude stronger in intensity than the satellite at L = 1.25, mainly due to a larger L value. Since the intensities of the two satellites are com-parable, this strongly suggests that the basal-plane dis-placements in the CuO2layer are the major ones involved
in the CDW order. A full structural refinement, using a more relaxed geometry to allow many CDW satellites to be observed, would allow this picture to be confirmed.
For a single CDW mode, the Cu-O bond parallel to q is modulated in length by the displacements, whereas the equivalent bond perpendicular to q is not. This can be considered as an indication of a contribution from the d-density wave state originally proposed for YBCO.76 It has been suggested that the breaking of fourfold symme-try around the planar copper atoms is a common aspect of the FS reconstruction in the cuprates.77We see no
ev-idence for a macroscopic symmetry breaking of this form in Hg1201. For a single CDW mode, the local fourfold symmetry around a copper atom is indeed broken. How-ever, the superposition of two equivalent CDWs at right angles (the bidirectional case discussed earlier in this pa-per) would restore this symmetry globally.
V. SUMMARY
We have used synchrotron X-ray radiation to study the CDW order in simple tetragonal Hg1201. Our res-onant X-ray scattering and hard X-ray diffraction mea-surements provide new insight into this phenomenon and
its connection with charge transport in the cuprates. The structural simplicity of Hg1201 enabled us to establish a direct link between properties of the CDW order and the Fermi-surface-reconstructed state. The consideration of our results along with available quantum-oscillation data allowed us to simulate the size of the Fermi pocket in Hg1201 and its evolution with doping. Although the observed doping and temperature dependences of the charge correlations in Hg1201 are similar to YBCO, the CDW order is more robust in the latter compound. The characteristic charge-order temperature and correlation length universally increase with increasing carrier con-centration. In YBCO, the correlation length reaches a maximum of about 20 lattice units and CDW order is observed up to about optimal doping. In contrast, in Hg1201 the maximum is only about 8 lattice units and CDW order disappears well before optimal doping is reached, once the correlation length is comparable to the CDW modulation period. For Hg1201, the charac-teristic onset temperature of the CDW phenomenon as determined with X-rays coincides with the characteris-tic temperature identified in prior transient reflectivity work. Consideration of the disorder induced by the in-terstitial oxygen atoms led us to propose that the CDW correlation length in Hg1201 is limited by pairs of such dopants within the same unit cell. Finally, our analy-sis of CDW satellite peaks observed via X-ray diffraction indicates that the dominant atomic displacements
asso-ciated with the CDW order are longitudinally-polarized displacements within the CuO2plane.
VI. ACKNOWLEDGMENTS
We thank A. V. Chubukov, M.-H. Julien, Yuan Li, E. H. da Silva Neto, and C. Proust for valuable com-ments on the manuscript, and acknowledge the contri-butions of M. K. Chan, C. J. Dorow and M. J. Veit to the sample preparation. The work at the Univer-sity of Minnesota (crystal growth and characterization, X-ray measurements and data analysis) was funded by the Department of Energy through the University of Minnesota Center for Quantum Materials, under DE-SC-0016371 and DE-SC-0006858. Research performed at the Canadian Light Source, was supported by CFI, NSERC, the University of Saskatchewan, the Govern-ment of Saskatchewan, Western Economic Diversifica-tion Canada, NRC, and CIHR. Work at HASYLAB and TUW was supported by FWF project P27980-N36. Work with the Birmingham 17 T cryomagnet was supported by the U.K. EPSRC, grant number EP/J016977/1. EMF was supported by the Leverhulme Foundation. The data were analyzed using SPECPLOT and SPCFIT packages; http://webusers.spa.umn.edu/~yu/index.html ∗ wojciech.tabis@lncmi.cnrs.fr † greven@umn.edu 1
B. Keimer, S. A. Kivelson, M. R. Norman, S. Uchida, and J. Zaanen, Nature 518, 179 (2015).
2
B. Fauqu´e, Y. Sidis, V. Hinkov, S. Pailh´es, C. T. Lin, X. Chaud, and P. Bourges, Phys. Rev. Lett. 96, 197001 (2006).
3 Y. Li, V. Bal´edent, N. Bariˇsi´c, Y. Cho, B. Fauqu´e, Y. Sidis,
G. Yu, X. Zhao, P. Bourges, and M. Greven, Nature 455, 372 (2008).
4 M. K. Chan, C. J. Dorow, L. Mangin-Thro, Y. Tang, Y.
Ge, M. J. Veit, G. Yu, X. Zhao, A. D. Christianson, J. T. Park et al., Nat. Commun. 7, 10819 (2016).
5 M. K. Chan, Y. Tang, C.?J. Dorow, J. Jeong, L.
Mangin-Thro, M. J. Veit, Y. Ge, D. L. Abernathy, Y. Sidis, P. Bourges, and M. Greven, Phys. Rev. Lett. 177, 277002 (2016).
6
J. M. Tranquada, B. J. Sternlieb, J. D. Axe, Y. Nakamura, and S. Uchida, Nature 375, 561 (1995).
7 E. Hoffman, K. McElroy, D. H. Lee, K. M Lang, H. Eisaki,
S. Uchida, and J. C. Davis, Science 295, 466 (2002).
8
C. Howald, H. Eisaki, N. Kaneko, and A. K. Kapitulnik, Proc. Natl Acad. Sci. USA 100, 9705 (2003).
9 T. Wu, H. Mayaffre, S. Kr¨amer, M. Horvati´c, C. Berthier,
W. N. Hardy, R. Liang, D. A. Bonn, and M. Julien, Nature 477, 191 (2011).
10 G. Ghiringhelli, M. Le Tacon, M. Minola, S.
Blanco-Canosa, C. Mazzoli, N. B. Brookes, G. M. De Luca, A. Frano, D. G. Hawthorn, F. He et al., Science 337, 821
(2012).
11
J. Chang, E. Blackburn, A. T. Holmes, N. B. Christensen, J. Larsen, J. Mesot, Ruixing Liang D. A. Bonn, W. N. Hardy, A. Watenphul et al., Nat. Phys. 8, 871 (2012).
12
N. Bariˇsi´c, M. K. Chan, Y. Li, G. Yu, X. Zhao, Martin Dressel, Ana Smontara, and M. Greven, Proc. Nat. Acad. Sci. USA 110, 12235 (2013).
13 S. I. Mirzaei, D. Stricker, J. N. Hancock, C. Berthod, A.
Georges, E. van Heumen, M. K. Chan, X. Zhao, Y. Li, M. Greven, N. Bariˇsi´c, and D. van der Marel, Proc. Nat. Acad. Sci. USA 110, 5774 (2013).
14
M. K. Chan, M. J. Veit, C. J. Dorow, Y. Ge, Y. Li, W. Tabis, Y. Tang, X. Zhao, N. Bariˇsi´c, and M. Greven, Phys. Rev. Lett. 113, 177005 (2014).
15
N. Bariˇsi´c, M. K. Chan, M. J. Veit, C. J. Dorow, Y. Ge, Y. Tang, W. Tabis, G. Yu, X. Zhao, and M. Greven, arXiv:1507.07885 (2015).
16
N. Doiron-Leyraud, C. Proust, D. LeBoeuf, J. Levallois, J. B. Bonnemaison, R. Liang, D. A. Bonn, W. N. Hardy, and L. Taillefer, Nature 447, 565 (2007).
17 A. F. Bangura, J. D. Fletcher, A. Carrington, J.
Leval-lois, M. Nardone, B. Vignolle, P. J. Heard, N. Doiron-Leyraud, D. LeBoeuf, L. Taillefer et al., Phys. Rev. Lett. 100, 047004 (2008).
18
D. LeBoeuf, N. Doiron-Leyraud, J. Levallois, R. Daou, J.-B. Bonnemaison, N. E. Hussey, L. Balicas, J.-B. J. Ramshaw, R. Liang, D. A. Bonn et al., Nature 450, 533 (2007).
19
N. Doiron-Leyraud, S. Badoux, S. Ren´e de Cotret, S. Lepault, D. LeBoeuf, F. Lalibert´e, E. Hassinger, B. J.
Ramshaw, D. A. Bonn, W. N. Hardy et al., Phys. Rev. X 3, 021019 (2013)
20 N. Bariˇsi´c, S. Badoux, M. K. Chan, C. Dorow, W. Tabis,
B. Vignolle, G. Yu, J. B´eard, X. Zhao, C. Proust, and M. Greven, Nat. Phys. 9, 761 (2013).
21 M. K. Chan, N. Harrison, R. D. McDonald, B. J.
Ramshaw, K. A. Modic, N. Bariˇsi´c, and M. Greven, Nat. Commun. 7, 12244 (2016).
22 Y. Caplan, G. Wachtel, and D. Orgad, Phys. Rev. B 92,
224504 (2015).
23
J. C. Phillips, A. Saxena, and A. R. Bishop, Rep. Prog. Phys. 66, 2111 (2003).
24
H. Eisaki, N. Kaneko, D. L. Feng, A. Damascelli, P. K. Mang, K. M. Shen, Z.-X. Shen, and M. Greven, Phys. Rev. B 69, 064512 (2004).
25
J. Bobroff, H. Alloul, P. Mendels, V. Viallet, J.-F. Marucco, and D. Colson, Phys. Rev. Lett. 78 , 3757 (1997).
26 D. Rybicki, J. Haase, M. Greven, G. Yu, Y. Li, Y. Cho,
and X. Zhao, J. Supercond. Nov. Magn. 22, 179 (2009).
27
A. M. Abakumov, V. L. Aksenov, V. A. Alyoshin, E. V. Antipov, and A. M. Balagurov, Phys. Rev. Lett., 80, 385 (1998).
28
E. V. Antipov, A. M. Abakumov, V. L. Aksenov, A. M. Balagurov, S. N. Putilin, M. G. Rozova, Physica B 241, 733 (1998).
29
S. N. Putilin, E. V. Antipov, A. M. Abakumov, M. G. Rozova, K. A. Lokshin, D. A. Pavlov, A. M. Balagurov, D. V. Sheptyakov, and M. Marezio, Physica C: Supercond. and Its Applic., 338, 52 (2000).
30
W. Chen, G. Khaliullin, and O. P. Sushkov et al., Phys. Rev. B 83, 064514 (2011).
31 C. C. Homes, S. V. Dordevic, M. Strongin, D. A. Bonn, R.
Liang, W. N. Hardy, S. Komiya, Yoichi Ando, G. Yu, N. Kaneko et al., Nature 430, 539 (2004).
32 L. Lu, G. Chabot-Couture, X. Zhao, J. N. Hancock, N.
Kaneko, O. P. Vajk, G. Yu, S. Grenier, Y. J. Kim, D. Casa et al., Phys. Rev. Lett., 95, 217003 (2005).
33 Yuan Li, M. Le Tacon, M. Bakr, D. Terrade, D. Manske, R.
Hackl, L. Ji, M. K. Chan, N. Bariˇsi´c, X. Zhao, M. Greven, and B. Keimer, Phys. Rev. Lett., 108, 227003 (2012).
34 Yuan Li, M. Le Tacon, Y. Matiks, A. V. Boris, T. Loew,
C. T. Lin, Lu Chen, M. K. Chan, C. Dorow, L. Ji et al., Phys. Rev. Lett., 111, 187001(2013).
35 E. van Heumen, R. Lortz, A. B. Kuzmenko, F. Carbone,
D. van der Marel, X. Zhao, G. Yu, Y. Cho, N. Bariˇsi´c, M. Greven et al., Phys. Rev. B 75, 054522 (2007).
36
E. van Heumen, E. Muhlethaler, A. B. Kuzmenko, H. Eisaki, W. Meevasana, M. Greven, and D. van der Marel, Phys. Rev. B 79, 184512 (2009).
37
S. Wang, J. Zhang, J. Yan, X.-J. Chen, V. Struzhkin, W. Tabis, N. Bariˇsi´c, M. K. Chan, C. Dorow, X. Zhao et al., Phys. Rev. B 89, 024515 (2014).
38
J. P. Hinton, E. Thewalt, Z. Alpichshev, F. Mahmood, J. D. Koralek, M. K. Chan, M. J. Veit, C. J. Dorow, N. Bariˇsi´c, A. F. Kemper et al., Scientific Rep. 6, 23610 (2016).
39 F. Cilento, S. Dal Conte, G. Coslovich, S. Peli, N.
Nem-brini, S. Mor, F. Banfi, G. Ferrini, H. Eisaki, M. K. Chan et al., Nat. Commun. 5, 4353 (2014).
40
N. Bariˇsi´c, M. K. Chan, Y. Li, G. Yu, X. Zhao, M. Dressel, A. Smontara, and M. Greven, Phys. Rev. B 78, 054518 (2008).
41
Y. Li, N. Egetenmeyer, J. L. Gavilano, N. Bariˇsi´c, and M. Greven, Phys. Rev. B 83, 054507 (2011).
42
F. Coneri, S. Sanna, K. Zheng, J. Lord, and R. De Renzi, Phys. Rev. B 81, 104507 (2010)
43 A. Yamamoto, W.-Z. Hu, and S. Tajima, Phys. Rev. B 63,
024504 (2000).
44 Y. Li, V. Bal´edent, N. Bariˇsi´c, Y. C. Cho, Y. Sidis, G. Yu,
X. Zhao, P. Bourges, and M. Greven, Phys. Rev. B 84, 224508 (2011).
45
W. Tabis, Y. Li, M. Le Tacon, L Braicovich, A. Kreyssig, M. Minola, G. Dellea, E. Weschke, M. J. Veit, M. Ra-mazanoglu, et al., Nat. Commun. 5, 5875 (2014).
46
X. Zhao, G. Yu, Y.-C. Cho, G. Chabot-Couture, N. Bariˇsi´c, P. Bourges, N. Kaneko, Y. Li, L. Lu, E.?M. Mo-toyama et al., Adv. Mater. 18, 3243 (2006).
47
D. G. Hawthorn, F. He, L. Venema, H. Davis, A. J. Achkar, J. Zhang, R. Sutarto, H. Wadati, A. Radi, T. Wilson, et al., Rev. Sci. Instrum. 82. 073104 (2011).
48
A. T. Holmes, G. R. Walsh, E. Blackburn, E. M. For-gan, and M. Savey-Bennett, Rev. Sci. Instrum. 83, 023904 (2012).
49
S. Blanco-Canosa, A. Frano, E. Schierle, J. Porras, T. Loew, M. Minola, M. Bluschke, E. Weschke, B. Keimer, and M. Le Tacon, Phys. Rev. B 90, 054513 (2014).
50
M. Jurkutat, D. Rybicki, O. P. Sushkov, G. V. M. Williams, A. Erb, and J. Haase, Phys. Rev. B 90, 140504 (2014).
51
D. Rybicki, M. Jurkutat, S. Reichardt, C. Kapusta, and J. Haase, Nat. Commun. 7, 11413 (2016).
52 R. Liang, D. A. Bonn, and W. N. Hardy, Phys. Rev. B 73,
180505 (2006).
53
M. A. Metlitski and S. Sachdev, Phys. Rev. B 82, 075128 (2010).
54 K. B. Efetov, H. Meier, and C. P´epin, Nat. Phys. 9, 442
(2013).
55
Y. Wang and A. V. Chubukov, Phys. Rev. B 90, 035149 (2014).
56
A. Allais, J. Bauer, and S. Sachdev, Phys. Rev. B 90, 155114 (2014).
57 W. A. Atkinson, A. P. Kampf, and S. Bulut, New J. Phys.
17, 013025 (2015).
58
Y. Wang, D. Agterberg, and A. V. Chubukov, Phys. Rev. Lett. (2015).
59
A. K. R. Briffa, E. Blackburn, S. M. Hayden, E. A. Yelland, M. W. Long, and E. M. Forgan, Phys. Rev. B 93, 094502 (2016).
60 S. Badoux, W. Tabis, F. Lalibert´e, G. Grissonnanche, B.
Vignolle, D. Vignolles, J. B´eard, D. A. Bonn, W. N. Hardy, R. Liang et al., Nature 531, 210 (2016).
61 G. Campi, A. Bianconi, N. Poccia, G. Bianconi, L Barba,
G. Arrighetti , D. Innocenti, J. Karpinski , N. D. Zhigadlo, S. M. Kazakov et al., Nature 525, 359 (2015).
62 B. Vignolle, D. Vignolles, J. Marc-Henri, and C. Proust,
C. R. Phys. 14, 39 (2013).
63
S. E. Sebastian, N. Harrison, R. Liang, D. A. Bonn, W. N. Hardy, C. H. Mielke, and G. G. Lonzarich, Phys. Rev. Let. 108, 196403 (2012)
64
N. Doiron-Leyraud, S. Badoux, S. Ren´e de Cotret, S. Lepault, D. LeBoeuf, F. Lalibert´e, E. Hassinger, B. J. Ramshaw, D. A. Bonn, W. N. Hardy, et al., Nat. Com-mun. 6, 6034 (2015).
65
I. M. Vishik, N. Bariˇsi´c, M. K. Chan, Y. Li, D. D. Xia, G. Yu, X. Zhao, W. S. Lee, W. Meevasana, T. P. Devereaux, et al., Phys. Rev. B 89, 195141 (2012).
66
R. Comin, R. Sutarto, E. H. da Silva Neto, L. Chauviere, R. Liang, W. N. Hardy, D. A. Bonn, F. He, G. A. Sawatzky,
and A. Damascelli, Science 347, 1335 (2015).
67 E. M. Forgan, E. Blackburn, A. T. Holmes, A. K. R. Briffa,
J. Chang, L. Bouchenoire, S. D. Brown, Ruixing Liang, D. Bonn, W. N. Hardy et al., Nat. Commun. 6, 10064 (2015).
68 S. Gerber, H. Jang, H. Nojiri, S. Matsuzawa, H. Yasumura,
D. A. Bonn, R. Liang, W. N. Hardy, Z. Islam, A. Mehta et al., Science 350, 949 (2015).
69
J. Chang, E. Blackburn, O. Ivashko, A. T. Holmes, N. B. Christensen, M. H¨ucker, Ruixing Liang, D. A. Bonn, W. N. Hardy et al., Nat. Commun. 7 11494 (2016).
70
T. Wu, H. Mayaffre, S. Kr¨amer, M. Horvati´c, C. Berthier, W.N. Hardy, R. Liang, D.A. Bonn, and Marc-Henri Julien, Nat. Commun. 6, 6438 (2015).
71
Akash V. Maharaj, Yi Zhang, B. J. Ramshaw, and S. A. Kivelson, Phys. Rev. B 93, 094503 (2016)
72
T. Das, Phys. Rev. B 86, 054518 (2012).
73
L. Nie, G. Tarjus, and S. A. Kivelson, Proc. Natl Acad. Sci. USA 111, 7980 (2014)
74 T. Wu, R. Zhou, M. Hirata, I. Vinograd, H. Mayaffre, R.
Liang, W. N. Hardy, D. A. Bonn, T. Loew, J. Porras et al., Phys. Rev. B 93, 134518 (2016).
75 E. H. da Silva Neto, B. Yu, M. Minola, R. Sutarto, E.
Schierle, F. Boschini, M. Zonno, M. Bluschke, J. Higgins, Y. Li, et al., Science Adv. 2, e1600782 (2016).
76 Sachdev S. and La Placa R., Phys. Rev. Lett. 111, 027202
(2013).
77
B. J. Ramshaw, N. Harrison, S. E. Sebastian, S. Ghan-nadzadeh, K. A. Modic, D. A. Bonn, W. N. Hardy, Ruix-ing Liang, and P. A. Goddard, NPJ Quantum Materials 2, 8 (2017).
78 N. Harrison and S. E. Sebastian, Phys. Rev. Lett. 106,
226402 (2011).
Appendix A: Search for CDW order in nearly optimally doped Hg1201.
CDW order has been reported from (micro) X-ray diffraction measurements for a nearly-optimally-doped sample of Hg1201 (Tc = 95 K), and it has been
sug-gested that the CDW order competes with i-O order.61
The doping level of this sample is well above the hole con-centration up to which we detected CDW order via res-onant X-ray diffraction, a very sensitive probe of charge order. The reported CDW correlation length exceeds 15 lattice constants at the onset temperature, and hence is much larger than our result (Fig. 6a), and the reported wave vector of qCDW = 0.23 r.l.u. is considerably lower
than qCDW ≈ 0.25 r.l.u., the value predicted from linear
extrapolation of our data in Fig. 6(b) to optimal dop-ing. Moreover, the reported charge order sets in at 240 K, approximately 50 K above T∗≈ 190 K near optimal doping.15 These observations suggest that origin of the
reported feature in ref.61is distinct from the CDW order reported here and for other cuprates. One possible expla-nation is that the observed peak originates from a spuri-ous secondary phase; the data in Fig. 2a of ref.61clearly
show a secondary phase with larger lattice parameters, rotated by approximately 45 degrees with respect to the lattice of Hg1201. Two-phase coexistence would explain the apparent competition between the i-O order, a char-acteristic of Hg1201 near optimal doping. Furthermore, the different lattice constants (and thermal expansion co-efficients) of the two phases would explain the unusual temperature dependence of the feature observed in ref.61
Appendix B: Calculation of reconstructed Fermi surface
The tight-binding FS calculation (Fig. 7) was per-formed for hole doping levels 0.07 ≤ p ≤ 0.11. The hopping parameters that provide the best fit to dis-persions from first-principles calculations were adopted from ref.72: (t, t0, t00, t000) = (0.46, 0.105, 0.08, 0.02) eV.
The doping dependence of the FS was simulated by adjusting the chemical potential so that the unrecon-structed FS satisfies Luttinger’s sum rule and contains 1 + p holes, consistent with photoemission spectroscopy data.65 Hence, 1 + p = 2AF S/ABZ, where AF S (ABZ)
is the area of the Fermi surface (Brillouin zone). In or-der to simulate the reconstructed FS, following ref.78,
we constructed a 4 by 4 Hamiltonian and diagonalized it numerically at each point of reciprocal space, with a typical mesh of 106 points. Having set the band disper-sion and wave vector to the experimentally determined values, the only adjustable parameter left for the calcu-lations is the CDW potential ∆CDW. We fixed the CDW
potential to ∆CDW = 50 meV so that at p = 0.09 the
size of the electron pocket that results from the FS re-construction by the wave vector qCDW = 0.279(5) r.l.u.
con-sistent with experiment.20 The CDW potential ∆CDW
was then kept constant for the calculation of the dop-ing dependence, and the chemical potential was varied. The doping dependence of qCDW employed in the
cal-culations was obtained from the linear fit to the data in Fig. 6(b). After diagonalizing the Hamiltonian, four bands were found to cross the Fermi level, but only the band that corresponds to the electron pocket is displayed in Fig. 7; in order to obtain only one band crossing the Fermi level (the electron pocket), one would have to start with a pseudogapped FS. The resulting FS, plotted in the reduced Brillouin zone in Fig. 7, is expected to un-dergo a Lifshitz transition from electron-like to hole-like Fermi pocket at p ≈ 10.5%. This result could in principle be verified experimentally by performing high-field/low-temperature transport measurements.
Appendix C: Modeling of the CDW correlation length
Compared to YBCO, the CDW order in Hg1201 ex-hibits a rather small correlation length and vanishes well below optimal doping. In search for a possible explana-tion for this observaexplana-tion, we consider the disorder that originates from the doped interstitial oxygen atoms (i-O) in the HgOδ layers of Hg1201. We simulate the
distribu-tion of these i-O atoms and consider the resultant disor-der length scales for three simple scenarios. We estimate the i-O density as a function of Tc from ref.27–29
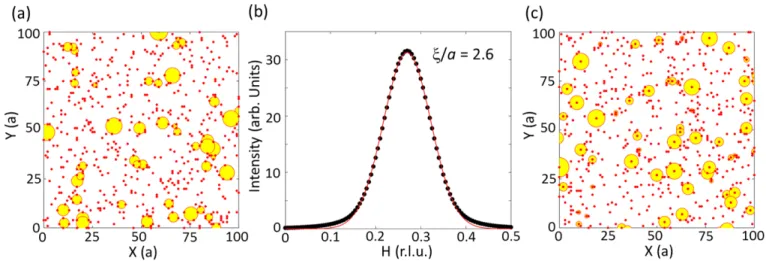
In the first scenario, we assume that CDW patches in the CuO2 planes form within regions defined by the i-O
and that the size of the CDW patches is limited by the neighboring i-O (Fig. 10(a)). We randomly create circu-lar CDW patches between the i-O, maximize their size, and numerically determine the probability P (r) of find-ing a CDW patch with radius r. The scatterfind-ing intensity
from the CDW patches is given by
I(Q) ∝X r P (r) Z r −r dxpr2− x2Ae(iqCDW·x)e−iQ·x 2 (C1) where A is the amplitude, qCDW is the magnitude of the
CDW wave vector, and Q is the magnitude of the momen-tum transfer. The calculations is performed on a 2000 x 2000 lattice of atoms for the doping levels p = 0.063, 0.083 0.091, 0.107 0.12 and 0.142. In the simulations, we assume that A is independent of the radius. The size distribution of CDW patches results in a Gaussian line shape of the CDW peak (Fig. 10(b)). The correlation length is obtained by fitting a Gaussian to the calculated CDW peak, in the same manner as the X-ray data. In this scenario, the calculated correlation lengths are signif-icantly smaller than those obtained from experiment. For example, we obtain ξ/a = 2.6 for p = 0.083, whereas the experimental value at this doping level is ξ/a = 8.0(7). This large discrepancy indicates that it is unlikely that CDW correlations are destroyed by disorder associated with individual i-O. In the second scenario, we assume that the CDW patches develop around i-O and extend to the nearby i-O (Fig. 10(c)). The resultant correlation lengths are comparable to the first scenario.
In the third scenario, we consider that the local struc-tural and electronic environment may be significantly dif-ferent from the typical situation (with zero or one i-O atom) when a CuO2plaquette is affected by two i-O, one
in each of the two adjacent Hg-O layers. Such relatively rare unit cells with two i-O atoms may act as nucleation centers of CDW order and/or as strong pinning sites that lead to the destruction of CDW coherence. In this case, CDW patches extend from unit cells with two i-O atoms to neighboring CDW patches with two i-O atoms, as shown in Fig. 8. The phases of these CDW patches are uncorrelated, as the patches are pinned to different nucleation centers. This third scenario yields correlation lengths very close to the measured low-temperature val-ues (Fig. 6(a)). A similar result is obtained by assum-ing that CDW patches are bound rather than pinned by such unit cells. Therefore, we cannot distinguish whether these sites assist the formation of CDW, or simply pin the CDW. We note that this third scenario is rather unique to Hg1201. For YBCO and other cuprates, the CDW correlations may be affected by other types of disorder.
FIG. 10. (color online) (a) CDW patches (yellow circles) in the CuO2 planes formed in regions between i-O atoms (red dots) in
the adjacent HgOδ layers. Displayed area: (100a)2. The i-O density corresponds to p = 0.083.27–29 (b) CDW peak, calculated
from the distribution of charge-order patches in (a); the correlation length ξ/a = 2.6 is obtained from a Gaussian fit. (c) Same as in (a), but CDW patches develop around i-O and extend to nearest-neighbor i-O. In both (a) and (c), the density of the charge-ordered patches has been decreased for clarity.