S P I N E T A N G O R E P O R T 2 0 1 2
Spine Tango annual report 2012
M. Neukamp•G. Perler•T. Pigott•E. Munting•M. Aebi•C. Ro¨der
Received: 31 July 2013 / Published online: 30 August 2013 Ó Springer-Verlag Berlin Heidelberg 2013
Abstract
Purpose Since the Spine Tango registry was founded over a decade ago it has become established internation-ally. An annual report has been produced using the same format as the SWEspine group to allow for first data comparisons between the two registries.
Methods Data was captured with the latest generation of surgery and follow-up forms. Also, the Core Outcome Measures Index (COMI) from interventions performed in the year 2012 with follow-up to June 2013 was analyzed. Groups of patients with the most common degenerative lumbar spine diseases and a single group of patients with degenerative cervical spine diseases were created. The demographics, risk factors, previous treatments, current treatment, short-term outcomes, patient satisfaction and complications were analyzed. Pre- and postoperative pain and function scores were derived from the COMI. Results About 6,500 procedures were captured with Spine Tango in 2012. The definitions and composition of all the degenerative groups could not completely be mat-ched between the two registries with the consequence that the age and sex distributions were partially different.
Preoperative pain levels were similar. The short-term out-comes available did not allow for evaluation of the final result of surgical intervention. This will be possible with the longer term data in the next annual report. There was a distinct disparity in reported complication rates between surgeons and patients.
Conclusions This is a valuable first step in creating comparable reports for SWEspine and Spine Tango. The German spine registry may be able to collaborate in the future because of similar items and data structure as Spine Tango. There needs to be more work on understanding the harmonization of the different degenerative subgroups. The Spine Tango report is weakened by the short and incom-plete follow-up. The visual presentation of data may be a useful model for aiding decision making for surgeons and patients in the future.
Introduction
The Swedish Spine registry published its annual report in April 2013 [1]. This was felt to be a good model for the creation of a similar report for the Spine Tango registry, to DOI 10.1007/s00586-013-2943-x
and weaknesses. The many users participating in the cre-ation of the new version of forms are sure that this will result in further improved outcome research with Spine Tango in the future.
The content and set-up of the registry have previously been reported [2] and have not changed significantly, with the exception of the documentation form for non-surgical treatments which is slowly gaining recognition (not yet included in the current report and awaiting results of the ongoing reliability study first) [3]. Eurospine and the Spine Tango committee recommend use of EuroQol-5D and the Core Outcome Measures Index (COMI) forms, but the register does also offer other outcome instruments.
To ensure brevity, the report focuses on degenerative spinal disorders, with the associated surgery, follow-up and COMI forms.
Materials and methods
There is no complete compatibility between SWEspine and Spine Tango, but most aspects of epidemiology, patholo-gies and treatments allow comparison. For preoperative data, the following are common parameters: age, gender, smoking status. Preoperative leg and back (neck and arm) pain are displayed in more detail with focus on clinically relevant improvements (MCRC––minimum clinically rel-evant change). Parameters reported in the SWEspine annual report not captured in Spine Tango include: dura-tion of pain before surgery, consumpdura-tion of analgesics before surgery and walking distance. The SF-36 and EQ-5D which document the health related quality of life are less frequently used in Spine Tango. The COMI ques-tionnaires cover pain and disease specific function/quality of life.
Additional Spine Tango parameters include BMI, risk factors for poor outcomes [4], additional spinal patholo-gies, and the COMI score. Flags represent the following risk aspects in (low) back pain: red––serious spinal pathology, yellow––psychosocial or behavioral factors,
We divided follow-up into \3 months and between 3 and 6 months postoperatively. For reasons of database closure for the current analysis in June 2013 and resulting low follow-up rates for [6 months postoperatively, later observations were censored. The following parameters were reported for each follow-up interval: pain levels, COMI score, patient satisfaction question on COMI (if the treatment helped the back pain), overall outcome rating by the examiner, medication consumption, achievement of surgical goals and complications. While the lumbar degenerative pathologies were grouped, the cervical ones were not, thereby following the structure of our Swedish colleagues. More detailed stratification may be possible for future reports from both registries.
Degenerative lumbar spinal procedures
The formation of the diagnostic group did result in some differences with the Swedish reporting structure. These will be explained in more detail in the respective paragraphs.
Selection criteria
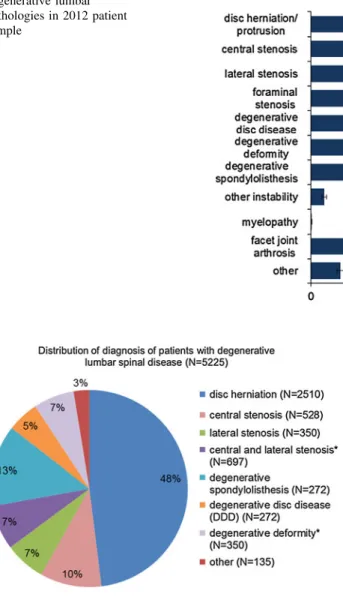
We combined all cases with degenerative lumbar spinal diseases that had surgery in the year 2012. Inclusion cri-teria based on the Spine Tango surgery form were the following: main pathology––degenerative disease; level of procedure––lumbar, lumbosacral or thoracolumbar; most severely affected segment––L1–S1. 5,225 cases/performed surgeries were found in the Spine Tango data pool. The specification of degeneration within this population is shown in Fig. 1.
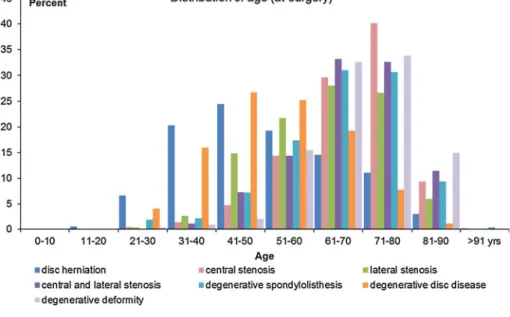
Group creation
The specification of degenerative disease is a multiple choice question in the Spine Tango surgery form. To gain equivalent groups to the Swedish spine registry annual report 2012, we performed a cluster analysis and defined
Results Disc herniation
distribution was: 4.1 % \20, 33.0 % 20–25, 26.7 % 26–30, 11.4 % 31–35, 4.2 % [35.
In 5.4 % there were red flags, yellow in 2.8 %, blue in 2.8 %, orange in 1.1 %, and black ones in 0.8 %. There were no additional spinal pathologies in 96.6 %. There were degenerative deformities in 2.4 %, and a non-degenerative spondylolisthesis in 1 %. In 82.7 % of cases, the extent of lesion was mono-segmental, in 13.4 % bi-segmental and in 3.9 % three or more segments were affected.
In 79 % of cases, it was the first spinal surgery. Previous conservative treatment was reported to be \3 months in 31 %, 3–6 months in 18 %, 6–12 months in 12.8 %, and over 12 months in 13.1 %. In 25.2 % no prior treatment was recorded. 19.5 % of patients had one or two prior lumbar surgeries and in 1.5 % of the cases C 3 previous surgeries were reported. These previous surgeries were at the same level in 54.1 %, in 13.3 % partially.
On the 0–10 VAS, the mean preoperative back pain level was 5 (SD ± 3.1) points, with a range between 0 and 10. Mean leg pain was 6.9 (SD ± 2.5) and the mean COMI Fig. 1 Distribution of
degenerative lumbar pathologies in 2012 patient sample
Fig. 2 Distribution of groups of lumbar degenerative diseases after cluster analysis (*not given in SWEspine report)
were operated on conventionally. In 66.3 % a microscope was used, in 12.4 % the use of loops was recorded, in 17.3 % of cases the technology was documented as mini-mal or less invasive surgery.
A decompression only was performed in 87.5 % of
Fusions were specified as PLIF in 35.1 %, posterolateral fusion in 28.2 %, TLIF in 23.7 %, an anterior interbody fusion in 16.0 %, a posterior fusion in 13.0 % and XLIF in 8.0 %. The rigid stabilizations were specified as interbody stabilization with cage in 70.3 %, pedicle screws with rod Fig. 4 Distribution of surgical
measures for patients with disc herniation
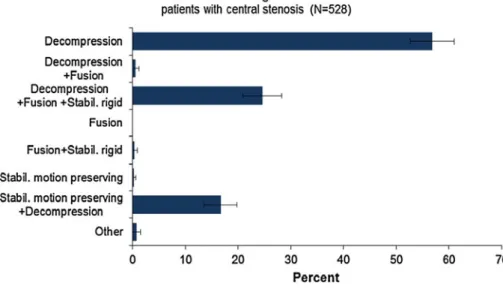
Fig. 3 Diagnosis-group related age distribution
0.2 %. A superficial wound infection during hospitalization was also seen in 0.2 %.
Central spinal stenosis
Patients in this group were excluded if they additionally had a degenerative spondylolisthesis, another instability or degenerative deformity, disc herniation, lateral stenosis or foraminal stenosis. However, patients may have also suf-fered from degenerative disc disease, myelopathy or facet joint arthrosis. With these criteria, 528 patients undergoing surgery in the year 2012 were documented.
Demographic data
Mean age was 68.3 (26.2–89.3) years (SD ± 10.6), 49.6 % were females. 11.7 % were smokers, in 30.1 % of cases, the smoking status was unknown. The BMI distribution was as follows: \20: 2.5 %, 20–25: 26.3 %, 26–30: 38.4 %, 31–35: 15.0 %, [35: 4.6 %, unknown in 13.2 %. In 5.4 % of patients, a red flag was documented, in 4.4 % blue, in 1.7 % yellow, in 1.2 % orange, and in 0.6 % a black one. 1.5 % of cases were repeat surgeries, 1.3 % had an additional non-degenerative spondylolisthesis. In nearly half the cases (47.5 %), the lesion spun only one level, in 29.6 % two levels and in 22.9 % three or more levels.
In 75 % of patients, this was the first surgery. In this group of patients, conservative treatment was of following duration: \3 months in 8.4 %, 3–6 months in 26.1 %, 6–12 months in 15.3 % and [12 months in 34.5 %. In 15.6 % of patients, no previous treatment was documented. 22.0 % of patients with central stenosis had one or two previous surgeries, 3.0 % had three or more previous sur-geries. In 37.0 % of these cases, the previous surgery was at the same level, in 19.2 % partially.
Preoperative mean back pain was 6.5 (SD ± 2.8), leg pain 6.3 (SD ± 3) points; the mean COMI score was 7.4 (SD ± 1.7) points.
Surgical data
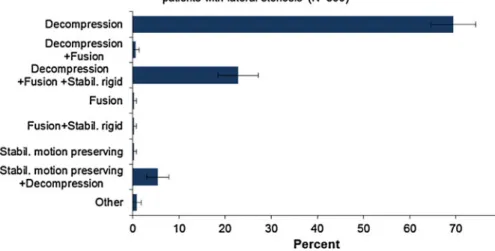
As in the group with disc herniation, peripheral pain relief was documented as the most frequent therapeutic goal (84.3 %). Further goals are axial pain relief (56.6 %), functional improvement (54.7 %), motor improvement (12.7 %), sensory improvement (9.7 %) and spinal stabil-ization (3.4 %). Bladder/sexual function improvement and prophylactic decompression were indicated in 1.1 and 1.3 % of cases. The surgical technology was conventional in 55.3 %, with microscope in 56.3 %, with loops in 5.6 %, and minimally or less invasive in 4.0 % of interventions.
Decompression alone was performed in more than half of the cases (56.8 %). In 24.6 % the decompression was combined with rigid stabilization and fusion, in 16.7 % of cases with motion preserving stabilization. Decompression specifications were flavectomy in 61.9 %, partial facet joint resection in 50.3 %, laminotomy in 27.2 %, laminectomy in 24.4 %, discectomy in 21.0 %, foraminotomy in 15.0 % and hemilaminectomy in 9.3 %.
If a fusion was intended in 47.1 % of cases a PLIF, in 25.4 % a TLIF, in 18.8 % a posterolateral fusion, in 17.4 % a posterior fusion and in 5 % an XLIF were performed.
The rigid stabilization was specified as pedicle screw with rod in 89.7 %, interbody stabilization with rod in 76.5 %, plates in 0.7 %, pedicle hooks with rod in 0.8 %, laminar screws in 0.8 %, and as other stabilization in 2.2 %. The motion preserving stabilization was of a pos-terior dynamic type in 93.5 %, and an interspinous spacer in 6.5 % (Fig. 5).
Fig. 5 Distribution of surgical measures for patients with central stenosis
The most prominent surgical complication was a dural lesion in 6.6 %. Before discharge, 0.9 % of cases devel-oped a superficial wound infection, 0.7 % an epidural hematoma, 0.4 % a CSF leak/pseudomeningocele, 0.4 % a sensory dysfunction, 0.2 % a motor dysfunction and 0.2 % a deep wound infection.
Lateral spinal stenosis
For lateral spinal stenosis, we combined the lateral and foraminal stenosis, in addition to an eventually present degenerative disc disease, myelopathy, or facet joint arthrosis. Excluded were cases with degenerative spond-ylolisthesis, other instability, degenerative deformity, disc herniation and central stenosis. 350 patients with these criteria were documented in 2012.
Demographic data
Mean age was 63.1 (22.7–90) years (SD ± 12.3), 54.3 % were females. 7.6 % of patients were current smokers, for 42.0 % smoking status was unknown. The BMI was \20 for 2.6 %, 20–25 for 23.3 %, 26–30 for 33.5 %, 31–35 for 11.4 % and [35 for 7.3 %; in 21.9 % of cases it was unknown. There were red flags in 5.5 %, blue flags in 2.9 % yellow and orange ones in each 1.7 %, and black flags in 0.3 %. 2.8 % of cases had an additional non-degenerative deformity and 2.3 % a non-degenerative spondylolisthesis. In 64.3 % of cases, it was a single level lesion, 30.9 % extended over two levels, and 4.9 % over three or four levels.
For 72.9 % of patients, it was the first spinal surgery. Of those, 16.6 % had previous conservative treatment of \3 months, 24.5 % between 3 and 6 months, 15.4 % between 6 and 12 months and 29.6 % [12 months. No previous treatment was documented for 13.8 % of patients with their first spinal surgery. 24.3 % had 1 or 2 previous spinal surgeries, 2.9 % over 3 previous surgeries, whereby
50 % of the previous surgeries were at the same level and 21.1 % partially.
Preoperative mean back pain was 6 (SD ± 2.4), leg pain 7.1 (SD ± 2.3) points; the mean COMI score was 7.6 (SD ± 1.7) points.
Surgical data
As consequence of the main pathology, peripheral pain relief was the most frequent surgical goal (90.6 %). It was fol-lowed by axial pain relief (48.9 %), functional improvement (36 %), motor and sensory improvement (16.9 %), spinal stabilization (6.6 %), and stopping deformity progression in 2.3 %. Prophylactic decompression was indicated in 1.4 %, bladder/sexual function improvement in 0.3 %. In 58.6 % of surgeries, a microscope was used, in 37.3 % a conventional surgery was performed, in 16.6 % minimal or less invasive technology, and loops were used in 14.3 %.
Decompression alone was performed in 69.4 % of sur-geries, combined with rigid stabilization and fusion in 22.9 % of cases, and in combination with motion pre-serving stabilization in 5.4 %. Decompression included flavectomy in 58.8 %, partial facet joint resection in 45.2 %, foraminotomy in 43.5 %, laminotomy in 30.8 %, hemilaminectomy in 19.0 %, laminectomy in 10.7 %, and full facet joint resection in 8.6 %. Fusion types were specified as ALIF in 9.2 %, PLIF in 32.2 %, TLIF in 35.6 %, XLIF in 3.4 %, other interbody fusion in 1.1 %, posterolateral fusion in 33.3 %, and other posterior fusion in 20.7 %. The rigid stabilization performed in this group was mainly an interbody stabilization with cage in 71.4 % and pedicle screws with rod in 76.2 %. Laminar screws were used in 7.2 %, an interbody stabilization with auto-/ allograft in 6.0 %, plates and facets screws in 1.2 % each, and other stabilizations in 2.4 %. The motion preserving stabilization was of a posterior dynamic type in 78.3 %, and an interspinous spacer was used in 21.7 % (Fig.6). Fig. 6 Distribution of surgical
measures for patients with lateral stenosis
Central and lateral spinal stenosis
The cluster analysis revealed many cases with combined cen-tral and lateral spinal stenosis, which we describe as a separate group (not documented in SWEspine annual report 2012). Further inclusion and exclusion criteria were equally applied as for the other stenosis groups. This group consists of 383 cases. Demographic data
Mean age was 67.8 (31–89) years (SD ± 11.3), 46.7 % were females. 8.8 % of patients were current smokers at surgery, in 30.9 % the status was not known. The BMI was \20 in 1.3 %, 20–25 in 28 %, 26–30 in 31.5 %, 31–35 in 19.7 %, [35 in 5.6 % and unknown in 13.9 % of cases. There were red flags in 7.7 %, yellow ones in 3.7 %, orange in 1.3 %, blue in 1.1 %, and black ones in 0.8 %. In 2.6 % of cases each, there was an additional non-degenerative defor-mity, and a non-degenerative spondylolisthesis. In 35 % the lesion was a single level one, in 35.5 % it extended over two levels, and in 29.5 % over three or more levels.
75 % of patients had no previous surgery. The duration of the conservative treatment for these patients was \3 -months in 4.2 %, 3–6 -months in 18.7 %, 6–12 -months in 19.8 % and [12 months in 27.6 %. 29.7 % of patients did not receive any previous treatment. 23.2 % of cases had 1 or 2 previous surgeries, and 1.8 % 3 or 4 previous sur-geries. Of these previous surgeries, 28.3 % were at the same level, 22.8 % partially.
Mean preoperative back pain was 5.7 (SD ± 3), leg pain 6.9 (SD ± 2.5) points; the mean COMI score was 7.3 (SD ± 1.7) points.
Surgical data
The distribution of therapeutic goals was peripheral pain relief in 91.6 % of cases, functional improvement in
62.1 %, axial pain relief in 45.4 %, motor improvement in 25.8 %, sensory improvement in 19.1 %, spinal stabiliza-tion in 5.7 % and stopping deformity progression in 2.8 %. 47.7 % of cases were operated with a microscope, 35.5 % with loops. The surgical technique was conventional in 28.3 %, and minimally or less invasive in 18.4 %. Neuro-monitoring was performed in 1 % of surgeries.
Decompression alone was the most frequently per-formed surgical measure (86.7 %). In combination with rigid stabilization and fusion it was performed in 9.1 %, with fusion in only 1 % of cases and with motion pre-serving stabilization in 1.3 %. As decompression type a flavectomy was carried out in 78 % of cases, a partial facet joint resection in 62.8 %, a laminotomy in 48.7 %, a laminectomy in 36.1 %, a foraminotomy in 35.8 %, a hemilaminectomy in 11.5 %, an osteotomy in 8.1 % and a discectomy in 5.5 % of cases. In 2.1 % each, a full facet joint resection, sequestrectomy or flavotomy were per-formed. For the fused patients, there was a posterolateral fusion applied in 54.8 %, a PLIF in 31 %, a TLIF in 11.9 %, a posterior fusion in 9.5 % and an XLIF in 4.5 %. The specification of rigid stabilization was pedicle screws with rod in 77.5 %, interbody stabilization with cage in 32.5 %, laminar screws in 15 % and interbody stabilization with auto-/allograft and other stabilizations in 2.5 % each (Fig.7).
A dural lesion was documented for 10.7 % of cases. Before discharge, an epidural hematoma was observed in 1.3 %, a CFS leak in 1 %, a sensory dysfunction in 0.8 % a wound infection or other hematoma in 0.5 % each, and a radiculopathy and motor dysfunction in 0.3 % each.
Degenerative spondylolisthesis
For this group, only a spondylolisthesis classified of degenerative type was considered. Further degenerative Fig. 7 Distribution of surgical
measures for patients with central and lateral stenosis
specifications were allowed. The only exclusion criterion was a degenerative deformity.
Demographic data
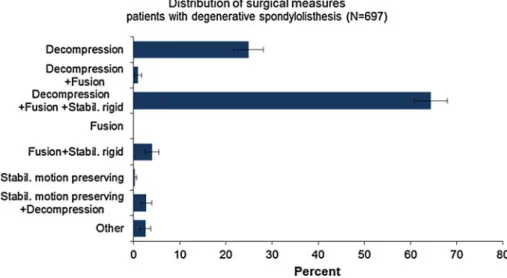
Six hundred and ninety-seven patients with degenerative spondylolisthesis were documented in 2012. Mean age was 65.9 (22–91) years (SD ± 12.6), 68.6 % were females.
8.4 % of patients were current smokers, for 36.2 % the status was unknown. The BMI distribution was \20 in 2.2 %, 20–25 in 25.8 %, 26–30 in 26.9 %, 31–35 in 13.6 %, [35 in 6.2 %, and unknown in 25.3 %. 10.2 % of cases had a red flag, 4.7 % a yellow flag, 2.6 % an orange one, 2.3 % a blue and 1.1 % a black flag. An additional non-degenerative deformity was documented in 5 % of cases, a repeat surgery in 4.1 %. The extent of lesion was limited to one level in 55 % of cases, to two levels in 30.3 % and spanning three or more levels in 14.8 %.
For 77.5 % of patients, it was the first spinal surgery. 14.6 % of these patients did not receive a previous treat-ment, for the others, the previous conservative treatment lasted \3 months in 8.5 %, 3–6 months in 14.6 %, 6–12 months in 14.4 % and over 12 months in 47.8 %. 21 % had 1 or 2 previous surgeries, 1.6 % 3 or 4. Of those previous surgeries, 42 % were at the same level, 26.7 % partially.
Mean back pain was 5.6 (SD ± 3.0), leg pain 6.8 (SD ± 2.7) points; mean COMI score was 7.7 (SD ± 1.6) points.
Surgical data
For patients with degenerative spondylolisthesis, the main therapeutic goal was peripheral pain relief in 86.7 % of cases followed by axial pain relief in 70 %, functional
improvement in 47.1 %, spinal stabilization in 24.5 %, motor improvement in 18.1 %, sensory improvement in 13.8 % and stopping deformity progression in 8.2 % of surgeries. The technology was classified as conventional in 48.5 %, with microscope in 43.0 %, MISS/LISS in 14.6 % and with loops in 13.9 % of cases. Neuro-monitoring was performed in 4.0 % of surgeries.
Decompression with rigid stabilization and fusion was the most frequently performed intervention (64.4 %), fol-lowed by decompression alone (25 %) and rigid stabiliza-tion with fusion but without decompression (4 %). 1 % of surgeries were described as decompression with fusion but without stabilization; a decompression with a motion pre-serving stabilization was performed in 2.7 %. The most frequent decompression type was flavectomy in 57.9 % of cases, followed by partial facet joint resection in 55.6 %, discectomy in 51.0 %, laminotomy in 49 %, foraminotomy in 35.8 %, laminectomy in 20.9 %, sequestrectomy in 10.2 %, full facet joint resection in 9.8 %, and hemilami-nectomy in 9.0 %. Most frequently, a posterolateral fusion was performed (40.8 %), followed by TLIF (34.9 %), PLIF (34.1 %), posterior fusion (21.8 %), XLIF (6.1 %) and anterior interbody fusion in 4.0 %. Rigid stabilization was further specified as pedicle screws with rod in 90.3 %, interbody stabilization with cage in 65.9 %, interbody stabilization with auto-/allograft in 3.6 %, plates in 1.2 %, laminar screws in 1.0 %, pedicle hooks with rod in 0.2 % and facet screws, and laminar hooks with rod in 0.2 % each. There were other stabilizations in 2.2 % (Fig.8).
The intraoperative dural lesion rate was 6 %. The most frequently observed complication during hospitalization was a radiculopathy in 1 %, motor and sensory dysfunction in 1 % each, epidural hematoma, superficial and deep wound infection and implant malposition in 0.6 % each. A CFS leak was only seen in 0.3 %.
Fig. 8 Distribution of surgical measures for patients with degenerative spondylolisthesis
DDD––degenerative disc disease
Exclusion criteria for this group were any type of stenosis or disc herniation, degenerative deformity, degenerative spondylolisthesis and other instability. Only facet joint arthrosis was included in the group selection criteria. 272 cases were revealed.
Demographic data
Mean age was 52.3 years (range 23.6–82, SD ± 12.8); 57.7 % were females. 26.7 % of patients were smoking, for 36.1 % the status was unknown. BMI was documented as \20 in 6.7 %, 20–25 in 31.6 %, 26–30 in 32.0 %, 31–35 in 11.9 %, [35 in 3.7 % and unknown in 14.1 % of patients. 23.4 % of cases had a blue flag, 2.9 % a red, and 2.6 % a yellow one. 93 % of cases had no additional spinal pathology, 4.8 % had had repeat surgery. The extent of lesion was a single level in 62.8 %, two levels in 23.9 % and in 13.2 % over three or more levels.
64.3 % of patients had not had any previous spinal surgery. Their conservative treatment lasted \3 months in 2.8 %, 3–6 months in 16.1 %, 6–12 months in 5.2 % and [12 months in 69.5 % of the cases. 6.3 % had no previous treatment. 33.1 % of patients had 1 or 2 previous surgeries, 2.6 % had three or more. These previous sur-geries were at the same level in 26.11 %, in 14.7 % partially.
Mean back pain was 6.4 (SD ± 2.1), leg pain 4.4 (SD ± 3.3) points; mean COMI score was 7.7 (SD ± 1.6) points.
Surgical data
In nearly all cases (94.9 %), axial pain relief was defined as therapeutic goal, followed by peripheral pain relief
(66.2 %), functional improvement (44.9 %), spinal stabil-ization (7 %), motor improvement (4.8 %), sensory improvement (3.7 %), stopping deformity progression (2.6 %) and prophylactic decompression (0.7 %). A con-ventional surgery was carried out in 72.9 %, minimal or less invasive techniques in 13 % of the cases. A micro-scope was used in 15.2 %, loops in 2.6 % of surgeries. Neuro-monitoring was performed in 2.6 %.
The main surgical procedure was a decompression with rigid stabilization and fusion (72.4 %). A rigid stabilization with fusion but without decompression was performed in 9.2 % of cases.
A decompression with motion preserving stabilization was carried out in 4.4 %, a sole decompression in 3.3 % of surgeries, and a single motion preserving stabilization in 3.3 %. The specification of decompression was a discec-tomy in 93.1 %, partial facet joint resection in 52.8 %, flavectomy in 49.4 %, foraminotomy in 10.3 %, laminot-omy in 9.9 %, full facet joint resection in 9.0 %, hemi-laminectomy in 5.2 %, laminectomy in 2.6 %, sequestrectomy in 3.4 %, and flavectomy in 1.2 % of interventions. The performed fusion was further specified as PLIF in 46.8 %, TLIF in 21.6 %, anterior interbody fusion in 20.3 %, posterolateral fusion in 11.3 %, posterior fusion in 10.0 %, and XLIF in 6.5 %. Interbody stabiliza-tion with cage made up 87.9 % of the stabilized cases, pedicle screws with rod were used in 72.3 %, plates in 8.2 %, an interbody stabilization with auto-/allograft in 3.5 %, facet screws and other stabilizations 1.3 % each and vertebral body replacement by cage and laminar screws in 1.4 % each. The motion preserving stabilization was a total disc replacement in 55.5 %, of a posterior dynamic type in 37 %, and an interspinous spacer in 7.5 % (Fig.9).
There were few intraoperative complications. Dural lesions occurred in 3.6 %, vascular injuries in 1.8 %. Complications during hospitalization were specified as
Fig. 9 Distribution of surgical measures for patients with degenerative disc disease
implant malposition in 1.1 %, radiculopathy in 0.7 % and superficial wound infection and hematoma in 0.4 % each. Degenerative deformity
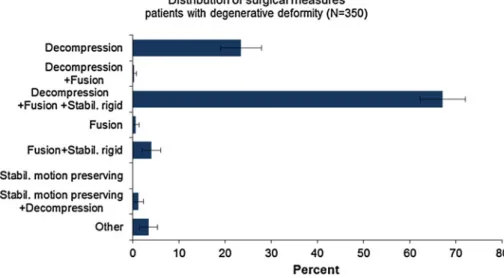
Our cluster analysis for building pathology groups revealed an additional patient type, which we could not match to any group in the SWEspine annual report 2012. We labeled these cases as degenerative deformity. 350 of them were documented in Spine Tango in 2012.
Demographic data
Mean age at surgery was 69.6 years (30–87, SD ± 10), 68.6 % were females. 9.5 % were current smokers, in 7.3 % the status was unknown. The BMI within this group showed the following distribution: \20 in 2.0 %, 20–25 in 21.2 %, 26–30 in 21.2 %, 31–35 in 9.7 %, [35 in 2 %, unknown in 43.8 % of cases. 22.3 % of patients had a red flag, 3.4 % a yellow flag, 2.5 % an orange flag, 1.4 % a blue flag, 0.6 % a black flag. As additional pathologies, we found a pathological fracture in 4.6 %, repeat surgery in 4.9 %, degenerative spondylolisthesis in 2.6 %, non-degenerative deformity in 1.4 % and a tumor in 0.3 % of the cases. 84.9 % had no additional pathology documented. The lesion extended over only one level in 25.7 %, over two levels in 25.4 % and over three or more levels in 48.9 % of cases.
A previous spinal surgery was noted in 42.3 % of cases. In 38.6 % there were 1 or 2 previous surgeries, in 3.7 % 3 or more. 30.4 % of the previous surgeries were at the same level, 40.5 % partially. 18.4 % of patients did not receive any previous treatment, 11.9 % had \3 months conserva-tive treatment, in 10.9 % the conservaconserva-tive treatment had a duration of 3–6 months, in 14.9 % of 6–12 months and in 43.8 % of [12 months.
The analysis of the 142 preoperative COMIs in the database revealed a mean back pain of 5.8 (SD ± 2.8), leg pain of 5.7 (SD ± 3.1) points; the mean COMI score was 7.6 (SD ± 1.6) points.
Surgical data
The therapeutic goals were axial pain relief in 86.3 %, peripheral pain relief in 82 %, functional improvement in 43.4 %, stopping deformity progression in 43.1 %, spinal stabilization in 37.7 %, motor improvement in 17.7 %, sensory improvement in 11.4 % and prophylactic decom-pression in 4.0 %. The technology varied from 39 % conventional procedures, 32.4 % minimally or less inva-sive procedures to use of a microscope in 32.7 % and loops in 14 %. Neuro-monitoring was performed in 7.7 % of the surgeries.
Decompression alone was performed in 23.4 %, in combination with rigid stabilization and fusion in 67.1 % of cases. A rigid stabilization and fusion without decompression was performed in 4 % of the surgeries. The specification of decompression showed discectomy as the most frequent decompression type (56.5 %), followed by flavectomy with 49.8 %, partial facet joint resection with 42.3 %, laminotomy with 39.3 %, foraminotomy with 29.7 %, laminectomy with 12 %, sequestrectomy with 9.9 %, full facet joint resection with 7.2 %, osteot-omy with 6.6 %, hemilaminectosteot-omy with 4.8 % and flav-ectomy with 4.5 %. The fusion types can be further specified into XLIF in 41.2 % of surgeries, posterior fusion and TLIF in 26.1 % each, posterolateral fusion in 24.9 %, PLIF in 17.5 %, and anterior interbody fusion in 0.4 %. The stabilization rigid was specified as interbody stabilization with cage in 74.7 %, pedicle screws with rod in 59.7 %, interbody stabilization with auto-/allograft in 5.0 %, laminar screws in 2.3 %, pedicle hooks with rod in
Fig. 10 Distribution of surgical measures for patients with degenerative deformity
1.9 %, other stabilization in 1.5 %, plates in 1.1 % and facet screws and laminar hooks with rod in 0.4 % of cases each (Fig.10).
A dural lesion was seen in 6.3 %, nerve root damage, vascular injury, or fracture of vertebral structures in 0.3 % each. During hospitalization, the most frequent complica-tion was a motor dysfunccomplica-tion with 1.7 %, radiculopathy,
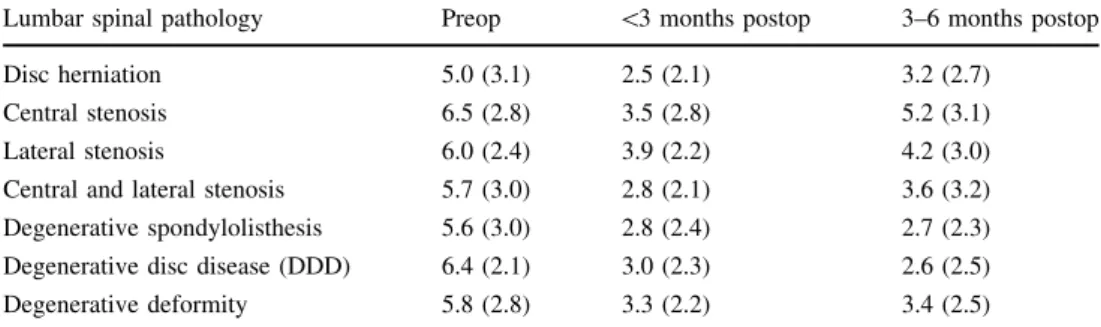
Tables1,2, 3 display the pre- and postoperative mean values of back and leg pain and COMI score for patients with lumbar degenerative diseases.
Disc herniation \3 Months FU Table 1 Follow-up mean
values for back pain
Standard deviations in brackets
Lumbar spinal pathology Preop \3 months postop 3–6 months postop Disc herniation 5.0 (3.1) 2.5 (2.1) 3.2 (2.7)
Central stenosis 6.5 (2.8) 3.5 (2.8) 5.2 (3.1) Lateral stenosis 6.0 (2.4) 3.9 (2.2) 4.2 (3.0) Central and lateral stenosis 5.7 (3.0) 2.8 (2.1) 3.6 (3.2) Degenerative spondylolisthesis 5.6 (3.0) 2.8 (2.4) 2.7 (2.3) Degenerative disc disease (DDD) 6.4 (2.1) 3.0 (2.3) 2.6 (2.5) Degenerative deformity 5.8 (2.8) 3.3 (2.2) 3.4 (2.5)
Table 2 Follow-up mean values for leg pain
Standard deviations in brackets
Lumbar spinal pathology Preop \3 months postop 3–6 months postop Disc herniation 6.9 (2.5) 2.7 (2.5) 2.9 (3.0)
Central stenosis 6.3 (3.0) 3.2 (3.3) 4.8 (3.5) Lateral stenosis 7.1 (2.3) 3.8 (2.4) 3.9 (2.9) Central and lateral stenosis 6.9 (2.5) 2.5 (2.3) 2.6 (3.2) Degenerative spondylolisthesis 6.8 (2.7) 2.9 (3.2) 3.2 (3.3) Degenerative disc disease (DDD) 4.4 (3.3) 3.0 (3.7) 2.6 (3.3) Degenerative deformity 5.7 (3.1) 3.0 (2.7) 2.3 (2.8)
Table 3 Follow-up mean values for COMI score
Standard deviations in brackets
Lumbar spinal pathology Preop \3 months postop 3–6 months postop Disc herniation 7.7 (1.6) 4.4 (2.5) 4.4 (2.8)
Central stenosis 7.4 (1.7) 4.6 (2.7) 5.9 (2.4) Lateral stenosis 7.6 (1.7) 5.2 (1.7) 5.2 (2.7) Central and lateral stenosis 7.3 (1.7) 4.3 (2.0) 4.3 (3.0) Degenerative spondylolisthesis 7.7 (1.6) 4.7 (2.5) 4.0 (2.7) Degenerative disc disease (DDD) 7.7 (1.6) 5.4 (2.0) 5.0 (2.9) Degenerative deformity 7.6 (1.6) 5.3 (2.3) 3.9 (2.4)
that it had helped only a little, 3.3 % that it had not helped, in 0.8 % it had made things worse. As opposed to the surgeon-based complication rating, 21.8 % of patients indicated that postoperative complications had arisen. 3–6 Months FU
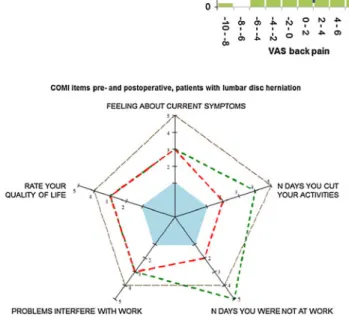
Figure11displays the distribution of back and leg pain relief and COMI score improvement at 3–6 months after surgery
not helped and 2 % that it had made things worse. 21.3 % of patients documented that a complication had arisen.
Central spinal stenosis \3 Months FU
The overall outcome rated by the examiner was excellent in 27.8 %, good in 60.4 %, fair in 10.1 % and poor in 1.8 % of cases. No medication was taken by 49.7 % of the patients, 38.5 % took NSAIDs, 10.1 % weak opiates, 4.1 % strong opiates and 0.6 % antidepressants. In 87.6 % of cases, all surgical goals were achieved or partially achieved. A complication occurred in 4.7 %. 51.5 % of patients stated that the treatment had helped a lot, 30.3 % that it had helped, 9.1 % that it had only helped a little, 6.1 % that it had not helped and 3.0 % that the treatment had made things worse. 21.8 % documented that a com-plication had arisen as a consequence of the operation. 3–6 Months FU
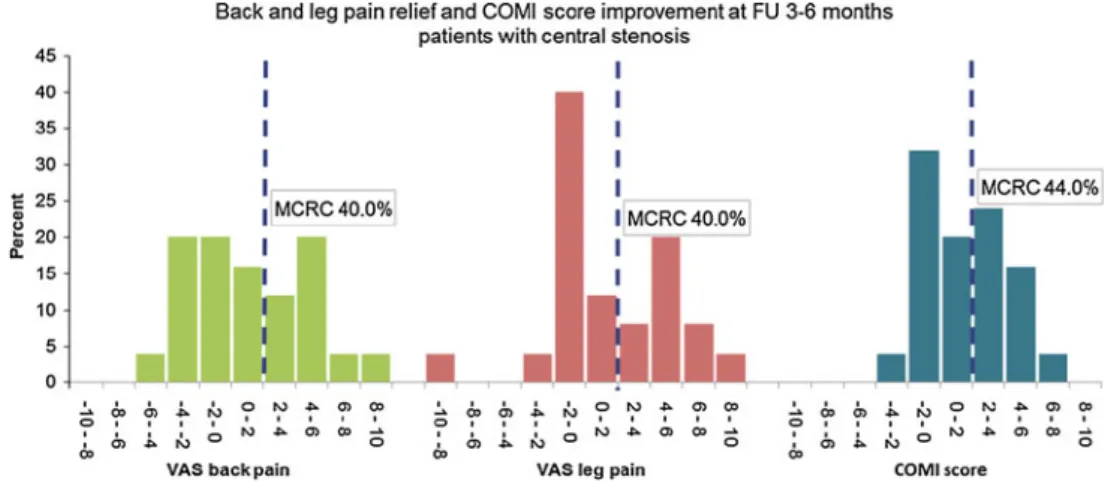
Figure13displays the distribution of back and leg pain relief and COMI score improvement at 3–6 months after surgery with a focus on minimum clinically relevant changes (MCRC). Figure14displays the improvement of outcomes of Fig. 11 Back and leg pain
relief and COMI score improvement for patients with disc herniation at 3–6 months FU
Fig. 12 Improvement of COMI domains from preoperative to \3 months and 3–6 months FU
Lateral spinal stenosis \3 Months FU
The overall examiner-based outcome was excellent in 32.5 %, good in 54.2 %, fair in 10.8 % and poor in 1.2 %. No medication was needed in 55.4 %, NSAIDs in 34.9 %, weak opiates in 4.8 % and strong opiates in 7.2 % of cases. In 91.6 % of patients, all the surgical goals were achieved
of individual COMI domains from preoperative to \3 months and 3–6 months postoperative. 23.3 % of patients had an excellent overall outcome as rated by the examiner, 60 % a good one, 10 % a fair and 6.7 % a poor one. 61.7 % of patients did not take any medication anymore, 31.7 % took NSAIDs, 5 % weak opiates, 3.3 % antidepres-sants and 1.7 % a vitamin B complex. In 86.7 % all the surgical goals were achieved or partially achieved. 5 % of patients had a complication. 27.6 % of patients documented that the treatment had helped a lot, 51.7 % that it had helped, 6.9 % that it had only helped a little. In 6.9 % each, the treatment had not helped or had made things worse. 10.3 % of the patients documented a complication.
Central and lateral spinal stenosis \3 Months FU
Distribution of overall outcome rating by the examiner was excellent in 34.2 %, good in 52.4 %, fair in 12.2 % and poor in 1.2 % of patients. 59.7 % were in no need of medication, 31.7 % took NSAIDs, 4.8 % weak opiates and 1.2 % took steroids. All the surgical goals were achieved or partially in 97.6 % of patients. 3.7 % of cases had a complication. The treatment had helped a lot in 64 %, had helped in 32.0 %, and had only helped a little in 4 %. Fig. 13 Back and leg pain
relief and COMI score improvement for patients with central spinal stenosis at 3–6 months FU
Fig. 14 Improvement of COMI domains from preoperative to \3 months and 3–6 months FU
needed in 76.9 % of patients, 23.1 % took NSAIDs, and 3.8 % a vitamin B complex. In 88.5 % of cases, all the surgical goals had been achieved or partially achieved. 7.7 % of patients had a complication. According to
patients’ rating, the treatment had helped a lot in 57.1 %, helped in 14.3 %, helped only little in 23.8 % and had not helped in 4.8 %. 23.8 % of patients reported to have a complication as a consequence of the operation.
Fig. 15 Back and leg pain relief and COMI score improvement for patients with lateral spinal stenosis at 3–6 months FU
Fig. 16 Improvement of COMI domains from preoperative to \3 months and 3–6 months FU
Fig. 17 Back and leg pain
Fig. 18 Improvement of COMI domains from preoperative to \3 months and 3–6 months FU
Degenerative spondylolisthesis \3 Months FU
Overall examiner-based outcome was excellent in 34.1 %, good in 53.6 %, fair in 10.6 % and poor in 1.7 % of cases. 50.8 % of patients did not take any medication, 36.9 % took NSAIDs, 10.1 % weak opiates, 7.8 % strong opiates, 0.6 % antidepressants and 1.1 % antibiotics. In 91.6 % of patients, all the surgical goals had been achieved or partially achieved. The complication rate was 15.1 %. 58.2 % of patients stated that their treatment had helped a lot, 30.4 % that it had helped, 7.6 % that it only helped a little and 3.8 % that it had not helped. 23.4 % of patients documented a complication as a consequence of the operation.
Fig. 19 Back and leg pain relief and COMI score improvement for patients with degenerative spondylolisthesis at 3–6 months FU
Fig. 20 Improvement of COMI domains from preoperative to \3 months and 3–6 months FU
Fig. 21 Back and leg pain relief and COMI score improvement for patients with degenerative disc disease at 3–6 months FU
3–6 Months FU
Figure19 displays the distribution of back and leg pain relief and COMI score improvement at 3–6 months after surgery with a focus on minimum clinically relevant changes (MCRC). Figure20displays the improvement of outcomes of individual COMI domains from preoperative to \3 months and 3–6 months postoperative. For this interval, the overall outcome was excellent in 29.2 %, good in 54.0 %, fair in 14.2 % and poor in 1.8 % of patients. 52.2 % of cases took no medication, 35.4 % NSAIDs, 7.1 % weak opiates, 4.4 % strong opiates and 0.9 % anti-depressants. Surgical goals were achieved or partially achieved in 89.4 %. 12.4 % of patients had a complication at follow-up. 56.8 % of patients rated that the treatment had helped a lot, 22.7 % that it had helped, in 9.1 % each it had helped only little or not at all. In 2.3 % it had made thing worse. 34.1 % of patients stated that a complication had arisen as a consequence of the operation.
Degenerative disc disease (DDD) \3 Months FU
7.0 % of cases had an excellent overall outcome according to the examiner, 83.1 % a good one, 8.5 % a fair and 1.4 % a poor result. No medication was needed by 42.3 % of patients, 39.4 % took NSAIDs, 14.1 % weak opiates, 2.8 % strong opiates, 4.2 % steroids and 1.4 % took antibiotics. In 95.8 % of cases, all the surgical goals were achieved or partially achieved. 8.5 % of cases had a complication. For 33.3 % of patients, the treatment had helped a lot, for 41.7 % it had helped, for 25.0 % it had helped only little. 33.3 % of patients reported to have a complication.
3–6 Months FU
Figure21 displays the distribution of back and leg pain relief and COMI score improvement at 3–6 months after surgery with a focus on minimum clinically relevant changes (MCRC). Figure22 displays the improvement of outcomes of individual COMI domains from preoperative to \3 months and 3–6 months postoperative. The overall outcome rated by the examiner was excellent in 18.3 %, good in 64.8 %, fair in 14.1 % and poor in 2.8 % of the cases. 46.5 % took no medication, 40.8 % NSAIDs, 9.9 % weak opiates, 11.3 % strong opiates, 2.8 % steroids and 1.4 % antidepressants. Surgical goals were achieved or partially achieved in 83.1 % of cases. 1.4 % of patients had a recurrence of symptoms. 33.3 % of patients said the treatment had helped a lot, 66.7 % that it had helped. 33.3 % of patients documented a complication.
Degenerative deformity \3 Months FU
The overall outcomes were rated as excellent in 14.9 %, good in 64.9 %, fair in 14.9 % and poor in 5.4 % of cases. Fig. 22 Improvement of COMI domains from preoperative
to \3 months and 3–6 months FU Fig. 23 Back and leg pain
Medication consumption was none in 32.4 %, NSAIDs in 45.9 %, weak opiates in 14.9 %, strong opiates in 17.6 % and antidepressants in 1.4 % of patients. In 87.8 % of cases, all the surgical goals were achieved or partially achieved. The complication rate was 10.8 %. According to patients, the treatment had helped a lot in 37.1 %, helped in 40.3 %, helped only little in 19.4 % and had not helped in 3.2 % of cases. 32.8 % of patients stated that a complica-tion had arisen as a consequence of the operacomplica-tion.
3–6 Months FU
Figure23 displays the distribution of back and leg pain relief and COMI score improvement at 3–6 months after surgery with a focus on minimum clinically relevant changes (MCRC). Figure24 displays the improvement of outcomes of individual COMI domains from preoperative to \3 months and 3–6 months postoperative. For these patients, the overall outcome was rated as excellent in 12.8 %, good in 61.7 %, fair in 19.2 % and poor in 6.4 %. No medication was needed in 40.4 %, NSAIDs were taken in 40.4 %, weak opiates in 27.7 %, strong opiates in 6.4 % of cases. In 89.4 % all the surgical goals were achieved or partially achieved. 15 % of patients had a complication. The outcome rating by the patients was: helped a lot in 42.3 %, helped in 46.2 %, helped a little in 7.7 %, and did not help in 3.9 %. In 15.4 %, patients indicated that the surgery had made things worse. 15.4 % of patients documented a complication on their COMI form.
Fig. 24 Improvement of COMI domains from preoperative to \3 months and 3–6 months FU
Fig. 25 Distribution of age (at surgery) for patients with cervical degenerative disease
Fig. 26 Distribution of types of degeneration in patients with cervical degenerative disease
Degenerative cervical spinal procedures Selection criteria
The second part of the analysis describes the cervical proce-dures for degenerative diseases. Included were patients with degenerative cervical disease operated in the year 2012. Inclusion criteria were upper cervical, lower cervical or cerv-ico-thoracic level, most severely affected segment between C1 and Th1, and main pathology being a degenerative disease. With these selection criteria, 1,267 cases were found in the Spine Tango database. Following the structure of the SWE-spine 2012 report, no pathology subgroups were created for the cervical cases. Figure25displays the age distribution of the patient sample with degenerative cervical diseases.
The most frequent degeneration type was a disc herni-ation in 57.8 %, followed by a central stenosis in 35.9 %, a foraminal stenosis in 27.8 %, a degenerative disc disease in 18 %, a myelopathy in 13.6 %, a lateral stenosis in 13.1 %, a facet joint arthrosis in 5.9 %, a degenerative spondylo-listhesis in 3.8 %, a degenerative deformity in 2.5 % and other instability in 0.7 %. In 96.8 % of cases, no additional spinal pathologies were present. In 54.9 % of cases, the extent of lesion spun one segment, in 30.1 % two segments and in 15.0 % three or more segments.
For 84.6 % of patients, it was the first spinal surgery. The previous conservative treatment for these patients was of \3 months duration in 19.6 %, of 3–6 months in 20.2 %, 6–12 months in 13.1 %, and over 12 months in 21.3 %. In 25.9 % there was no prior conservative treat-ment. 13.6 % of patients with degenerative cervical disease had one or two prior spinal surgeries and in 1.8 % of cases C 3 previous surgeries were reported. These previ-ous surgeries were at the same level in 14.8 %, partially in 6.4 %.
Preoperative mean neck pain was 5.4 (SD ± 2.8) with a range between 0 and 10, mean arm/shoulder pain was 3.3 (SD ± 3.1); the mean COMI score was 7.1 (SD ± 2.0). Fig. 27 Distribution of surgical
measures for patients with cervical degenerative disease
Table 4 Neck pain, arm pain and COMI values before and after surgery Cervical degenerative pathology Mean preop Mean \3 months FU Mean 3–6 months FU Neck pain 5.4 (2.8) 2.7 (2.4) 3.1 (3.2) Arm pain 5.8 (2.9) 2.7 (2.9) 3.7 (3.5) COMI score 7.1 (2.0) 4.5 (2.6) 4.6 (2.8) Standard deviations in brackets
The most frequently performed surgical measures were a decompression with rigid stabilization and fusion (64.1 %). Decompression alone was performed in 13.1 % and in combination with fusion in 9.5 %. A motion pre-serving stabilization was performed in 6 %.
As decompression type, a discectomy was performed in 82.6 % of cases, followed by foraminotomy (25.2 %), uncoforaminotomy and laminectomy in 10 % each, sequestrectomy in 7.2 %, flavectomy in 4.1 %, partial
body replacement with auto-/allograft in 0.4 %, facet screws in 0.3 %, and laminar screws in 0.2 %. The motion preserving stabilization was specified as disc replacement in 94.1 % and dynamic stabilization in 1.0 %. In 5.9 % there were other motion preserving stabilizations (Fig. 27). Intraoperative complications were recorded in 1.1 %, surgical complications before discharge occurred in 5.4 %. During hospitalization, motor dysfunction was the most frequently seen complication (1.8 %).
\3 Months FU
FU rate was 29 % at the time the database was exported. The overall outcome rated by the examiner was excel-lent in 28.6 %, good in 58.9 %, fair in 10.9 % and poor in 1.4 % of cases. 62.9 % of patients did not take any medi-cation, 29.4 % took NSAIDs, 5.4 % weak opiates, 2.2 % strong opiates and 0.8 % steroids. In 89.6 % of cases, all the surgical goals were achieved or partially achieved. The complication rate was 6.5 %. 52.3 % of patients stated that the surgery had helped a lot, 27.9 % that it had helped, 14.0 % that it had helped only a little, 4.7 % that it had not helped, in 1.2 % it had made things worse. As opposed to the surgeon-based complication rating, 24.7 % of patients indicated that postoperative complications had arisen. Fig. 28 Neck and arm pain
relief and COMI score improvement at FU 3–6 months patients with cervical
degenerative disease
Fig. 29 Improvement of COMI domains from preoperative to \3 months and 3–6 months FU
medication was needed in 52.2 %, NSAIDs in 35.4 %, weak opiates in 7.1 %, strong opiates in 4.4 % and anti-depressants in 0.9 % of cases. In 90.9 % of cases, all the surgical goals were achieved or partially achieved. The complication rate was 5.5 %. 47.8 % of patients stated that the surgery had helped a lot, 30.4 % that it had helped, 8.7 % that it had only helped a little, 8.7 % that it had not helped and 4.4 % that it had made things worse.
Discussion
This Spine Tango annual report 2012 is the first step towards comparable reporting of results from SWEspine to Spine Tango. In the future, results of the German spine registry of DWG may also become available in a similar format, since data structures and database are the same as Spine Tango. Despite Spine Tango data resulting from the form generation 2011 being incomplete and follow-up being short, we can gain valuable information about sim-ilarities and differences between the data sets.
Creation of the degenerative pathology groups could not be completely harmonized and the different definition of the stenotic and disc herniation patients is the most likely reason. These two groups make up very different percent-ages in the Spine Tango sample and display different mean ages. While Swedish cases are about 6 years younger at the time of surgery, the gender distribution is basically the same. Also, preoperative mean back and leg pain levels are similar, which suggests similar surgical decision making. Further, the analysis of an isthmic versus a degenerative spondylolisthesis group does naturally reveal different findings, especially with regards to age (SWEspine isthmic cases are about 15 years younger compared with Spine Tango degenerative cases), but also to the gender distri-butions. These types of questions could be a future source of collaboration between the various spine registries.
Preoperative pain levels of patients with degenerative lumbar or cervical spinal diseases are relatively similar, but the (very) short-term outcomes we found are not yet as
‘‘Benchmarking project’’ (unpublished) revealed the aforementioned rates. We find the description of MCRC rates informative for surgeons and patients and propose to make them a standard in future outcome reporting. Finally, the radar charts that can be generated from the COMI and its domains are a useful visual aid for discussing options and possible results of surgical and non-surgical spinal interventions and may allow for more informed decision making for patients in the future.
Reporting of follow-up complications from the sur-geons’ and the patients’ perspectives, as possible with the COMI, revealed large differences in complication rates. It is known that surgeons tend to underreport complications, but the considerable differences we found need further investigation. Additional analysis of the bothersomeness of most patient reported complications will probably reveal that most of them were rather light, which may explain why surgeons did not report them at all or why even patients did not report them to their surgeons during fol-low-up. However, it is too early to draw such conclusions and further analyses are doubtlessly needed. As the Swedish pioneers will certainly confirm, developing and implementing a national or international registry is a commendable effort and as the fathers of Spine Tango had predicted ‘‘a decade passes fast’’. 10 years after the first generation of Spine Tango forms, we seem to finally be ready and equipped for our quest for a comprehensive yet feasible outcome measurement and reporting in spine sur-gery. The lessons learnt and experiences gained during those years cannot easily be passed on. Joining and ‘‘doing’’ registries is the best way of understanding the challenges and opportunities of outcome documentation and research.
Conflict of interest None of the authors has any potential conflict of interest.
References