AbstrAct
the response of fluvial systems to tectonic activity and climate change during the Late Pleistocene influenced sedimentary processes and hence the condi-tions of river terraces formation. the northern Alpine foreland is well adapted for such studies due to the high sediment input and the variety of depositional environments. this study focuses on sediments of a part of the rhine river in the area of basel, at the border between switzerland, Germany and France. A detailed evolution of the Lower terrace is inferred from sedimentological, geomorphologic and pedological observations as well as historical documents, and calibrated using different dating methods (optically stimulated lumines-cence, uranium series disequilibrium, radiocarbon). the Lower terrace was
deposited during two periods (30–15 ka and 13–11 ka), which correlate with two cold climatic phases, representing the Last Glaciation of the Alps and the Younger Dryas. these ages underline that main incision of the Lower ter-race braidplain in the area of basel is restricted to post Younger Dryas times, as sediments of that age (13–11 ka) are found atop the highest levels. From then on, a flight of cut-terraces were formed with minor re-accumulation due to Holocene flood events. these findings demonstrate that the surface of a terrace does not always represent the age of sediment aggradation, and this should be remembered when using terraces to reconstruct the tectonic history of an area.
1. Introduction
the river rhine is a major element of the central European drainage system, with headwaters in one of the highest area of Europe, the central and eastern swiss Alps (cf. Preusser 2008). this area, together with large parts of the adjacent swiss Mid-lands, was repeatedly glaciated during the Pleistocene. the gla-ciations generated manifold sediments, including glacifluvial gravels that were deposited in the Hochrhein area. However, despite the use of radiocarbon dating, constrains on the ab-solute ages of the deposits are rather limited, restricting most quantitative approaches. the recent evolution and progresses in luminescence dating (Wallinga et al., 2001; Wallinga, 2002; Preusser et al. 2007) provides a suitable tool to control the tim-ing of accumulation and erosion processes of fluvial deposits.
the study area is located in the rhine valley between the river Aare to the East and the city of Mulhouse to the West, and is located on the territories of switzerland, Germany and France (Fig. 1). It is characterised by several major morphologi-cal terrace levels attributed to the Upper Deckenschotter, the
Lower Deckenschotter, the Upper terrace and the Lower ter-race (Fig. 2). Each of these units shows different sublevels that may either reflect accumulation or cut terraces.
the main geological features of the area are the Jura Moun-tains (mainly limestones and marls) to the south, the black Forest (mainly crystalline and detritals) to the North and the southern Upper rhine Graben (UrG) to the West (detritals and limestones). these structures lay on an ENE–WsW trend-ing Permo-carboniferous trough system that has been proven to be tectonically active (schumacher 2002; Giamboni et al. 2004a, b; Ustaszewski and schmid 2007). In this context, the Lower terrace has been interpreted as a potential indicator of recent tectonic movement (e.g. Haldimann et al. 1984).
the Lower terrace, which is the focus of this study, is com-monly accepted to have been formed during the last glacia-tion as a periglacial braidplain. It lies partly on an older and deeper Pleistocene channel, partly on bedrock. the sediments originate from the modern drainage area of the rhine, i.e. the northern swiss Alps, the swiss Molasse basin, the Jura Moun-tains and the black Forest. the closest terminal moraine ridge
Formation and evolution of the Lower terrace of the rhine river in
the area of basel
S
téphaneK
ocK 1, p
eterh
uggenberger 2, F
ranKp
reuSSer 3p
hilipper
entzel 4& a
ndreaSW
etzel 2Key words: river rhine, fluvial deposits, fluvial terraces, Pleistocene, optical dating, river incision 1661-8726/09/020307-15
DOI 10.1007/s00015-009-1325-1 birkhäuser Verlag, basel, 2009
swiss J. Geosci. 102 (2009) 307–321
1 chemin des rannaux 8, 1296 coppet, switzerland. E-Mail: [email protected]
2 Geologisch-Paläontologisches Institut, Universität basel, bernoullistrasse 32, 4056 basel, switzerland. 3 Institut für Geologie, Universität bern, baltzerstrasse 1 + 3, 3012 bern, switzerland.
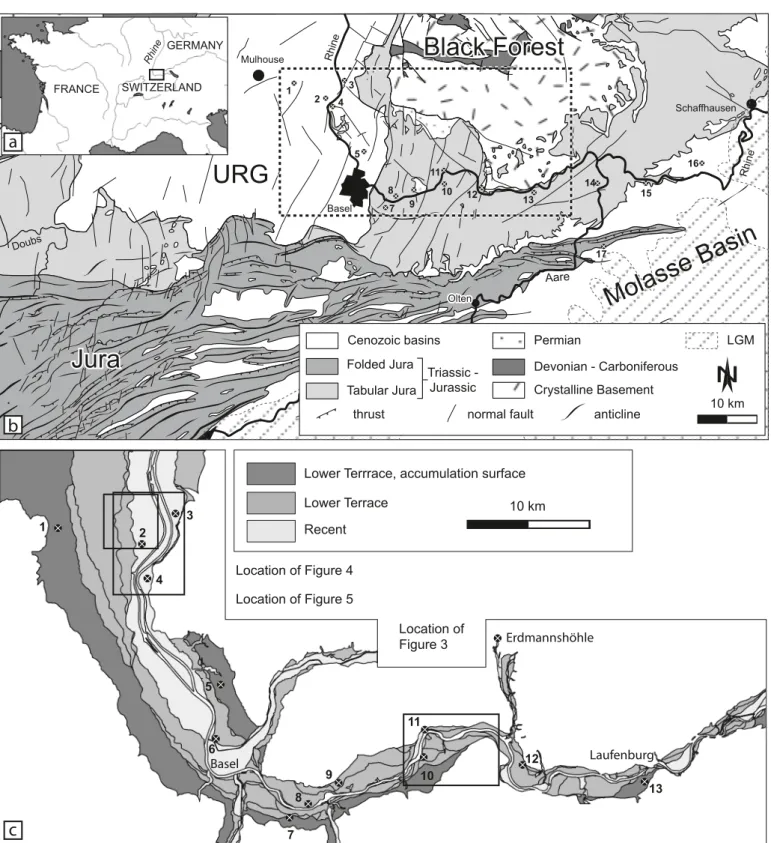
Fig. 1. Geographic and geologic situation. (a) Position of the study area in Western Europe. (b) tectonic map of the study area. UrG: Upper rhine Graben; LGM: extent of ice-covered area during the Last Glacial Maximum. Locations cited in the text: (1) Habsheim; (2) Petit-Landau; (3) bellingen; (4) rheinwei-ler; (5) Haltingen; (6) basel; (7) Muttenz; (8) Wyhlen; (9) Markhof; (10) chleigrüt; (11) tschamberhöhle; (12) Wallbach; (13) chaisterfeld; (14) böttstein; (15) Mellikon; (16) Hüntwangen; (17) birmenstorf; after Ustaszewski and schmid, 2007. (c) Map of the Lower and recent terrace of the river rhine, same location code. Basel Laufenburg 1 3 4 2 5 7 9 10 12 13
Lower Terrrace, accumulation surface Lower Terrace Recent 10 km 6 8 11 Erdmannshöhle Location of Figure 5 Location of Figure 3 Location of Figure 4
URG
Vosges
Vosges
URG
Olten Olten Mulhouse Aare Rhi neMola
sse
Bas
in
Mola
sse
Bas
in
Doubs SchaffhausenBlack Forest
Black Forest
Jura
Jura
Basel Rhi ne 17 16 15 14 13 12 11 10 9 8 7 5 4 3 2 1 10 kmN
Crystalline Basement Devonian - Carboniferous Permian LGM Cenozoic basinsthrust normal fault anticline
Tabular Jura
Folded Jura Triassic -Jurassic FRANCE GERMANY SWITZERLAND Rhin e
a
b
c
of the Last Glaciation is located about 25 km upstream from the eastern boundary of the study area (Fig. 1).
the Lower terrace is a geomorphologic feature that is known from many rivers in central Europe. It was first attrib-uted to the “Würm” ice-age by Penck and brückner (1909) in the Danube catchment and this correlation has been later con-firmed by dating for the rhine and other rivers in Germany (Houben 2003; choi et al. 2007) as well as in switzerland (bit-terli et al. 2000; Preusser et al. 2007). the main sedimentologi-cal processes responsible for the build up of the Lower terrace gravels have been described in siegenthaler & Huggenberger (1993) and Huggenberger & regli (2006): based on sedimen-tological analysis, these authors recognised that both normal conditions and flood events account for sediment accumula-tion. Major flood events in historical times have been reported or documented from Alsace (criqui 1981; Ollive et al. 2006) and the schaffhausen area (Huggenberger et al. 1997). In parts of the study area, the Lower terrace was mapped in detail by Wittmann (1961), who also proposed a classification of seven sublevels: A1, A2, A3, b1, b2, b3 and c, where A1 is the highest and oldest terrace, recognised as an accumulation level, and c is the lowest and youngest level (Fig. 2). the A, b and c ter-races can be differentiated by their soil types: the A terter-races have strongly developed, rubified luvisols on gravel, with a de-calcification depth of about 1 m; the b terraces show brown-ish luvisols, developed mostly on sandy flood plain deposits or rarely on gravel, with decalcification depth up to ca. 50–70 cm; and the c terraces have generally weakly developed cambisols or luvisols (rentzel 1994) with minor decalcification depth. Wittmann (1961) tentatively attributed an early Würmian age to the A group and middle Würmian age to the b group.
In the Hochrhein area, the age of formation of the Lower terrace has been dated by mammoth tusks and bones, found in gravel at the locations of böttstein and Mellikon, to 19,850 ± 150
14c yr bP (23840 ± 470 cal. yr bP) and 20,550 ± 250 14c yr bP
(MbN AG 1998; bitterli et al. 2000). Further upstream from the study area, at Hüntwangen (Fig. 1), optically stimulated
luminescence (OsL) dating yielded ages between ca. 30 and 25 ka, in a location very close to Last Glacial Maximum (LGM) glacier position (Preusser et al., 2007). these OsL ages are con-firmed by radiocarbon ages from the same site. Downstream, in the Middle rhine Area within the up-lifting rhenish Massif, the Lower terrace is divided into two sublevels called older and younger Lower terrace. the age of the two sublevels is well constrained by the presence of Laacher see tephra (12,9 ka) on top of the older sublevel, while it is found reworked in the younger sublevel. choi et al. (2007) reported OsL ages of about 20 ka for the older Lower terrace and could confirm that the younger Lower terrace formed during the Younger Dryas.
some deposits pre- and postdating the deposition of the gravel have also been dated: a mammoth tooth dated
32,350 ± 280 14c yr bP (age beyond recent calibration) was
found in a palaeosol underlying the Lower terrace at birmens-torf, in the Aare catchment area (MbN AG 1998). Overbank deposits and soils formed on the terraces were dated at some locations in basel by radiocarbon and palynology: different wood and organic fragments yielded ages between 2470 ± 100
14c yr bP (2600 ± 200 cal. yr bP, Hauber 1971) and 6160 ± 50
14c yr bP (7120 ± 160 cal. Yr bP) for some b or c levels of the
Lower terrace, and a Dryas III pollen spectrum is reported for a channel fill on top of a A3 level (rentzel 1994).
In this study, we present remote sensing and sedimentologi-cal data as well as some new OsL and radiocarbon ages. based on this data, we constrain the processes and timing that led to the formation of the different levels of the Lower terrace, and make some general observations about the age of terrace sur-faces.
2. Materials and Methods
2.1 Analysis of DEM, historical and aerial imagery
In addition to field observations, high resolution Digital Eleva-tion Model (DEM) images, aerial photographs, historic pictures, Fig. 2. schematic situation without scale of Pleistocene fluvial deposits between the Aare inlet and Mulhouse. the original terrace surfaces of the Lower terrace are generally conserved, being only covered by soils, contrary to the older terraces, which are covered by a thick loess-palaeosol sequences. the enlargement shows the sub-levels classification of Wittmann (1961).
Lower Terrace
(Late Pleistocene - Holocene) after Wittmann (1961)
High Terrace
(Middle -Late Pleistocene) Loess
Lower Deckenschotter (Early-Middle Pleistocene) Higher Deckenschotter
(Late Pliocene-Early Pleistocene)
Rhine Rhine A1 A2 A3 B1 B2 B3 C Accumulation level
maps and paintings have been used, to better constrain the evo-lution of the river regime. the DEM used here is the DtM-AV of swisstopo (swiss Federal Office of topography), with a reso-lution of 2 m, and it covers the swiss and parts of the German but not the French riverside. Different aerial photographs have been collected from open internet sources. An historic map, the German “rheingränz-carte”of 1828, and a painting of Peter birmann (“blick vom Isteiner Klotz, rheinaufwärts gegen ba-sel”, about 1820) have also been taken into account.
2.2 Geochronology
For part of the data set presented here, a detailed description of the applied methodology and experimental backup has been presented in a previous publication in the context of assessing the applicability of uranium series methodology to date car-bonate crusts with gravel (Kock et al. 2009).
2.2.1 Optically stimulated Luminescence (OsL)
suitable sand layers are rare in the mainly coarse Lower ter-race deposits but were found in nine active gravel pits, up to
25 m deep, distributed along the Hochrhein (see Fig. 1 for sites names and location).
Determination of the Equivalent Dose (ED) was performed on quartz separates (100–150 μm) using the sAr protocol of Murray and Wintle (2000, 2003). We used small (2 mm) aliquots to detect differential bleaching of the OsL signal. A preheat of 230 °c for 10 s was used prior to all OsL measurements and the suitability of this procedure was confirmed by dose recovery and thermal transfer tests (cf., Kock et al. 2009). For dating, 48 aliquots were measured for each sample and the majority of those passed through the rejection criteria of the sAr protocol (Murray and Wintle 2000). the positively skewed dose distribu-tions imply differential bleaching of the OsL signal prior to deposition and the method of Preusser et al. (2007) was used to extract mean dose accumulated during burial using.
Determination of dose rate relevant elements (K, th, U) was carried out by high-resolution gamma spectrometry (Preus-ser & Kasper 2001) and no evidence for radioactive disequi-librium in the uranium decay chain has been found. For all samples, mean moisture content during burial of 5–15% was assumed and cosmic dose rate was calculated using present day depth following Prescott and Hutton (1994).
Fig. 3. shaded display of the DtM-AV in the area of rheinfelden (between locations 10 and 11). the braided river topography is well conserved in the forested area. (D) drainage gully; (s) spring brook, formed by backwards erosion due to exfiltering of groundwater. North is to the top. reproduced by permission of swisstopo (bA081589).
D
S
2.2.2 radiocarbon and U/th dating
several wood pieces, whole trunks and stems were found in Holocene sediments from the gravel pit at rheinweiler, featur-ing gravel beds covered by overbank fine sand layer containfeatur-ing wood debris. Preparation and measurements for radiocarbon followed the procedure described by Hajdas et al. (2004).
A sample of stalactite and of stalagmitic floor were taken, and material for U/th measurements was collected from the assumed oldest layers, i.e. the centre, respectively the bottom of the samples. the analytical process for U/th is described in Kock et al. (2009).
3. Results
3.1 Morphological analysis
the shaded display of the DEM turned out to be of high inter-est, since braided river bed topography is often well preserved on forested land, where human influence (ploughing) was neg-ligible. braided patterns with drainage gullies and spring brooks could be recognised in Muttenz, Möhlin and sisseln (Fig. 3).
Of all the aerial photographs that were inspected, only the French IGN set proved useful. On this set, a network of chan-nels was identified along the rhine, north of the village of Petit-Landau (location 2 on Fig. 1). Interestingly, both meandering and braided pattern are visible on those pictures (Fig. 4), the meandering pattern being on the lowest (recent) level, and the braided pattern being on a higher (older) level.
Historic maps (Fig. 5) and the painting from birmann (ca. 1820) show that most of the rhine in the rhine Graben
(down-stream from basel) was braided until the end of the 19th
cen-tury, when the river started to be corrected and controlled by man.
3.2 Sedimentological analysis and datings
the visited outcrops are described from West to East, and their relative position in the classification of Wittmann (1961) is indi-cated. In the several gravel pits that were visited, three different lithofacies were identified: normal braided river deposits, flood deposits and overbank deposits. the OsL ages are given for each outcrop, and are listed in tab. 1 and displayed on Fig. 6. radiocarbon ages are listed in tab. 2.
Fig. 4. Aerial picture of the area between the villages of Petit Landau and Hombourg. On the first third from the left, braided pattern (b) is vis-ible, whereas further to the right, meanders (M) are visible. the arrow and the dashed line show the terrace scarp that separates the two features. North is to the top, the Grand canal d’Alsace (c) and the rhine river (r) are visible in the top right-hand corner. Location is shown on Fig. 1. source: IGN. B M R C 233 m 227 m 250 m
the Habsheim outcrop (location 1 on Fig. 1) is correlated with the A1 level (accumulation level) of the Lower terrace. the gravel pit is under water extraction, which results in lim-ited access to outcrops. the gravel features low density bed-load sheet and pool structures. A sand lens is located less than a metre below the surface of the terrace (with soil cover re-moved). A sample from this sand lens (Hrt 17) yielded an age of 13.2 ± 1.0 ka.
the bellingen outcrop (Fig. 7, location 3 on Fig. 1) is cor-related with the c level of the Lower terrace, located just a few metres above modern rhine level. the bottom part of the 6 m high outcrop shows sand lenses and oblique stratifications. One of the sand lenses has an age of 27.8 ± 2.2 ka (Hrt 13). Above the erosional surface is a 2 m thick massive gravel sheet (or high density bedload sheet; todd 1989) featuring normal grain sorting. the top of the outcrop has been removed. (Fig. 7).
the rheinweiler outcrop (Fig. 8, location 4 on Fig. 1) was a provisory outcrop in spring 2007, and is correlated with the c level of the Lower terrace. Here, the gravel yielded a tree trunk of good size and features cross stratifications and sand lenses. It is covered by overbank deposits. OsL and radiocar-bon dating gave historical ages: a sand lens within the gravel yielded an age of 0.43 ± 0.04 ka (Hrt 16), and the overbank layer gave an age of 0.26 ± 0.02 ka (Hrt 15). radiocarbon
dat-ing of the trunk gave an age of 255 ± 40 14c yr (410 ± 100 cal. Yr
bP, EtH-34581), while an age of 260 ± 50 14c yr (420 ± 100 cal.
yr bP, EtH-34366) was obtained from organic matter within the same sand lens where OsL sample Hrt 16 comes from. Organic matter from the over bank deposit has been dated to
870 ± 60 14c yr (850 ± 110 cal. yr bP, EtH-34367).
Furthermore, a tree stem found in an adjacent gravel pit
was dated to 310 ± 40 14c yr (440 ± 100 cal. yr bP, EtH-34582).
In another adjacent, abandoned gravel pit, the overbank layer gave an age of 0.23 ± 0.02 ka (Hrt 14).
the Haltingen outcrop (Fig. 9, location 5 on Fig. 1) is lo-cated on the A1 level (accumulation level) of the Lower ter-race. the 17 m deep gravel pit mostly features cross-stratifica-tions and pool structures in the lower 12 metres, and gravel sheets are dominant in the upper 5 metres. several sand lenses are present at different levels, three of which were dated to 20.9 ± 1.2 ka (Hrt 7, 15 m below terrace surface), 16.5 ± 1.0 ka (Hrt 8, 12 m below terrace surface) and 11.4 ± 0.7 ka (Hrt 9, 5 m below terrace surface).
the almost 6 m high basel outcrop (Fig. 10, location 6 on Fig. 1) is a low level of the Lower terrace (b3 or c). It features a 1.5 to 2 m thick rhine gravel layer containing several oaks trunks of good size, which is covered by a 2.5 m gravel layer belonging to the Wiese river sediments, a tributary of the rhine that originates in the black Forest. these are topped by over-bank deposits. Pedological and micromorphological investiga-Fig. 5. Part of the historic German “rheingränz-carte” of 1828, showing the area of Petit-Landau (location 2, named Klein Landau on this map). braided river morphology can be clearly seen. the terrace scarp and the abandoned meanders shown on Fig. 4 Petit Landau are also mapped here. bibliothek Geographie, Hydrologie und Völkerkunde, Freiburg i.br., Frei 2: A 3190/06.
1 km
Approximate location of site 3
table 2. s election of relevant 14c ages for organic material found below (1), in (2) and on top (3) of Lower terrace sediment of r iver r hine in the b asel area, sorted after age . t errace codes of W itt
-mann (1961) are given for the overbank deposits
. c
alibration was carried out using Ox
c al 4.0 online ( c . b ronk r amsey
, Oxford) that is based on IN
tc AL04 ( r eimer et al. 2004). Location sample code 14c age (yr b P) c alibrated age (cal. yr b P) Material Host sediment stratigr . position Dated event source Note 17 E t H-17251 32350 ± 280 n.a. Mammoth tooth b uried palaeosol 1 Formation of soil M b N A G (1998) 16 E t H-17255 22190 ± 170 n.a. Mammoth tibia Gravel 2 Accumulation M b N A G (1998) agrees with O sL age 15 UZ-2416 20550 ± 250 24800 ± 700 Mammoth skull Gravel 2 Accumulation b itterli et al. (2000) 14 E t H-17250 19850 ± 150 23840 ± 470 Mammoth tusk Gravel 2 Accumulation M b N A G (2001) close to 6 b asel_98_22_9a 6160 ± 50 7120 ± 160 Organic debris Overbank ( b 3) 3 Abandonment of terrace r entzel (unpubl.) close to 6 b -2195 5860 ± 110 6730 ± 270 W ood debris Gravel 2 Accumulation Hauber (1971) close to 6 b asel_98_1_1 4496 ± 47 5200 ± 170 Organic debris Overbank ( c ) 3 Abandonment of terrace r entzel (unpubl.) 6 E t H-19324 3320 ± 60 3600 ± 150 tree trunk Gravel 2 Flood accumulation schwarz (1998) close to 6 b -2194 2470 ± 100 2600 ± 200 W ood debris Overbank ( c ) 3 Abandonment of terrace Hauber (1971) 4 E t H-34367 870 ± 60 850 ± 110 Organic debris Overbank ( c ) 3 Abandonment of terrace t his study probably reworked 4 E t H-34582 310 ± 40 440 ± 100 tree stem Gravel 2 Accumulation t his study 4 E t H-34366 260 ± 50 420 ± 100* Organic debris sand lens 2 Accumulation t his study agrees with O sL age 4 E t H-34581 255 ± 40 410 ± 100* tree trunk Gravel 2 Accumulation t his study agrees with O sL age * r
adiocarbon age on plateau,
the most likely calibration has been used considering the geological and chronological context.
table
1.
r
esults of dosimetry and luminescence measurement,
and calculated median and model O
sL ages
. s
ee K
ock et al.
(2009) for full details and discussion.
Sample Site Grain size (µm) n K (%) Th (ppm) U (ppm) Wef f (%) Depth (m) D (Gy ka -1) ED Median (Gy) Age Median (ka) ED Modell (Gy) Age Modell (ka) HR T1 Chaisterfeld 149-202 41 0.97 ± 0.02 2.45 ± 0.24 0.91 ± 0.07 10 ± 5 13 1.25 ± 0.07 38.6 ± 2.9 30.8 ± 2.9 25.2 ± 0.5 20.1 ± 1.2 HR T2 Chaisterfeld 149-202 38 1.1 1 ± 0.02 2.92 ± 0.23 1.08 ± 0.06 10 ± 5 9 1.45 ± 0.08 44.1 ± 3.5 30.1 ± 2.9 23.8 ± 1.0 16.2 ± 1.1 HR T3 Chleigrut 149-202 37 0.81 ± 0.02 2.78 ± 0.23 1.01 ± 0.04 10 ± 5 13 1.16 ± 0.06 41.1 ± 2.6 35.5 ± 3.0 30.9 ± 1.0 26.7 ± 1.7 HR T4 Chleigrut 149-202 38 1.16 ± 0.02 2.96 ± 0.22 1.06 ± 0.04 10 ± 5 8 1.51 ± 0.08 47.8 ± 3.2 31.6 ± 2.7 27.7 ± 0.9 18.3 ± 1.1 HR T5 Chleigrut 149-202 39 1.09 ± 0.02 2.55 ± 0.16 0.97 ± 0.03 10 ± 5 4 1.45 ± 0.07 45.6 ± 3.0 31.4 ± 2.6 33.1 ± 0.8 22.8 ± 1.3 HR T6 Markhof 149-202 42 1.02 ± 0.02 2.51 ± 0.21 0.93 ± 0.06 10 ± 5 6 1.35 ± 0.07 30.2 ± 1.8 22.3 ± 1.8 22.8 ± 0.5 16.8 ± 1.0 HR T7 Haltingen 149-202 45 0.89 ± 0.02 3.26 ± 0.19 1.22 ± 0.09 10 ± 5 15 1.30 ± 0.08 43.1 ± 3.0 33.2 ± 3.0 27.2 ± 0.7 20.9 ± 1.2 HR T8 Haltingen 149-202 38 0.78 ± 0.02 2.93 ± 0.18 1.04 ± 0.04 10 ± 5 12 1.15 ± 0.06 34.5 ± 3.8 29.9 ± 3.7 19.0 ± 0.5 16.5 ± 1.0 HR T9 Haltingen 149-202 39 1.32 ± 0.03 4.35 ± 0.27 1.39 ± 0.06 10 ± 5 5 1.85 ± 0.10 40.4 ± 2.5 21.8 ± 1.8 21.2 ± 0.5 11.4 ± 0.7 HR T10 Muttenz 149-202 39 0.76 ± 0.02 3.49 ± 0.18 1.17 ± 0.05 10 ± 5 18 1.18 ± 0.07 43.4 ± 2.3 36.7 ± 2.9 25.0 ± 0.9 21.1 ± 1.4 HR T1 1 Muttenz 149-202 40 1.02 ± 0.02 3.10 ± 0.21 1.16 ± 0.05 10 ± 5 7 1.43 ± 0.08 32.3 ± 1.5 22.5 ± 1.6 17.8 ± 0.7 12.4 ± 0.8 HR T12 W allbach 149-202 37 1.09 ± 0.02 2.88 ± 0.31 1.1 1 ± 0.05 10 ± 5 7 1.47 ± 0.08 47.6 ± 2.2 32.4 ± 2.3 40.4 ± 1.1 27.5 ± 1.7 HR T13 Bellingen 150-200 37 1.58 ± 0.08 4.90 ± 0.12 1.32 ± 0.10 10 ± 5 3.5 2.10 ± 0.17 138.8 ± 10.9 66.0 ± 7.4 58.5 ± 0.6 27.8 ± 2.2 HR T14 Rheinweiler 150-200 39 1.12 ± 0.03 2.87 ± 0.07 0.87 ± 0.06 10 ± 5 0.5 1.52 ± 0.12 1.66 ± 0.24 1.1 ± 0.2 0.35 ± 0.01 0.23 ± 0.02 HR T15 Rheinweiler 150-200 38 1.06 ± 0.05 3.96 ± 0.10 1.56 ± 0.07 10 ± 5 2.0 1.65 ± 0.10 1.71 ± 0.31 1.0 ± 0.2 0.43 ± 0.02 0.26 ± 0.02 HR T16 Rheinweiler 150-200 41 1.18 ± 0.06 2.61 ± 0.07 0.89 ± 0.07 10 ± 5 3.0 1.51 ± 0.12 1.16 ± 0.26 0.76 ± 0.18 0.65 ± 0.03 0.43 ± 0.04 HR T17 Habsheim 150-200 40 1.16 ± 0.04 4.43 ± 0.1 1 1.58 ± 0.10 10 ± 5 0.6 1.84 ± 0.13 33.0 ± 2.3 18.0 ± 1.8 24.3 ± 0.6 13.2 ± 1.0
Age Model assumes 7.5 % scatter from lab reproducibility and 15 % scatter from microdosimetry (= 16.8 % total scatter) for samp
les HR
T1-13 and HR
T 17. For HR
T14-16 21 % scatter in reproducibility have been identifi
ed (due to low counting statistics), which results in an overal
l
scatter of 25.8 %.
Tab. 1
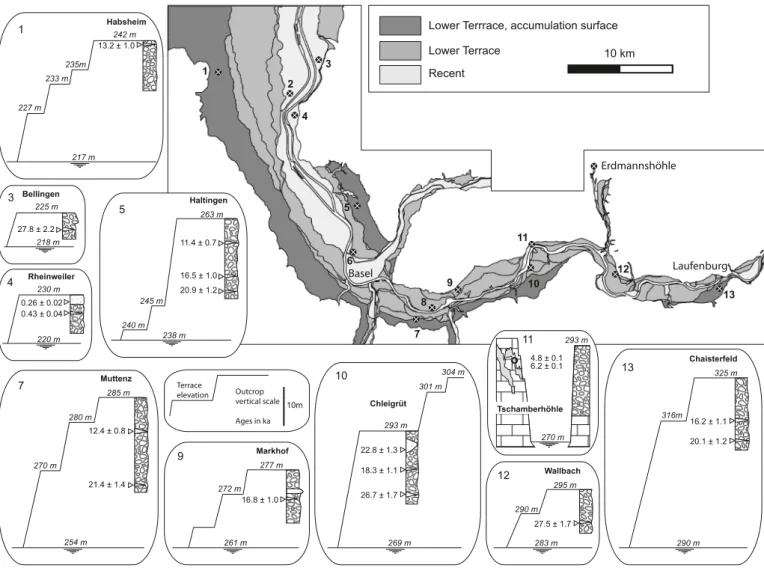
Age Model assumes 7.5% scatter from lab reproducibility and 15% scatter from micro dosimetry (= 16.8% total scatter) for samples HR T1-13 and HR T 17. For HR T14-16 21 % scatter in reproducibility have beenFig. 6. synthetic map showing the distribution of outcrops, and the vertical distribution within each outcrop of samples with their age. Locations 1–7, 9 and 10 show OsL ages from sand lenses or layer, and their height above modern rhine level. the stratigraphic log represents the available outcrop (depth of the gravel pit), and the stepped plain line represents the different terrace levels in the area of the outcrop. Location 11 is a cave. U/th ages of speleothems are shown on a cross-section across the rhine, as well as the position of the samples with respect to the closest terrace (Lower terrace) and the modern rhine level (more details in Fig. 16 tschamberhöhle). Altitudes are given in metre a.m.s.l.
Basel Laufenburg 1 3 4 2 5 7 9 10 12 13 Lower Terrrace, accumulation surface
Lower Terrace Recent 10 km 6 8 11 Erdmannshöhle 293 m Tschamberhöhle 4.8 ± 0.1 6.2 ± 0.1 270 m 11 277 m 261 m Markhof 16.8 ± 1.0 272 m 285 m 254 m 21.4 ± 1.4 12.4 ± 0.8 Muttenz 280 m 270 m 293 m 269 m Chleigrüt 26.7 ± 1.7 18.3 ± 1.1 22.8 ± 1.3 301 m 304 m 295 m 283 m 27.5 ± 1.7 Wallbach 290 m 325 m 290 m Chaisterfeld 20.1 ± 1.2 16.2 ± 1.1 316m 263 m 238 m 11.4 ± 0.7 16.5 ± 1.0 20.9 ± 1.2 Haltingen 245 m 240 m 218 m 225 m Bellingen 27.8 ± 2.2 220 m 230 m Rheinweiler 0.26 ± 0.02 0.43 ± 0.04 217 m 242 m Habsheim 13.2 ± 1.0 227 m 233 m 235m 1 3 4 5 7 9 10 12 10m Outcrop vertical scale Ages in ka 13 Terrace elevation
Fig. 7. bellingen outcrop showing normal braided river deposits covered by a high density bedload sheet with normal grain sorting. the hole in the sand lens is the sampling site of Hrt 13 (scale bar is 2 m).
tion revealed the presence of a cambisol on top of the basal rhine gravel. A second buried cambisol can be found on top of Wiese gravel, followed by a hydromorphic luvisol overprint-ing the fine grained Wiese deposits directly beneath a modern dump. Ground Penetrating radar (GPr) sections clearly show pool structures below the outcrop level. the tree accumulation may have been caused by lateral erosion of long established islands.
the Muttenz outcrop (location 7 on Fig. 1) is a 20 m deep gravel pit in the A1 terrace. It mostly features pool structures in the lower 16 m, and gravel sheets are dominant in the upper 4 m. several sand lenses are present at different levels, two of which were dated to 21.4 ± 1.4 ka (Hrt 10, 18 m below terrace surface) and 12.4 ± 0.8 ka (Hrt 11, 7 m below terrace surface). the caracteristic soil type under forest can be classified as rube-fied luvisol with a bleached eluvial horizon and a pronounced, clayey bt-horizon with strongly weathered gravel. the base of the reddish bt-horizon is around 1 m below the actual surface.
the Wyhlen outcrop (Fig. 11, location 8 on Fig. 1) is a c level of the Lower terrace. the 4 m high outcrop features, as in bellingen, different layers of normal braided river sediments
with foresets and sand lenses at the bottom, covered by a 2 m thick high density bedload sheet containing cobbles up to 50 cm long. However, the texture of the high density bedload sheet contrasts with that of bellingen as it has no grain sorting but imbricated pebbles. the top of the outcrop has been removed.
the Markhof outcrop (Fig. 12, location 9 on Fig. 1) is an 11 m deep gravel pit in the b1 level. the lower 8 m show pool structures with extensive, sometimes well cemented sand lenses, and the upper 3 m is constituted of a massive gravel sheet. A clear erosive surface separates the two parts. An OsL sample (Hrt 6) taken 6 m below terrace surface yielded an age of 16.8 ± 1.0 ka.
the chleigrüt outcrop (Fig. 13, location 10 on Fig. 1) is a 14 m deep gravel pit in the A3 terrace. It mostly features pool structures in the lower 11 m, and gravel sheets are dominant in the upper 3 m. several sand lenses are present at different levels, three of which were dated to 26.7 ± 1.7 ka (Hrt 3, 13 m below terrace surface), 18.3 ± 1.1 ka (Hrt 4, 8 m below terrace surface) and 22.8 ± 1.3 ka (Hrt 5, 4 m below terrace surface).
the Wallbach outcrop (Fig. 14, location 12 on Fig. 1) is an 8 m deep gravel pit correlated with the b3 level. It features pool structures in the lower 7 m, with sand lenses. Above an erosion surface, the upper metre is a massive gravel sheet with normal grain sorting and with coarse pebbles at the base (up to 40 cm). A sand lens gave an age of 27.5 ± 1.7 ka (Hrt 12, 7 m below terrace surface).
the 15 m high chaisterfeld outcrop (Fig. 15, location 13 on Fig. 1) is correlated with the A1 level of the Lower terrace. It features mostly normal braided river sediments, with pools structures and sand lenses, but some thin layers of coarser peb-bles are relicts of high density bedload sheets that have been subsequently reworked. two OsL samples were taken here and yielded ages of 20.1 ± 1.2 ka (Hrt 1, 13 m below terrace sur-face) and 16.2 ± 1.1 ka (Hrt 2, 9 m below terrace sursur-face).
to better constrain the incision phase, two samples of speleo-thems were taken for U/th dating from a cave (the tschamber-höhle, location 11 on Fig. 1) that is located at a similar altitude as the Lower terrace and clearly connected to the rhine river (Fig. 16). the cave develops in the Middle triassic Muschelkalk limestone and consists of a single tube branching downstream into a higher tube and a siphon. It follows a low gradient, and the section of the tube indicates formation during a phreatic phase (elliptic section) and a subsequent vadose phase (“canyon” at the base of the elliptic section). the main tube is still occupied by a stream that prevents speleothem growth. However, the higher tube, from which the stream was shortcut by the siphon, has become dry and several kinds of speleothem are present. the U/th ages obtained are 4.8 ± 0.1 ka and 6.2 ± 0.1 ka. 4. Discussion
4.1 Formation of terraces
Field data and morphological observations give a good impres-sion of the terrace forming processes in the areas. Different Fig. 8. rheinweiler outcrop: the normal braided river deposits contain a tree
trunk, and are capped by overbank deposits. sampling locations for OsL and
14c are shown.
man-made dirt scarp
overbank gravel sand lens
rubble HRT 16: 0.43 ± 0.04 kyr trunk
ETH-34366: 420 ± 100 cal. yr BP
ETH-34581 410 ± 100 cal. yr BP HRT 15: 0.43 ± 0.04 kyr ETH-34367 850 ± 110 cal. yr BP
Fig. 9. Haltingen outcrop showing cross-stratifications and low density bed-load sheets (scale bar is 2 m).
sedimentary structures, such as pools (Fig. 13) and low den-sity bedload sheets were formed during periods of normal water discharge, and high density bedload sheets (massive gravel sheets) formed during flood events. However, the low and high density bedload sheets tend to be reworked during
later pool formation and are thus much less frequently pre-served than pool structures (Huggenberger and regli, 2006). the occurrence of an eroded high density bedload sheets can nevertheless be indicated by a concentration of coarse pebbles (Fig. 15).
Fig. 10. (a) the basel outcrop features a rhine gravel layer (r) containing an accumulation of tree stems (in front of the excavator). they are overprinted by a cambisol and covered by gravel and overbank deposits from the Wiese river (W), a local tributary of the rhine. both layers of the Wiese show evidence of soil formation. (b) Nor-mal braided river deposits can be recognised be-low the outcrop level on a GPr profile. (c) Detail of the stratigraphy showing the succession of flu-vial deposits and buried soils. the oak trunk has an age of 3320 ± 60 14c yr (3600 ± 150 cal. yr bP)
schwarz, 1998. (d) An accumulation of trees of such importance can be formed when a forested island is laterally eroded. (georadar data: Pul-seEkko 100, 100 MHz antennae, 0,25 m steps)
a b W R W R W W c d Modern dump Wiese overbank deposits with luvisol Wiese gravel with cambisol Rhine gravel with cambisol Oak trunks
Fig. 11. Picture of the Wyhlen outcrop. Normal braided river deposits are visible at the base, with sand lenses and cross-stratifications. these are covered by a high density bedload sheet with imbricated pebbles and occurrence of boulders. the top of the outcrop has been removed (scale bar is 2 m).
A morphological terrace is formed when a part of a flood plain is abandoned by active channels in an erosional context (base level fall). the base level, which controls erosion, is con-trolled for each river portion by the altitude of the downstream bedrock threshold, and therefore each portion can have a dif-ferent erosional history, some even accommodating sediment while other become eroded.
Due to base level fall, the higher surfaces become inactive, except during extreme flood events, when the water level rises high enough to cover it again, and possibly bring more sediment (flood deposits) on top of it. towards the end of a flood event, hydraulic conditions become progressively normal as water discharges and water level decreases, and the top of the flood deposit is reworked into normal braided river deposits.
How-ever, this reworking is short lived, because the normal level of the river is then lower than these deposits, and they are quickly abandoned. During this phase, drainage gullies and spring brooks are formed by the evacuation of groundwater (Fig. 3). these are the shapes that are most likely to be conserved on the surface of the terrace. An annual or seasonal flood event is then able to shape the riser of the terrace by lateral erosion. Lateral erosion can be enhanced by high groundwater discharge or by the presence of a tributary.
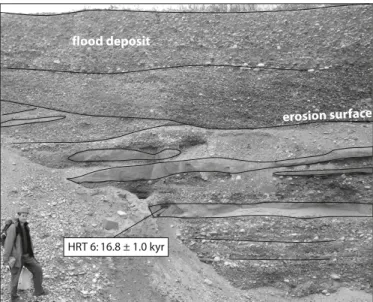
Fig. 12. Markhof outcrop. Normal braided river sediments (below) are eroded by a complex flood deposit (above). OsL sampling site is indicated.
HRT 6: 16.8 ± 1.0 kyr
erosion surface
flood deposit
Fig. 13. Part of the chleigrüt outcrop showing a pool structure filled with sand (scale bar is 2 m).
HRT 5: 22.8 ± 1.3 kyr
Fig. 14. Wallbach outcrop showing pool structure (below) and flood deposit above. the dark horizon in the flood deposit is manganese precipitation (scale bar is 2 m).
erosion surface
Fig. 15. chaisterfeld outcrop showing low density gravel sheets, pool structures and relicts of flood deposits (indicated by arrows, scale bar is 2 m). the scheme shows how the relicts are interpreted.
Trough migration
Trough migration 1
2
4.2 Geochronology
A summary of the results of OsL dating are listed in table 1 and displayed on the map (Fig. 6). Ages decrease upward within particular outcrops, as to be expected from a typical aggrada-tion setting, but there is no correlaaggrada-tion between the OsL age of the sediment body and the assumed age of the terrace sur-faces, which decrease downward with elevation. An overview of the calculated ages (Fig. 17) shows that eleven ages (Hrt 1–8, 10, 12 and 13) fall within the period 30–15 ka, thus in the time considered to represent full glacial conditions in the swiss lowlands (Preusser 2004). the lower limit of this period is given by the end of the last Middle Würmian Interstadial, that ended at about 31 ka ago and was followed soon after by the advance of Alpine glaciers into the lowlands (e.g. Preusser et al., 2003, 2007). the upper limit is the beginning of the Late Glacial Interstadial (bølling-Allerød), which according to Litt et al. (2003) started at about 14.5 ka ago. three other samples (Hrt 9, 11 and17) fall in the Younger Dryas chronozone, the last cold period prior to the Holocene warming, and finally, three OsL samples (Hrt 14–16) fall into historical times. the radiocar-bon ages from rheinweiler all gave historic ages, which are consistent with OsL ages from the same locality, and with the
fact that this area was still an active river bed in the 19th
cen-tury (Fig. 5). However, other radiocarbon dating from over-bank deposits on the b3 and c sublevels yielded ages between
6160 ± 50 14c yr bP (7120 ± 160 cal. yr bP) and 2470 ± 100 14c
yr bP (2600 ± 200 cal. yr bP, tab. 2).
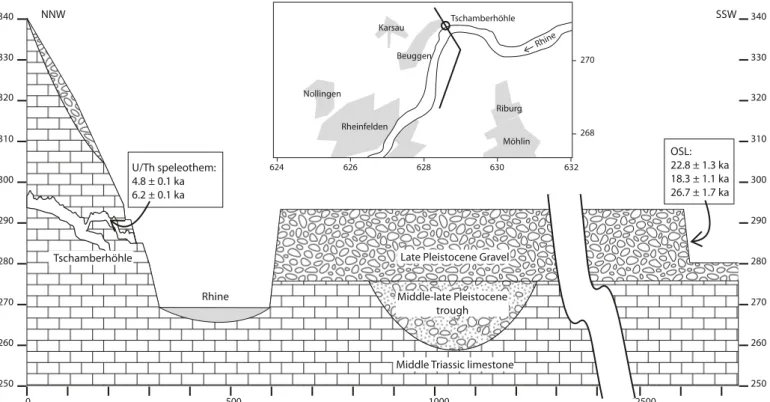
Fig. 16. cross-section showing the position of the tschamberhöhle (cave) relative to the Lower terrace. Location is shown on Fig. 1. the OsL ages indicated are those of chleigrüt (location 10).
260 250 270 280 290 300 310 330 320 340 0 500 1000 1500 NNW Middle-late Pleistocene trough Late Pleistocene Gravel
Middle Triassic limestone Tschamberhöhle Rhine 260 250 270 280 290 300 310 330 320 340 2500 SSW U/Th speleothem: 4.8 ± 0.1 ka 6.2 ± 0.1 ka OSL: 22.8 ± 1.3 ka 18.3 ± 1.1 ka 26.7 ± 1.7 ka 270 268 632 630 628 626 624 Möhlin Riburg Rheinfelden Beuggen Nollingen Karsau Rhine Tschamberhöhle
Fig. 17. Plot of OsL ages for the different sites investigated. OsL ages fall into three cluster correlating with the Last Glacial Maximum, the Younger Dryas and historical times, respectively.
two ages of 4.8 ± 0.1 ka and 6.2 ± 0.1 ka were obtained from two different speleothems from tschamberhöhle (Fig. 16). spe-leothems can start growing only when vadose conditions are established; hence the ages can be regarded as minimal age of the lowering of the water table below the cave. the water table must have been lower than the cave at least once before the Late Glacial, since a nearby Middle Pleistocene fluvial trough indicates that the base level was then several metres lower than the modern river bed, but we use the hypothesis that the cave was formed during the same time as the Lower terrace because the speleothems and the network of the tschamberhöhle are very little developed, in contrast with the older Erdmannshöhle cave, which developed in the same lithologic unit (Middle tri-assic Muschelkalk limestone) and in the same area, and where the speleothems are abundant and well developed, and the net-work much more complex (Piepjohn 1995).
4.3 Aggradation-erosion chronology
OsL ages from the Hochrhein indicate aggradation between ca. 30 ka and 11 ka. the base of Lower terrace is dated in
bir-menstorf, outside the study area, to 32350 ± 280 14c yr bP (age
beyond recent calibration) using a mammoth tooth found in a palaeosol predating gravel deposition (MbN AG 1998).
Up-stream of the study area, at Hüntwangen, Huggenberger et al. (1997) and Preusser et al. (2007) document incision up to 30 m within a short time span in the rafz terrace, attributed to an early phase of the last glaciation, before the Hüntwangen ter-race (dated by Preusser et al. 2007, between about 30 to 25 ka) was deposited (location 16 on Fig. 1). thus, it appears that the onset of accumulation coincides with the beginning of the last glaciation, and the end with the termination of the Younger Dryas (Fig. 18).
Although erosion phases most probably occurred during this time, aggradation must have been dominant until 11 ka, since sediments of that age are found atop the highest levels of the Lower terrace (Fig. 6). A pause in the aggradation or an erosion phase may be documented by the absence of ages be-tween 25 and 23 ka, and bebe-tween 16 and 13 ka, although much more data would be needed to prove this (Fig. 17). significant incision could hence have started only after 11 ka, as also in-dicated by the Holocene U-th ages of speleothems (Fig. 16). the terraces were formed by incision of the river rhine and afterwards covered by overbank sediments during the Holo-cene, which were conserved due to the general lowering of the water level. Palynological data and radiocarbon ages (tab. 2), as well as archaeological investigations indicate that the differ-ent sub-levels were covered by overbank deposits and subse-Fig. 18. (a) reconstitution of the evolution of the Lower terrace in the area of basel: gravels started accumulating before 27 ka, and accumulation went on until 12 ka, although some small erosion phases may have happened during this time, that are not documented. the highest accumulation level is thus reached at 12 ka. then, erosion became dominant and terrace formation began. the water level was located below the level of the tschamberhöhle at 6 ka. (b) Late Pleistocene and Holocene climatic stages are given for reference, compiled after Litt et al. (2003) and bos et al. (2008).
Onset of gravel accumulation
Maximal accumulation level (A1) Incision and
terrace formation (and formation of the Tschamberhöhle) End of interstadial, soil formation 20 25 30 35 0 5 10 15 (ka) Rhine A1 A2 A3 B1 B2 B3 C 10 8 6 4 2 12 14 16 18 La te Pl en ig la ci al H o lo ce n e La te G la ci al O. Dryas Y. Dryas Preboreal Allerød Bølling Cal.Yr. BP Y. Dryas (OSL) Y. Dryas (pollen) Atlantic (radiocarbon and snails) Subboreal (radiocarbon and archaeology) Boreal Atlantic Subboreal Accumulation goes on a b
quently affected by soil formation from the Younger Dryas (A3 level) onwards to the subboreal (rentzel 1994 and ref. therein). the chronology of aggradation and erosion presented here is in contrast to previous theories, in which the accumulation of the highest terrace level was assumed to be much older (e.g. about 45 ka in Wittmann 1961). the bellingen outcrop (Fig. 7) highlights the fact that the age of the terrace sediment should not be taken for the age of the terrace surface (morphologic feature). Indeed, the terrace surface is less than 200 years old (it is still part of the river bed on the “rheingränz-carte”), while the sediment located about two metres below the surface has an age of about 27 ka (Hrt 13), i.e. the oldest of our samples. this is what would be expected from a normal stratigraphic situation, where the oldest sediment is located at the base of the formation. However, the high density bedload sheet lying on top of the dated sediment is probably much younger, as its conservation and position on top of the terrace implies no subsequent deposition and therefore deposition only after the main aggradation and incision events.
the highest level of the Lower terrace (accumulation sur-face) is approximately 30 m higher than present rhine level. the Lower terrace was thus incised by about 30 m within not more than 12 ka, which represents a mean incision rate of
2.5 mm yr–1. However, incision was most probably irregular and
distributed on a series of exceptional events, as terraces have been shown to form very quickly (born and ritter 1970). 4.4 River regime
recently, Late Glacial to Holocene changes in European river dynamics has been connected to changes in climatic conditions (Kasse et al., 1995; Andres et al., 2001; Houben 2003; Litt et al. 2003; braillard & Guélat 2008, and ref. therein). these studies showed that meandering rivers dominated by incision and fine-grained overbank deposition prevailed during warmer phases (bølling-Allerød, Holocene), whereas braided rivers and coarse sediments were common during colder phases (Late Plenigla-cial, Younger Dryas). In the present case, no evidence for a meandering phase during the Late Glacial could be found and such flow regimes are known from the Holocene only (Fig. 4) (cf., rentzel 1994). Overbank deposits and soils are located on top of the different sub-levels, thus correlating with the onset of boreal and Atlantic. However, it is known that the part of the rhine located downstream of basel was braided in historical
times (until the 19th century and before the correction of the
river, Fig. 5). clearly, climate is not the sole controlling factor of river regime in the basel area and other factors are possibly human factor (e.g. deforestation), regional slope and width of the river bed, the latter two of which may be in turn controlled by recent tectonic movements.
5. Conclusion
A terrace formation process has been described, where flood events are important agents of terrace building, their eroding
effects as well as their accumulation effects. A precise aggrada-tion-erosion history has been proposed for the Lower terrace in the area of basel, where the gravel input is correlated with the LGM, and the main change from aggradation-dominated to erosion-dominated conditions occurs at the end of the Younger Dryas, after which all the cut-terraces of the Lower terrace were formed. It has been shown that sediment ages should not be used as cut-terrace ages in a geomorphological view, since their respective ages are actually inversely correlated. Only the age of the accumulation surface is comparable with that of its highest (youngest) sediments. the age of a cut-terrace can be rather obtained by dating overbank deposits. this study also il-lustrates the fact that karstic features and historical documents are useful tools to constrain the sedimentological history of a river.
Acknowledgments
the authors wish to thank the NAGrA (swiss National cooperative for the Disposal of radioactive Waste) who provided the DEM and the Archäolo-gische bodenforschung basel-stadt. Gamma spectrometry for the lumines-cence dating was carried out by J. Lomax at Geographisches Institut, Uni-versität zu Köln, and the radiocarbon dating was performed by I. Hajdas, Institut for Particle Physics, EtH Zürich. Jan Kramers (Institut für Geologie, Universität bern) is thanked for the U/th dating, Lucia Wick for comments concerning pollen analysis. the authors are grateful to the companies for giv-ing access to their gravel pits, sometimes even givgiv-ing a hand with their excava-tor. s.K. acknowledges financial support from the Freiwillige Akademische Gesellschaft of basel.
rEFErENcEs
Andres, W., bos, J.A.A., Houben, P., Kalis, A.J., Nolte, s., rittweger, H. & Wunderlich, J. 2001: Environmental change and fluvial activity during the Younger Dryas in central Germany. Quaternary International 79, 89–100.
birmann, P. ca. 1820: blick vom Isteiner Klotz rheinaufwärts gegen basel. Oil on canvas, Kunstmuseum basel, birmann collection 1859, inv. 71. bitterli, t., Graf, H.r., Matousek, F. & Wanner, M. 2000: blatt 1050 Zurzach. born, s.M. & ritter, D.F. 1970: Modern terrace Development Near Pyramid
Lake, Nevada, and its Geologic Implications. GsA bulletin 81, 1233– 1242.
bos, J.A.A., Dambeck, r., Kalis, A.J., schweizer, A. & thiemeyer, H. 2008: Palaeoenvironmental changes and vegetation history of the northern Upper rhine Graben (southwestern Germany) since the Lateglacial. Netherlands Journal of Geosciences – Geologie en Mijnbouw 87, 67– 90.
braillard, L. & Guélat, M. 2008: Une nappe alluviale étagée du Pléistocène supérieur dans la vallée de Délémont (Jura suisse): lithostratigraphie et datations. Quaternaire 19, 217–228.
choi, s.-W., Preusser, F. & radtke, U. 2007: Dating of lower terrace sediments from the Middle rhine area, Germany. Quaternary Geochronology 2, 137–142.
criqui, G. 1981: Le régime hydraulique, les crues et les inondations du rhin. Une histoire du rhin. Ayçoberry, P. & Ferro, M. Paris, ramsay: 317–336. Giamboni, M.E., Ustaszewski, K., schmid, s.M., schumacher, M.E. &
Wet-zel, A. 2004a: Plio-Pleistocene transpressional reactivation of Paleozoic and Paleogene structures in the rhine-bresse transform zone (northern switzerland and eastern France. International Journal of Earth sciences 93, 207–223.
Giamboni, M.E., Wetzel, A., Nivière, b. & schumacher, M.E. 2004b: Plio-Pleistocene folding in the southern rhinegraben recorded by the
evolu-tion of the drainage network (sundgau area; northwestern switzerland and France). Eclogae geologicae Helvetiae. 97, 17–31.
Hajdas, I., bonani, G., thut, H., Leone, G., Pfenninger, r. & Maden, c. 2004: A report on sample Preparation at the EtH/PsI AMs Facility in Zurich. Nuclear Instruments & Methods in Physics research section b-beam Interactions with Materials and Atoms 223–224, 267–271.
Haldimann, P., Naef, H. & schmassmann, H. 1984: Fluviatile Erosions- und Akkumulations-formen als Indizien jungpleistozäner und holozäner be-wegungen in der Nordschweiz und angrenzenden Gebieten. Nagra tech-nischer bericht, 84–16.
Hauber, L. 1971: Das Alter des rhein- und Wiesenbettes beim Eglisee in basel. regio basiliensis XII, 316–319.
Houben, P. 2003: spatio-temporally variable response of fluvial systems to Late Pleistocene climate change: a case study from central Germany. Quaternary science reviews 22, 2125–2140.
Huggenberger, P. & regli, c. 2006: A sedimentological model to characterize braided river deposits for hydrogeological application. braided rivers. sambrook smith, G.H., best, J.L., bristow, c.s. & Petts, G.E., Interna-tional Association of sedimentologists 36, 51–74.
Huggenberger, P., siegenthaler, c. & Aigner, t. 1997: Quaternary fluvial sedi-mentation in northern switzerland and southern Germany: an integrated approach of sedimentological analysis and ultra-high resolution geophys-ical techniques. Gaea heidelbergensis 4, 141–157.
Kasse, K., Vandenberghe, J. & bohncke, s. 1995: climatic change and fluvial dynamics of the Mass during the Late Weichselian and Early Holocene. In: Frenzel, b., Vandenberghe, J., Kasse, K., bohncke, s., Gläser, b. (Eds.): European river Activity and climatic change During the Lateglacial and Early Holocene. Fischer, stuttgart, 123–150.
Kock, s., Kramers, J.D., Preusser, F. & Wetzel, A. 2009: Dating of Late Pleisto-cene terrace deposits of the river rhine using uranium series and lumi-nescence methods: potential and limitations. Quaternary Geochronology. doi:10.1016/j.quageo.2009.04.002
Lambert, J., Winter, t., Dewez, t., J., b. & sabourault, P. 2005: New hypotheses on the maximum damage area of the 1356 basel earthquake (switzer-land). Quaternary science reviews 24, 383–401.
Litt, t., schmincke, H.-U. & Kromer, b. 2003: Environmental response to cli-matic and volcanic events in central Europe during the Weichselian Late-glacial. Quaternary science reviews 22, 7–32.
MbN AG, 1998: Zur stratigraphie des jüngeren Pleistozäns im Gebiet des Zusammenflusses von Aare, surb, rhein und Wutach. bericht G819b z. Hd. Landeshydrologie und -geologie, bern
Murray, A.s. & Wintle, A.G. 2000: Luminescence dating of quartz using an improved single-aliquot regenerative-dose protocol. radiation Measure-ments 32, 57–73.
Murray, A.s. & Wintle, A.G. 2003: the single aliquot regenerative dose pro-tocol: potential for improvements in reliability. radiation Measurements 37, 377–381.
Ollive, V., Petit, c., Garcia, J.-P. & reddé, M. 2006: rhine flood deposits re-corded in the Gallo-roman site of Oedenburg (Haut-rhin, France). Qua-ternary International 150, 28–40.
Penck, A. & brückner, E. 1909: Die Alpen im Eiszeitalter. Leipzig, tauchnitz. Piepjohn, K. 1995: Die Erdmannshöhle bei Hasel (südbaden) und die Abhän-gigkeit ihrer Entwicklung von den quartären Klima-Ereignissen. Müns-tersche Forschungen zur Geologie und Paläontologie. 77, 155–171. Prescott, J.r. & Hutton, J.t. 1994: cosmic ray contributions to dose rates for
luminescence and Esr dating: Large depths and long-term time varia-tions. radiation Measurements 23, 497–500.
Preusser, F. 2004: towards a chronology of the Late Pleistocene in the north-ern Alpine Foreland. boreas 33, 195–210.
Preusser, F. 2008: characterisation and evolution of the river rhine system. Netherlands Journal of Geosciences – Geologie en Mijnbouw 87, 7–19. Preusser, F. & Kasper, H.U. 2001: comparison of dose rate determination
us-ing high-resolution gamma spectrometry and inductively coupled plasma mass spectrometry. Ancient tL 19, 19–23.
Preusser, F., blei, A., Graf, H.r. & schlüchter, c. 2007: Luminescence dating of Würmian (Weichselian) proglacial sediments from switzerland: meth-odological aspects and stratigraphical conclusions. boreas 36, 1–13. Preusser, F., Geyh, M.A. & schlüchter, c. 2003: timing of Late Pleistocene
climate change in lowland switzerland. Quaternary science reviews 22, 1435–1445.
reimer, P.J., baillie, M.G.L., bard, E., bayliss, A., beck, J.W., bertrand, c. J.H., blackwell, P.G., buck, c.E., burr, G.s., cutler, K.b., Damon, P.E., Edwards, r.L., Fairbanks, r.G., Friedrich, M., Guilderson, t.P., Hogg, A.G., Hugen, K.A., Kromer, b., Mccormac, G., Manning, s., ramsey, c.b., reimer, r.W., remmele, s., souhton, J.r., stuiver, M., talamo, s., taylor, F.W., van der Plicht, J. & Weyhenmeyer, c.E. 2004: Intcal04 ter-restrial radiocarbon age calibration, 0–26 cal kyr bP. radiocarbon 46, 1029–1058.
rentzel, P. 1994: Geologisch-bodenkundliche Untersuchungen an den Nie-derterrassenfeldern bei basel unter besonderer berücksichtigung der spätlatènezeitlichen Fundstelle basel-Gasfabrik. Jahresbericht Archäolo-gische bodenforschung des Kanton basel-stadt 1994, 31–52.
schmid, E. 1950: Die geologische Einordnung der Fundstelle des urnenfelder-zeitlichen Helms von Weil am rhein. Jahresbericht und Mitteilung des oberrheinischen geologischen Vereins, NF 32, 50, 128–134
schumacher, M.E. 2002: Upper rhine Graben: role of preexisting structures during rift evolution. tectonics 21, 6-1–6-17.
schwarz, P.-A. 1998: tätigkeitsbericht der Archäologischen bodenforschung basel-stadt für das Jahr 1998. Jahresbericht Archäologische bodenfor-schung des Kanton basel-stadt 1998, 67.
siegenthaler, c. & Huggenberger, P. 1993: Pleistocene rhine gravel: depos-its of a braided river system with dominant pool preservation. best, J.L. & bristow, c.s., (Eds.): braided rivers. Geological society. 75: 147–162.
todd, s.P. 1989: stream-driven, high-density gravelly traction carpets: pos-sible deposits in the trabeg conglomerate Formation, sW Ireland and some theoretical considerations of their origin. sedimentology 36, 513– 530.
Ustaszewski, K. & schmid, s., M. 2007: Latest Pliocene to recent thick-skinned tectonics at the Upper rhine Graben – Jura Mountains junction. swiss Journal of Geosciences 100, 293–312.
Wallinga, J. 2002: Optically stimulated luminescence dating of fluvial deposits: a review. boreas 31, 303–322.
Wallinga, J., Murray, A.s., Duller, G.A.t. & törnqvist, t.E. 2001: testing opti-cally stimulated luminescence dating of sand-sized quartz and feldspar from fluvial deposits. Earth and Planetary science Letters 193, 617–630. Wittmann, O. 1961: Die Niederterrassenfelder im Umkreis von basel und
ihre kartographische Darstellung. basler beiträge zur Geographie und Ethnologie 3, 46.
Manuscript received July 2, 2008 revision accepted May 11, 2009 Published Online first september 5, 2009 Editorial Handling: J. Kuhlemann & s. bucher