INSTRUMENTS AND TECHNIQUES
Calcium indicator loading of neurons using single-cell
electroporation
Thomas Nevian&Fritjof Helmchen
Received: 12 September 2005 / Revised: 15 January 2007 / Accepted: 12 February 2007 / Published online: 2 March 2007
# Springer-Verlag 2007
Abstract Studies of subcellular Ca2+ signaling rely on methods for labeling cells with fluorescent Ca2+ indicator dyes. In this study, we demonstrate the use of single-cell electroporation for Ca2+ indicator loading of individual neurons and small neuronal networks in rat neocortex in vitro and in vivo. Brief voltage pulses were delivered through glass pipettes positioned close to target cells. This approach resulted in reliable and rapid (within seconds) loading of somata and subsequent complete labeling of dendritic and axonal arborizations. By using simultaneous whole-cell recordings in brain slices, we directly addressed the effect of electroporation on neurons. Cell viability was high (about 85%) with recovery from the membrane permeabilization occurring within a minute. Electrical properties of recovered cells were indistinguishable before and after electroporation. In addition, Ca2+transients with normal appearance could be evoked in dendrites, spines, and axonal boutons of electroporated cells. Using negative-stains of somata, targeted single-cell electroporation was equally applicable in vivo. We conclude that
electropora-tion is a simple approach that permits Ca2+ indicator loading of multiple cells with low background staining within a short amount of time, which makes it especially well suited for functional imaging of subcellular Ca2+ dynamics in small neuronal networks.
Keywords Two-photon microscopy . Neocortex . Neural network . Dendrite . Synapse
Introduction
Ca2+ is an important second messenger for a variety of intracellular signaling cascades [3,57]. The spatiotemporal dynamics of the intracellular Ca2+ concentration can be reported by functional Ca2+-sensitive fluorescent indicators [17], which can be loaded into cells by a number of techniques. Individual cells can be filled via intracellular recording electrodes or patch pipettes [2,11]. Application of the membrane-permeable AM-ester form of calcium indicators permits loading of cell populations in vitro [49, 58] and in vivo [1, 5, 59]. Further techniques include in vivo injection of dextran-conjugated fluorescent Ca2+ indicators with subsequent uptake and antero- or retrograde transport [31, 46], biolistic delivery of dye-coated beads [12, 28] and expression of genetically encoded Ca2+ indicators [20]. All these labeling methods have advantages and disadvantages. Intracellular loading for example results in a highly specific staining with low background, which is ideal for measurements from subcellular compartments such as dendritic spines or presynaptic terminals; however, this technique is laborious and rarely used for filling more than one cell. Population loading techniques on the other hand are either relatively unspecific or result in a diffuse
T. Nevian
:
F. Helmchen Abteilung Zellphysiologie,Max-Planck-Institut für medizinische Forschung, Jahnstr. 29, 69120 Heidelberg, Germany Present address:
T. Nevian (*)
Institut für Physiologie, Universität Bern, Bühlplatz 5, 3012 Bern, Switzerland e-mail: [email protected] Present address:
F. Helmchen
Abteilung Neurophysiologie, Institut für Hirnforschung, Universität Zürich,
background, preventing resolution of subcellular compart-ments [27]. A simple technique for rapid Ca2+ indicator loading of small networks of neurons with low background is therefore highly desirable.
Electroporation has been widely used for the delivery of DNA, RNA, proteins, and fluorescent indicators to cells in suspensions, dissociated cultures, brain slice cultures, and recently also in vivo [18,25,51,52,63]. The application of a strong electromagnetic field above the dielectric break-down threshold of lipid membranes results in the transient formation of small pores [7, 30], which close within seconds [56]. In addition to diffusive exchange, charged molecules are transported in the direction of the electro-chemical gradient during the opening of the pores, thereby facilitating loading of the cell. Typically, electroporation has been applied in a bulk-fashion using rather large electrodes. With this approach, populations of neurons in hippocampal slice cultures and mouse spinal cord have been loaded with Ca2+indicators [4,63]. More recently, several studies used thin glass pipettes for focused delivery of dyes or genes to individual cells in brain slices [52] and in vivo [18].
In this study, we demonstrate the use of targeted single-cell electroporation for loading neurons with fluorescent Ca2+indicators in acute brain slices and in vivo. We show that this technique allows rapid filling of small groups of visually identified neurons with high cell viability. We monitored the electroporation process directly using simul-taneous whole-cell recording. Functional imaging of Ca2+ transients was used to measure network activity for an extended period of time. We propose single-cell electro-poration as a complementary method to both intracellular loading of individual neurons and population loading with AM-ester dyes, enabling the examination of subcellular Ca2+signals in small neuronal networks.
Materials and methods
Slice preparation Sagittal brain slices were prepared from 13- to 15-day-old (P13–15) Wistar rats. All experimental procedures were in accordance with the animal welfare guidelines of the Max–Planck Society. Briefly, the rat was decapitated and one hemisphere of the brain was quickly removed. The hemisphere was glued with the cut face onto a tilted (∼20°) stage of a tissue slicer and submerged in ice-cold extracellular solution. Discarding the upper 1-mm of the brain, 300μm thick slices were cut and stored at room temperature before recording. The extracellular solution contained 125 mM NaCl, 25 mM NaHCO3, 2.5 mM KCl,
1.25 mM NaH2PO4, 1 mM MgCl2, 25 mM glucose, and
2 mM CaCl2, bubbled with 95% O2 and 5% CO2. All
experiments were performed at physiological temperatures (34–36°C).
Electrophysiology Patch pipettes (3–5 MΩ tip resistance) were filled with 130 mM K-gluconate, 4 mM NaCl, 10 mM Na–gluconate, 10 mM Na–phosphocreatine, 10 mM HEPES, 4 mM ATP–Mg, and 0.3 mM GTP. Neurons were visualized using IR gradient contrast video microscopy [10, 60]. Voltage recordings were made in the whole-cell configuration with a patch-clamp amplifier (Axoclamp-2A, Axon Instruments, Foster City, CA, USA) operated in current clamp mode. Voltage signals were filtered at 3 kHz and digitized at 10 kHz by an AD-converter (ITC-16, Instrutech, Port Washington, NY, USA). Extracellular stimulation sequences were generated with a stimulation isolation unit (HG203, Hi-Med, UK) connected to pipettes filled with extracellular solution. Brief 100-μs current pulses of variable amplitude were used for stimulation. Two-photon microscopy Two-photon-excited fluorescence was generated with a titanium-sapphire laser system (Mira 900 pumped with a 5-W Verdi, Coherent, Santa Clara, CA). Laser pulses of 180 fs at 76 MHz and a wavelength of 820 nm were used. A resonant confocal scanning unit (TCS-SP2 RS, Leica Microsystems, Mannheim, Germany) was attached to an upright microscope (DMLFS, Leica), equipped with a 40× objective (HCX APO W40× UVI, NA 0.8, Leica). Nondescanned detectors were placed behind the objective and below the condensor for maximal fluores-cence detection. Red and green fluoresfluores-cence signals were separated using a dichroic mirror (560DCXR, AHF Analysentechnik, Tübingen, Germany) and corresponding bandpass filters (HQ520/25 and HQ585/40, AHF). An additional photomultiplier was placed behind a Dodt gradient contrast tube collecting the forward-scattered IR light of the laser [67]. This IR-scanning gradient contrast (IR-SGC) image could be visualized and overlayed with the fluorescence channels online allowing instantaneous visu-alization of the electroporation process [52]. The frame trigger of the scanner was used to synchronize line scan measurements and electrophysiological recordings.
Raw fluorescence F(t) was derived from line scans by integrating the fluorescence in regions of interest (ROI) enclosing the fluorescent structures. Each time point was the average of 16 lines resulting in a temporal resolution of 2 ms per line. Background FB was derived from a region
devoid of fluorescent structures and resting fluorescence F0
was determined as the mean fluorescence during 50 ms before stimulation. Relative fluorescence changes were calculated from ΔF/F(t)=(F(t)−F0)/(F0−FB). In
experi-ments, in which cells were simultaneously loaded with the red Ca2+-insensitive dye Alexa-594 and the Ca2+-sensitive dye Oregon Green BAPTA-1, fluorescence changes were expressed as ΔG/R(t)=(G(t)−G0)/Rave, where G0 is the
mean resting green fluorescence during 50 ms before stimulation. The Ca2+-insensitive red fluorescence Rave
was calculated as the mean over the entire time course of the line-scan recording. Full-frame time series were recorded at 1.7 frames/s.
Electroporation Borosilicate pipettes with a tip diameter of 1μm (5–7 MΩ) were filled with different Ca2+indicators (dissolved in water or extracellular solution) and mounted onto an electrode holder attached to a micromanipulator (Luigs&Neumann, Ratingen, Germany). The Ca2+ indica-tors Oregon Green Bapta-1 (OGB-1, 1 mM, Molecular Probes, Eugene, OR), Rhodamine-2 (Rhod-2, 1 mM) or Fluo-4 (1 mM) were used. The green Ca2+indicators were sometimes mixed with Alexa 594 (500μM). Pipettes were the same as used for patch-clamp experiments. Voltage pulses for electroporation were generated with a stimulation isolation unit (HG203) triggered by a TTL pulse from an ITC-16 board controlled by Igor Pro (Wavemetrics, Lake Oswego, OR, USA) running on a PowerMac. The pipette was placed close to the cell under visual control using the IR channel of the two-photon microscope. Single square voltage pulses of 10 ms duration and an amplitude of 10– 15 V were sufficient to load cells with the Ca2+indicator. The same pipette could be used for electroporating multiple cells. Minimal positive pressure (0–5 mbar) was applied to the pipette.
In vivo experiments Animal preparation was performed as described previously [66]. In brief, 3- to 4-week-old rats were anaesthetized with urethane (1–2 g/kg) and a small (2×2 mm) craniotomy was opened above somatosensory cortex. The dura was removed and the cranial window was covered with agar (1–1.5%, type III-A, Sigma) in the following solution (in mM): 135 NaCl; 5.4 KCl; 1 MgCl2; 1.8 CaCl2; 5 HEPES. Electroporation pipettes were inserted through the agar and through layer 1 of neocortex with positive pressure applied (300 mbar). In vivo two-photon imaging was performed using a custom-built two-photon laser-scanning microscope equipped with a 40× water-immersion objective lens (0.8 NA; Zeiss, Jena, Germany; [66]).
In vivo electroporation was performed using one of two methods. First, we modified an amplifier headstage (HS-2A gain ×0.1; Axon Instruments) by incorporating a relais switch (DR-5 1N4148; SDS) to enable switching between electrical recording and voltage stimulation. Using this headstage, a pipette was inserted into neocortical layer 2 and stepped forward in 2-μm steps with slight positive pressure (30 mbar) applied. The current response to a voltage test pulse was continuously monitored similar to the approach for obtaining in vivo whole-cell recordings [38]. Pressure was released and the headstage was switched for application of an electroporation pulse once an increase in tip resistance was observed.
As a second alternative approach for in vivo electro-poration, we used positioning of the pipette tip under visual control using the two-photon microscope. After insertion of a pipette into layer 2/3, brief pressure pulses were applied to the pipette tip to eject small amounts of dye and to produce a local stain of the extracellular space. This extracellular stain caused cell bodies to appear as negatively stained objects, which then could be targeted with the electroporation pipette, guided by the two-photon fluores-cence image [39]. This approach permitted gentle position-ing of the pipette tip close to a particular cell under in vivo conditions.
Results
Single-cell electroporation with Ca2+indicator in brain slices
Individual neocortical pyramidal neurons in acute rat brain slices were electroporated using glass pipettes (5–7 MΩ tip resistance) filled with a relatively high (0.5–1 mM) concentration of a fluorescent Ca2+indicator (see “ Materi-als and methods” for details). Neurons located 30–160 μm below the slice surface were targeted under visual control using the infrared-transmission channel of a two-photon microscope (Fig.1a). After positioning the pipette close to the cell, brief voltage pulses to the pipette caused electro-poration of the cell as indicated by rapid dye uptake (Fig. 1a). The time course of indicator loading was quantified using time-lapse imaging during the electro-poration procedure. After the electroelectro-poration pulse, fluo-rescence rapidly increased in the soma and the proximal dendrite, reaching a plateau level within a few seconds (Fig.1b). The average loading time constant, derived from an exponential fit to the OGB-1 fluorescence increase in the soma, was 1.3±1.0 s (n=8; mean±SD). Because of the high extracellular Ca2+concentration, the recorded fluorescence mainly corresponded to Ca2+-bound OGB-1 molecules. As a control, we also measured the loading time constant with the Ca2+-insensitive dye Alexa 594, yielding a time constant of 0.8±0.4 s (n=3; not significantly different from the OGB-1 derived time constant; p>0.4; unpaired t test). After initial loading, the somatic Alexa 594 fluorescence decreased (to about 80%) on a longer time scale of minutes while fluorescence increased in more distal regions of the dendritic tree, indicating diffusional equilibration of the indicator dye throughout the cytoplasm.
We determined the exact position for successful loading of a targeted cell by sequentially stepping towards the soma in 1 μm steps and delivering an electroporation pulse at each position. We found that positioning of the pipette in
close proximity to the cell membrane was crucial for successful filling with a mean distance of 0.2 μm and a half-width of 3.2 μm (n=15, Fig. 1c). Alignment to the maximal distance for successful loading of each cell, showed that a difference in position <1 μm determined targeted delivery of the dye (Fig. 1d). Larger distances between pipette and cell resulted in extracellular dye ejection without filling the targeted cell. The tip resistance of the electroporation pipette increased slightly by 20±4%, while approaching the cell, indicating physical proximity to the somatic membrane [38].
Amplitude and duration of the electroporation voltage pulse were varied over a range of settings. Individual square pulses with amplitudes of at least 5 V and durations between 5–40 ms resulted in dye loading. Multiple pulses (up to six) delivered at <0.1 Hz enhanced loading, but single square pulses of 15 V amplitude and 10 ms duration resulted in adequate filling for morphological visualization and detection of Ca2+ transients and were subsequently used. The polarity of the voltage pulse depended on the indicator dye used. Negative pulses (relative to the bath electrode) were required for electroporation of Oregon
Fig. 1 Ca2+ indicator loading of neurons using single-cell electro-poration. a Time-lapse series of single-cell electroporation of a layer 2/3 pyramidal neuron with the Ca2+ indicator OGB-1. The fluores-cence channel is overlayed with the simultaneously acquired IR-transmission image. Images were taken at intervals of 280 ms. The schematic drawing in the first frame illustrates the experimental setup. Between the first and second frame, the electroporation pulse (single pulse,−15 V, 10 ms) was delivered. Dye concentration in the pipette was 1 mM. The boxes in the last frame indicate the regions of interest in which raw fluorescence was averaged for the fluorescence traces in b. b Fluorescence traces during electroporation demonstrate fast loading with OGB-1. The electroporation pulse resulted in an exponential increase in fluorescence, which reflects the increase in the concentration of OGB-1 bound to Ca2+. The soma (green trace), the proximal apical dendrite (purple), and the basal dendrites (pink) were filled within seconds without any detectable increase in background fluorescence (black) indicating targeted delivery of the Ca2+indicator. Color codes correspond to the ROIs depicted in a. The ROI close to the tip of the electroporation pipette (green) showed a
steep increase in fluorescence, with a subsequent slow decay. The “overshoot” reflected the fast delivery of the dye due to the electroporation pulse. The decay corresponded to diffusional equili-bration of the dye in the soma. c Distribution of distances for successful loading of cells (n=15). The solid red line represents a Gaussian fit to the data, yielding a mean distance for successful electroporation from the soma of 0.2μm and a half-width of 3.2 μm. Note, that in only a few cases the membrane had to be indented (negative distances from the soma, n=3). d Normalized fluorescence in the soma of the targeted cell (upper graph) and normalized tip resistance of the electroporation pipette (lower graph) plotted against the distance from the soma, aligned to the point of successful electroporation (defined as a significant increase in fluorescence in the soma; **p<0.01, paired t test, n=15). The upper graph reveals that successful electroporation is determined by the exact positioning of the pipette. While approaching a cell, the tip resistance increased, on average, by 20% (n=15). e Maximum intensity projection of a fluorescence stack of three cells after sequential loading with OGB-1 within less than 3 min
Green BAPTA-1 (OGB-1) and Fluo-4, while the red fluorescent indicator Rhod-2 required positive voltage pulses. The same electroporation pipette could be used several times without a reduction in success rate. Because the electroporation procedure is simple and fast, multiple cells could be loaded within a few minutes using the same pipette (Fig.1e).
Evoked Ca2+transients after single-cell electroporation
Next, we examined if Ca2+transients could be evoked in cells electroporated with Ca2+ indicator. In a group of labeled cells, dendritic arbors were clearly distinguishable allowing fluorescence recordings from individual dendritic compartments (Fig.2). Antidromic extracellular stimulation resulted in transient fluorescence increases in the proximal dendrites with a sharp rise and an exponential decay, similar to action potential (AP)-evoked Ca2+ transients (Fig. 2). Ca2+transients displayed an all-or-none behavior with constant amplitudes for successive trials once a threshold of stimulation intensity was crossed, consistent with single-AP induced Ca2+ influx. Fluorescence tran-sients could be evoked in 90±10% of the electroporated neurons per slice (51 out of 56 cells in 10 slices). For OGB-1 loaded layer 2/3 pyramidal neurons the mean amplitude and time constant, measured in the proximal apical dendrite, were 80±30% ΔF/F and 269±190 ms, respec-tively (n=7). Trains of Ca2+ transients could reliably be
evoked by trains of stimulation pulses (Fig. 2). In several cells, Ca2+transients could be evoked even after 3–5 h after electroporation (n=10), suggesting that long-term experi-ments are feasible using this loading technique.
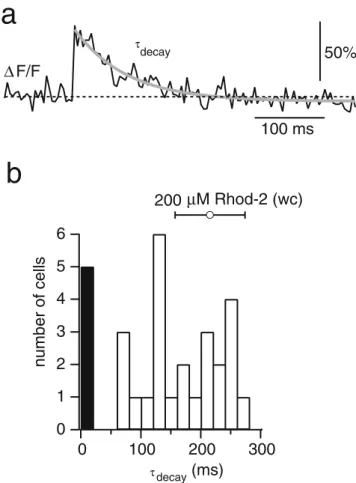
The decay time constant of AP-evoked Ca2+ transients directly relates to the concentration of the indicator dye [21] and therefore can be used to estimate the final concentration of Ca2+ indicator dye after electroporation (Fig. 3). Layer 2/3 pyramidal neurons were electroporated with Rhod-2 (1 mM). Antidromically evoked single Ca2+transients were recorded in the proximal apical dendrite 30–50 μm from the soma after waiting at least 20 min for diffusional equilibration of the dye. A single exponential curve was fit to the fluorescence decay (Fig. 3a). Decay time constants ranged between 71 and 276 ms, with a mean of 170±64 ms (n = 25), indicating that the loading efficiency for a stereotyped single electroporation pulse was variable (Fig.3b). In 5 out of 30 neurons (≈17%) no Ca2+transients could be evoked. This distribution of decay time constants was compared to the decay time constants measured in control whole-cell recordings with a known Rhod-2 concentration of 200 μM. In these recordings, single AP-evoked Ca2+ transients decayed with a time constants of 218±58 ms (n=4), yielding an estimate of 50 to 250 μM for the final dye concentration in the electroporation experiments. Consistent with this estimate, fluorescence intensities of cells were similar after electroporation and after loading with 200μM Rhod-2 via a patch pipette.
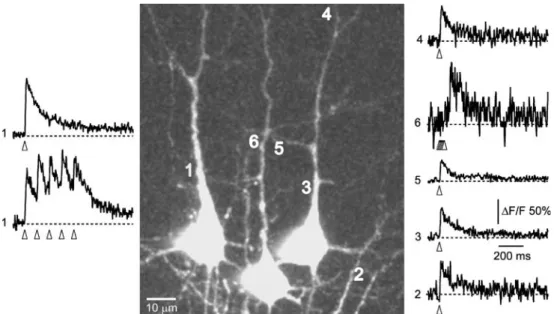
Fig. 2 Ca2+ transients evoked by antidromic stimulation. Dendritic Ca2+ transients in a group of three pyramidal neurons filled
sequentially with OGB-1 by electroporation with the same pipette. Ca2+transients indicating AP generation were evoked sequentially by
local extracellular stimulation (10–20 μA, 100 μs) close to the cells initial axon segments. Open arrowheads indicate time of stimulation. Numbers indicate the position and sequence of the line scan record-ings. Traces at position 1 were recorded with the stimulation pipette
close to the left cell. The upper trace shows the response to a single stimulus. The lower trace corresponds to a train of five pulses at 10 Hz. Traces 2–5 were sequentially recorded in the right cell, with the stimulation pipette close to its initial axon segment. Trace 6 was recorded from the cell in the middle, which responded with a delayed Ca2+transient to a train of five pulses at 100 Hz delivered to the right
cell presumably through synaptic rather than direct antidromic stimulation
Assessing cell viability from simultaneous whole-cell recordings
The dielectric breakdown of the lipid bilayer during electro-poration might irreversibly perturb normal cell functioning. Pores are formed, which are nonselectively permeable to small molecules and ions [15, 62]. This results in the breakdown of the membrane potential [7], which may only recover after pores have resealed. Although the ability to evoke dendritic Ca2+ transients in electroporated cells indicated functional recovery, we were interested in further investigating the viability of electroporated cells. For establishing electroporation as a routine filling method for Ca2+ indicators, it is important to rule out potential alterations of cellular properties by the electroporation procedure. We therefore assessed cell viability after electro-poration in more detail using several approaches.
First, electrical properties were compared in whole-cell recordings from electroporated and nonelectroporated layer 2/3 pyramidal neurons. No significant differences were found for resting membrane potential and for AP amplitude and half width (resting membrane potential −70±4 and −71±5 mV, p>0.6; amplitude 105±11 and 114±5 mV, p> 0.1; half width, 1.3±0.3 and 1.1±0.2, p>0.2; n=7 and n=4; unpaired t tests).
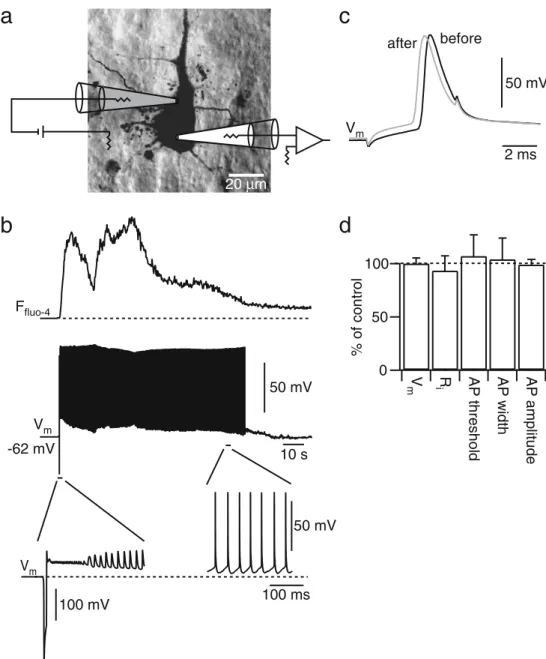
Second, the electrical response to electroporation was studied directly in layer 5 pyramidal neurons. After establishing a whole-cell current-clamp recording from a layer 5 neuron, this cell was electroporated at the soma using a second pipette (Fig.4a). During electroporation, the membrane potential followed the time course of the applied voltage pulse. Directly after the electroporation pulse, the membrane voltage was on average−15±6 mV (n=4). This value is in agreement with the reversal potential of −21.4 mV calculated from the Goldmann equation assum-ing free diffusion of Na+, K+, Ca2+, and Cl− through nonselective pores. In this case, permeabilities can be substituted by the diffusion coefficients of the ions (all in μm2
/s, DNa=1,330, DK=1,960, DCa=790, and DCl=2,040,
[8]). After the end of the electroporation pulse, the membrane potential started to recover and electrical activity resumed. Small-amplitude APs were generated during the first hundred milliseconds. Presumably pores were still partially open at this time and Na+ channels slowly recovered from inactivation. Upon further repolarization, more APs of larger amplitude and at high frequency were generated. Subsequently, the rate of AP firing decreased until it ceased and a normal resting membrane potential was established (Fig.4b). In 14 simultaneous whole-cell record-ings, the recovery period lasted between 5 and 140 s (mean 64±42 s). The final resting membrane potential was not different from the initial membrane potential (−64±4 mV, before,−63±4 mV, after, n=14, p>0.9, paired t test). Also, single APs elicited by somatic current injection before electroporation and after recovery were similar (Fig. 4c,d). Peak AP amplitudes were 108±8 mV before and 107± 7 mV after electroporation (n=14, p>0.3). AP widths were 1.5±0.5 ms before and after electroporation (p>0.8). AP threshold was also not affected (−36±15 mV before, −37± 13 mV after). Finally, no significant change in input resistance was found (140±50 MΩ before, 130±45 MΩ after, p>0.2, n=6).
Consistent with the breakdown of the membrane potential and its subsequent recovery, large fluorescence signals of the Ca2+ indicator were observed immediately after electroporation (Fig.4b). In the late phase of recovery these fluorescence signals reflected the frequency of action potentials generated [21], suggesting AP-evoked Ca2+ influx. Eventually, the Ca2+concentration settled to a basal level in parallel with the recovery of the membrane potential.
a
decay τ(ms)
number of cells
6
5
4
3
2
1
0
300
200
100
0
200 µM Rhod-2 (wc)
100 ms
50%
decay τb
F/F
∆
Fig. 3 Dye concentration after electroporation. a Fluorescence Ca2+ transient recorded in the proximal apical dendrite of a layer 2/3 pyra-midal neuron electroporated with Rhod-2. The transient was evoked by extracellular stimulation near the axon. The solid grey line is a single exponential fit to the decay of the transient yielding the decay time constantτdecay. b Distribution of Ca2+transient decay time constants measured in the proximal apical dendrites of pyramidal neurons in layer 2/3 filled with Rhod-2 (n=30). The black bar represents the cells in which no Ca2+transients could be elicited. The open circle is the
decay time constant (mean±SD) measured in pyramidal neurons filled with 200μM of Rhod-2 during whole-cell (wc) recordings (n=4)
Overall, 13 out of the 14 cells examined with simultaneous whole-cell recording recovered from the electroporation pulse, giving an estimate of 93% viability in this set of experiments. Only one cell remained at a depolarized potential of−15 mV. In some cells (n=9), multiple
electro-porations were performed after the membrane potential had recovered. Five out of 9 cells survived subsequent electro-porations. One cell could even be electroporated seven times. Recovery times for this cell for additional electroporations were similar to the initial recovery time (∼50 s).
50 mV 2 ms Vm before after
c
b
-62 mV 50 mV 10 s Ffluo-4 Vm 100 ms 100 mV 50 mV Vma
d
20 µm 100 50 0 % of control V m iR AP threshol d AP width AP amplitudeFig. 4 Membrane potential recovery after electroporation. a Illustra-tion of the recording configuraIllustra-tion in a layer 5 pyramidal neuron to assess the neuronal response during electroporation. The electro-poration pipette is shown in grey and the recording pipette in white. The cell was loaded with Fluo-4 (1 mM) and Alexa 594 (0.5 mM). b Fluorescence signal (Fluo-4, upper trace) and simultaneously acquired whole-cell current clamp recording (middle trace) during electroporation. Dashed line in the upper trace indicates preelectropo-ration background fluorescence. The cell fired a sustained train of APs with decreasing frequency after the electroporation pulse and recovered within 90 s back to the initial resting membrane potential. The lower trace to the left is a blow up of the membrane potential
during and directly after the electroporation pulse. Note the different voltage scale for this trace. The dotted line indicates the resting membrane potential of the cell at−62 mV. The lower right trace is a blow up of the membrane potential to the end of the spike train. c The waveforms of the APs evoked by somatic current injection before (black trace) and after recovery (grey trace) were similar. d Quantification of the effect of electroporation on passive membrane and AP properties. Membrane potential, input resistance, AP threshold, AP width, and AP amplitude after the electroporation pulse were normalized to the corresponding control values. None of the parameters showed a significant change (paired t test, p>0.5, n=6–14)
Pre- and postsynaptic Ca2+imaging in electroporated cells
The above experiments demonstrate that single-cell electro-poration is a simple and efficient method for loading neurons with Ca2+ indicator with high cell viability. This loading technique should therefore be particularly useful to
label small groups of neurons and measure Ca2+signals in various subcellular compartments. To demonstrate this we applied single-cell electroporation to measure Ca2+ tran-sients at individual synaptic contacts.
Firstly, we colabelled several layer 2/3 pyramidal neurons with OGB-1 and Alexa 594. An extracellular
Fig. 5 Ca2+transients evoked by synaptic stimulation. a Maximum projection of layer 2/3 pyramidal neurons simultaneously filled with OGB-1 and Alexa 594. The boxes indicate the positions of active spines. An extracellular stimulation pipette was sequentially placed close to these regions. b High magnification images of dendritic spines in the boxes in a. Dashed lines show the linescan position covering the spine head and the adjacent dendrite. Black and grey traces correspond to Ca2+transients in the spine head and the adjacent dendritic shaft. Subthreshold stimulations (left traces) show a clear increase in fluorescence in the spine heads but not in the adjacent dendritic shafts. Suprathreshold stimulation (right traces) results in correspondingly larger Ca2+transients in the spine heads and dendritic
shafts. c Peak Ca2+transient amplitudes (ΔG/R) evoked by
subthresh-old stimulation in the spine heads plotted against the peak Ca2+
transient amplitudes measured in the adjacent dendritic shaft. All data points fall below the unity line (black, dashed) and below the line (ΔG/R)max, dendrite=0.1 (grey, dashed) indicating compartmentalized
Ca2+ signaling. d Suprathreshold stimulation results in an increased peak Ca2+transient amplitude in the spine head and in the dendritic shaft. The grey, dashed line corresponds to (ΔG/R)max, dendrite=0.1.
e Sub- and suprathreshold peak Ca2+transient amplitudes measured in the spine heads are linearly correlated (linear regression, solid black line, r=0.77)
stimulation pipette was placed close to a dendrite at different positions along the dendritic tree of the labeled cells (Fig.5a). Brief extracellular current pulses (100μs, 3– 15 μA, average 8.2±3.9 μA) resulted in synaptically evoked Ca2+transients in single spines that were restricted to single spine heads (Fig.5b). The peak amplitude in the spine head was 0.12±0.06 (mean ΔG/R) as compared to 0.02±0.02 in the adjacent dendritic shaft (p<0.01, n=15, paired t test). Increasing the stimulation intensity (on average by a factor of 1.7±0.4 to 12.8±4.0μA) resulted in much larger spine Ca2+ transients and clear Ca2+ transient in the adjacent dendritic shaft (Fig. 5b,d). The peak Ca2+transient amplitude in the spine was larger than in the dendrite (0.32±0.16 in the spine head as compared to 0.23±0.12 in the dendritic shaft, p<0.01, n=15). The peak amplitudes in the spine heads evoked by sub- and supra-threshold stimulation were linearly related (Fig.5e; corre-lation coefficient r=0.77), indicating that the EPSP-evoked Ca2+ signal determines the suprathreshold Ca2+ dynamics [42], presumably by different numbers of NMDA receptors in the spine heads [41,43].
Secondly, we performed simultaneous pre- and postsyn-aptic Ca2+ imaging at a connection between a pyramidal neuron and a bitufted inhibitory interneuron in cortical layer 2/3 [26] (Fig.6a). The bitufted interneuron was filled with OGB-1 (green) and several pyramidal neurons in close vicinity were filled with the Ca2+ indicator Rhod-2 (red). The axons of the pyramidal neurons were followed and line scan recordings of Ca2+ transients were performed at putative synaptic contacts. Stimulation of the axon of the pyramidal neuron evoked a stereotyped Ca2+ transient in the presynaptic bouton (Fig. 6b,c). In contrast, the transients recorded in the postsynaptic spine responded with Ca2+ transients in 4 out of 12 trials (Fig. 6b,c). Therefore, failures in synaptic transmission were clearly distinguishable from successes in synaptic transmission. These results demonstrated that synaptic transmission between connected pairs of electroporated neurons was still intact and that Ca2+ dynamics can be measured in small neuronal compartments like boutons and spines.
In vivo single-cell electroporation with Ca2+indicator
Previous studies demonstrated single-cell electroporation of fluorescent dyes and DNA in vivo [19]. In vivo loading of single cells with Ca2+ indicator has so far relied on dye loading through intracellular patch pipettes [22,23,61]. We examined whether single-cell electroporation can be used as an alternative method for in vivo loading and for subsequent functional measurements. Individual cells in the neocortex of anesthetized rats were electroporated using one of two methods. First, a blind approach similar to traditional in vivo whole-cell recording techniques [38] was
used for single-cell electroporation. A patch pipette was inserted in the brain and stepwise pushed forward while constantly monitoring the tip resistance using a current test pulse. Once a presumed cell was encountered, as indicated by an increase in resistance, a custom-built switch in the amplifier headstage permitted delivery of the electropora-tion pulse through the same pipette (Fig.7a). Although we were able to load cells using this approach, the rate of success was rather low presumably because the position of the pipette relative to the cell was not well defined.
As an alternative method, we therefore used a pure optical approach that relied on visualization of both the pipette tip and the cell of interest with the two-photon microscope. After insertion of the pipette into the brain, we briefly (for a few seconds) applied positive pressure (100– 300 mbar) to the pipette causing a local extracellular stain (“negative stain”), so that unstained cell somata could be clearly identified (Fig. 7b). The pipette tip could then be gently positioned close to a cell body under visual control before the electroporation pulse was delivered. This targeted approach was similar to our procedure in the brain slice experiments and analogous to two-photon guided targeted patching (TPTP) that has been demonstrated in vivo [39]. Using fluorescence-guided targeted electropora-tion, we reliably labelled cells and several neurons could be loaded rapidly (Fig. 7c). In addition, spontaneous Ca2+ transients of normal appearance were found in the apical dendrites of several pyramidal neurons (Fig.7d), indicating that neurons had recovered from the electroporation procedure similar to the cells in brain slices.
Discussion
We have characterized single-cell electroporation as an alternative method to load neurons with Ca2+indicator dyes in vitro and in vivo. Compared to other loading techinques single-cell electroporation has the advantage of rapid and selective loading of multiple cells with low background staining, enabling measurements of subcellular Ca2+ dy-namics in dendrites, spine heads, and presynaptic terminals within a labelled network.
Electroporation has been widely used for the introduc-tion of DNA, RNA, proteins, peptides, dyes, and drugs into cells [24]. Bulk electroporation between two relatively large electrodes results in unspecific labelling of populations of cells in suspensions, dissociated cultures, brain slice cultures and in vivo [25]. It has also been applied to label hippocampal slice cultures or spinal cord of mouse with Ca2+ indicators [4, 63]. Recently, thin glass pipettes were used for focused delivery of macromolecules to single cells. By using such a single-cell electroporation, identified cells can be transfected with DNA in slice cultures [52] and in
vivo [18]. Fluorescent dyes can also be delivered for morphological visualization of dendrites and axonal arbors in vitro [9,16,36,65] and in vivo [19,33,55]. Only two studies to date have used a similar approach to load single cells in cochlear slices and hippocampal slice cultures with Ca2+ indicators [34, 35]. In this study, we extended and characterized the use of single-cell electroporation to load cells with Ca2+ indicators in cortical brain slices and in vivo.
Technical aspects of electroporation
The application of a strong electromagnetic field across the membrane of a cell causes dielectric breakdown of the lipid bilayer, formation of pores, and transport of charged molecules along the electrochemical gradient through the permeabilized membrane [40, 56, 62]. In this study, we showed that electroporation can be used for rapid delivery of indicator dye to the soma within seconds. By using a patch pipette with a small tip opening the permeabilization of the membrane is highly localized [48]. This focal delivery of indicator dye ensures precise labelling of individual cells. Loading was highly reliable if the placement of the electroporation pipette was visually guided. Successful loading depended critically on the distance between the pipette tip and soma. For distances <3 μm dye was delivered to the targeted cell, whereas larger distances resulted in a brief unspecific staining of the extracellular space. This distance dependence reflects the rapid drop of the electric field strength with distance [45]. A similar distance dependence was found for effective transfection of cells with DNA by single-cell electro-poration [52]. Others report that the membrane has to be indented with the pipette, similar to the approach for establishing a giga-ohm seal [60], to successfully electro-porate cells [51]. We found that exerting mechanical force onto the membrane often resulted in irreversible damage of
Fig. 6 Pre- and postsynaptic Ca2+imaging. a Image of a synaptic contact. The axon of the presynaptic layer 2/3 pyramidal neuron is shown in red and the dendrite of the postsynaptic bitufted interneuron is shown in green. Pre- and postsynaptic cells were sequentially filled via single-cell electroporation with the red Ca2+indicator Rhod-2 andthe green Ca2+ indicator OGB-1, respectively. Arrows indicate the
position of the presynaptic bouton (pre) and the postsynaptic spine (post). The activated spine had a filopodia-like appearance as compared to the bright mushroom-like spine to its left. b Extracellular stimulation (stim) of the pyramidal neuron resulted in all cases in Ca2+ transients in the presynaptic bouton (pre). Grey and black traces represent single traces and the average, respectively. The postsynaptic spine responded with elevations in Ca2+in four trials, which were classified as successful synaptic transmissions (post success). In eight cases, no increase in postsynaptic Ca2+ was detected (post failure). These events were classified as failures. c Plot of the peak Ca2+ transient amplitudes in the bouton (open circles) and the corresponding postsynaptic peak Ca2+ transient amplitudes (solid triangles) as a function of trial number
1
µ
ma
post preb
50% 50 ms pre post success post failure stim∆
F/F∆
F/F∆
F/Fc
trial number (∆
F/F) max (%) 80 60 40 20 0 -20 12 10 8 6 4 2 0the cell. This might also be the reason for the low success rate using the blind approach for in vivo electroporation. In this case, the pipette most likely impaled the targeted cell exerting strong mechanical forces.
Several electroporation parameters can be adjusted to optimize dye delivery, including pulse amplitude, duration, number, and shape [6,18,51]. These parameters should be chosen to minimize damage to the cell while maximizing dye uptake [14]. In this study, we report that an initial dye concentration of 1 mM delivered through a patch pipette of 5 MΩ tip resistance with a single square pulse of 10 ms duration and an amplitude of 15 V results in a final intracellular dye concentration of about 200 μM. This concentration is sufficient to record Ca2+transients in small neuronal processes. Single-cell electroporation of DNA requires different electroporation protocols [18, 51, 52], with trains of short pulses being most effective, reflecting the larger molecular weight of DNA compared to the relatively small Ca2+ indicator molecules. Therefore, the electroporation parameters have to be matched to the size of the delivered molecules. Dextran-conjugated fluorescent dyes with high molecular weight are also most effectively electroporated with protocols similar to DNA electropora-tion [18].
Cell viability
The dielectric breakdown of the lipid bilayer and the formation of nonselective ionic pores during electropora-tion might perturb normal cell funcelectropora-tioning. Therefore, it is critical to assess cell viability after electroporation [6,56]. Using whole-cell recordings, we found that the membrane potential recovered within a minute after electroporation. This recovery time is more than two-fold shorter than recovery times derived from measuring the level of intracellular Ca2+during electroporation [62]. A modeling study simulating electroporation of a single spherical cell with a resting potential of −80 mV yielded recovery times of 20 s [7]. According to this model, the recovery time is determined by the kinetics of pore resealing and is therefore an intrinsic property of electroporated membranes.
An important result of our study is that the vast majority (85%) of cells survived the electroporation showing complete recovery not only of the membrane potential but also AP waveform and passive membrane properties. This indicates that the disturbance of the electrochemical gradient does not result in permanent changes of excitabil-ity [64]. Presumably, some of the unsuccessful attempts were due to already damaged cells before electroporation or impaling the cell with the electroporation pipette. Other studies assessing cell viability after electroporation by evaluating transfection efficiencies report similar viability rates between 80–90% [45, 52]. Even though longer
Fig. 7 In vivo single-cell electroporation. a Blind “electrical” approach for single-cell electroporation in vivo using a switchable amplifier headstage. The pipette is inserted through a small cranial window in the skull. A test pulse is used to probe whether the pipette is pushed against a neuronal membrane. A relais in the headstage permits rapid switching to a stimulus isolator for delivering the electroporation pulse. b Targeted “optical” approach. Dye ejection from the pipette tip is used to locally stain the extracellular space. Under the two-photon microscope cell bodies appear as negatively stained areas, which can be targeted with the pipette (upper image). The pipette tip is visible on the left. After delivering the electro-poration pulse, the cell was rapidly loaded with dye (lower image). c Example of two pyramidal neurons in rat neocortex filled sequentially via single-cell electroporation using the same pipette (single pulses, -15 V, 25 ms). The maximum-intensity side-projection of a stack of fluorescent images is shown. The pial surface is visible on the top. d In vivo measurements of spontaneous Ca2+transients in the proximal apical dendrites of two different neurons. Both cells were loaded with OGB-1 via single-cell electroporation
electroporation sequences were used for DNA delivery, cells showed GFP expression after more than 12 h indicating that cells were still intact and capable of gene transcription and protein synthesis.
Comparison to other loading techniques
By using single-cell electroporation of Ca2+ indicators, a group of cells can rapidly be labeled, with a low background comparable to loading with intracellular re-cording electrodes [61] or patch pipettes [2,11]. The latter techniques have the advantage of providing electrical recordings from the targeted cell. On the other hand, intracellular recordings are laborious, recording times are limited, and seldom more than two cells are filled simultaneously [29]. Populations of cells can be loaded with the membrane-permeable AM-ester form of Ca2+ indicators in vitro [13, 58] and in vivo [5, 47, 59]. However, this form of staining is unspecific, labelling not only all neuronal and glial cell bodies, but also heavily staining the neuropil. The resulting high level of back-ground fluorescence occludes visualization of subcellular compartments [27, 44]. As an alternative, genetically encoded indicators promise to enable functional measure-ments [20, 32, 54]. Yet, they have not reached the sensitivity and variety with respect to affinity and spectral properties of chemically synthesized indicators [50, 53]. Finally, neurons can be labeled with Ca2+ indicator using biolistic delivery of dye-coated beads with a gene gun [28]. This labelling technique can result in sparse labelling of a small population of cells with low background, similar to single-cell electroporation, but it lacks cell specificity. All loading methods, except loading during whole-cell record-ings, have the disadvantage of a variable and unknown intracellular dye concentration after loading. Quantitative measurements of Ca2+ levels either require calibration of intracellular dye concentration or they can be accomplished with ratiometric indicators [17] or by single-wavelength calibration methods [37].
By using single-cell electroporation, any charged mac-romolecule, including Ca2+indicators, can be loaded in any cell type if it is accessible to an electroporation pipette. Therefore, cells, which might not easily be targeted by genetic means, can be labelled selectively. Multiple substances (e.g., a morphological dye as Alexa 594 and a Ca2+ indicator as OGB-1) can be loaded simultaneously allowing morphological and functional measurements at the same time. A number of cells ranging from a few up to 20 can be filled rapidly with a high concentration of indicator and a low background. This allows for measurements of elementary Ca2+ events in small neuronal compartments, which is not possible with bulk loading or genetic methods. After recovery, cells responded to stimulation with Ca2+
transients for several hours suggesting that long-term imaging of Ca2+dynamics is possible.
We conclude that single-cell electroporation is a partic-ularly useful and reliable method to load multiple neurons with Ca2+indicators. It presents a complementary approach to existing labeling techniques and extends the use of indicator dyes to functional imaging of subcellular Ca2+ dynamics in small neuronal networks.
Acknowledgements We would like to thank B. Sakmann for his support and M. Kaiser, R. Rödel, and K. Schmidt for their excellent technical assistance.
References
1. Adelsberger H, Garaschuk O, Konnerth A (2005) Cortical calcium waves in resting newborn mice. Nat Neurosci 8:988–990 2. Augustine GJ (1994) Combining patch-clamp and optical methods
in brain slices. J Neurosci Methods 54:163–169
3. Berridge MJ (1998) Neuronal calcium signaling. Neuron 21:13–26 4. Bonnot A, Mentis GZ, Skoch J, O’Donovan MJ (2004)
Electro-poration loading of calcium sensitive dyes into the central nervous system. J Neurophysiol 93:1793–1808
5. Brustein E, Marandi N, Kovalchuk Y, Drapeau P, Konnerth A (2003) “In vivo” monitoring of neuronal network activity in zebrafish by two-photon Ca2+imaging. Pflügers Arch 446:766–773
6. Canatella PJ, Karr JF, Petros JA, Prausnitz MR (2001) Quantita-tive study of electroporation-mediated molecular uptake and cell viability. Biophys J 80:755–764
7. DeBruin KA, Krassowska W (1999) Modeling electroporation in a single cell. I. Effects of field strength and rest potential. Biophys J 77:1213–1224
8. DeBruin KA, Krassowska W (1999) Modeling electroporation in a single cell. II. Effects of ionic concentrations. Biophys J 77:1225–1233
9. Di Cristo G, Wu C, Chattopadhyaya B, Ango F, Knott G, Welker E, Svoboda K, Huang ZJ (2004) Subcellular domain-restricted GABAergic innervation in primary visual cortex in the absence of sensory and thalamic inputs. Nat Neurosci 7:1184–1186
10. Dodt HU, Zieglgänsberger W (1998) Visualization of neuronal form and function in brain slices by infrared videomicroscopy. Histochem J 30:141–152
11. Eilers J, Konnerth A (2000) Dye loading with patch pipets. In: Yuste R, Lanni F, Konnerth A (eds) Imaging neurons, a laboratory manual. Cold Spring Harbor Laboratory Press, Cold Spring Harbor, pp 35.31–35.10
12. Gan WB, Grutzendler J, Wong WT, Wong RO, Lichtman JW (2000) Multicolor “DiOlistic” labeling of the nervous system using lipophilic dye combinations. Neuron 27:219–225 13. Garaschuk O, Linn J, Eilers J, Konnerth A (2000) Large-scale
oscillatory calcium waves in the immature cortex. Nat Neurosci 3:452–459
14. Gehl J, Mir LM (1999) Determination of optimal parameters for in vivo gene transfer by electroporation, using a rapid in vivo test for cell permeabilization. Biochem Biophys Res Commun 261:377–380 15. Golzio M, Teissie J, Rols MP (2002) Direct visualization at the single-cell level of electrically mediated gene delivery. Proc Natl Acad Sci U S A 99:1292–1297
16. Graham LJ, Del Abajo R, Gener T, Fernandez E (2007) A method of combined single-cell electrophysiology and electroporation. J Neurosci Methods 160:69–74
17. Grynkiewicz G, Poenie M, Tsien RY (1985) A new generation of Ca2+ indicators with greatly improved fluorescence properties. J Biol Chem 260:3440–3450
18. Haas K, Sin WC, Javaherian A, Li Z, Cline HT (2001) Single-cell electroporation for gene transfer in vivo. Neuron 29:583–591 19. Haas K, Jensen K, Sin WC, Foa L, Cline HT (2002) Targeted
electroporation in Xenopus tadpoles in vivo-from single cells to the entire brain. Differentiation 70:148–154
20. Hasan MT, Friedrich RW, Euler T, Larkum ME, Giese G, Both M, Duebel J, Waters J, Bujard H, Griesbeck O, Tsien RY, Nagai T, Miyawaki A, Denk W (2004) Functional fluorescent Ca2+
indicator proteins in transgenic mice under TET control. PLoS Biol 2:e163
21. Helmchen F, Imoto K, Sakmann B (1996) Ca2+ buffering and action potential-evoked Ca2+signaling in dendrites of pyramidal neurons. Biophys J 70:1069–1081
22. Helmchen F, Svoboda K, Denk W, Tank DW (1999) In vivo dendritic calcium dynamics in deep-layer cortical pyramidal neurons. Nat Neurosci 2:989–996
23. Helmchen F, Waters J (2002) Ca2+imaging in the mammalian brain in vivo. Eur J Pharmacol 447:119–129
24. Ho SY, Mittal GS (1996) Electroporation of cell membranes: a review. Crit Rev Biotechnol 16:349–362
25. Inoue T, Krumlauf R (2001) An impulse to the brain—using in vivo electroporation. Nat Neurosci 4:1156–1158
26. Kaiser KM, Lübke J, Zilberter Y, Sakmann B (2004) Postsynaptic calcium influx at single synaptic contacts between pyramidal neurons and bitufted interneurons in layer 2/3 of rat neocortex is enhanced by backpropagating action potentials. J Neurosci 24:1319–1329
27. Kerr JND, Greenberg D, Helmchen F (2005) Imaging input and output of neocortical networks in vivo. Proc Natl Acad Sci U S A 102:14063–14068
28. Kettunen P, Demas J, Lohmann C, Kasthuri N, Gong YD, Wong ROL, Gan WB (2002) Imaging calcium dynamics in the nervous system by means of ballistic delivery of indicators. J Neurosci Methods 119:37–43
29. Köster HJ, Johnston D (2005) Target cell-dependent normalization of transmitter release at neocortical synapses. Science 308:863–866 30. Krassowska W, Filev PD (2006) Modeling Electroporation in a
Single Cell. Biophys J 77:1213–1224
31. Kreitzer AC, Gee KR, Archer EA, Regehr WG (2000) Monitoring presynaptic calcium dynamics in projection fibers by in vivo loading of a novel calcium indicator. Neuron 27:25–32
32. Kuner T, Augustine GJ (2000) A genetically encoded ratiometric indicator for chloride: capturing chloride transients in cultured hippocampal neurons. Neuron 27:447–459
33. Lambe EK, Aghajanian GK (2003) Hypocretin (orexin) induces calcium transients in single spines postsynaptic to identified thalamocortical boutons in prefrontal slice. Neuron 40:139–150 34. Lin X, Webster P, Li Q, Chen S, Ouyang Y (2003) Optical
recordings of Ca2+ signaling activities from identified inner ear cells in cochlear slices and hemicochleae. Brain Res Brain Res Protoc 11:92–100
35. Lohmann C, Finski A, Bonhoeffer T (2005) Local calcium transients regulate the spontaneous motility of dendritic filopodia. Nat Neurosci 8:305–312
36. Lovell P, Jezzini SH, Moroz LL (2006) Electroporation of neurons and growth cones in Aplysia californica. J Neurosci Methods 151:114–120
37. Maravall M, Mainen ZF, Sabatini BL, Svoboda K (2000) Estimating intracellular calcium concentrations and buffering without wavelength ratioing. Biophys J 78:2655–2667
38. Margrie TW, Brecht M, Sakmann B (2002) In vivo, low-resistance, whole-cell recordings from neurons in the anaesthe-tized and awake mammalian brain. Pflügers Arch 444:491–498
39. Margrie TW, Meyer AH, Caputi A, Monyer H, Hasan MT, Schaefer AT, Denk W, Brecht M (2003) Targeted whole-cell recordings in the mammalian brain in vivo. Neuron 39:911– 918
40. Neumann E, Toensing K, Kakorin S, Budde P, Frey J (1998) Mechanism of electroporative dye uptake by mouse B cells. Biophys J 74:98–108
41. Nevian T, Sakmann B (2004) Single spine Ca2+signals evoked by coincident EPSPs and backpropagating action potentials in spiny stellate cells of layer 4 in the juvenile rat somatosensory barrel cortex. J Neurosci 24:1689–1699
42. Nevian T, Sakmann B (2006) Spine Ca2+ signaling in spike-timing-dependent plasticity. J Neurosci 26:11001–11013 43. Nimchinsky EA, Yasuda R, Oertner TG, Svoboda K (2004) The
number of glutamate receptors opened by synaptic stimulation in single hippocampal spines. J Neurosci 24:2054–2064
44. Nimmerjahn A, Kirchhoff F, Kerr JN, Helmchen F (2004) Sulforhodamine 101 as a specific marker of astroglia in the neocortex in vivo. Nat Methods 1:31–37
45. Nolkrantz K, Farre C, Brederlau A, Karlsson RID, Brennan C, Eriksson PS, Weber SG, Sandberg M, Orwar O (2001) Electro-poration of single cells and tissues with an electrolyte-filled capillary. Anal Chem 73:4469–4477
46. O’Donovan M, Ho S, Yee W (1994) Calcium imaging of rhythmic network activity in the developing spinal cord of the chick embryo. J Neurosci 14:6354–6369
47. Ohki K, Chung S, Ch’ng YH, Kara P, Reid RC (2005) Functional imaging with cellular resolution reveals precise micro-architecture in visual cortex. Nature 433:597–603
48. Olofsson J, Nolkrantz K, Ryttsen F, Lambie BA, Weber SG, Orwar O (2003) Single-cell electroporation. Curr Opin Biotechnol 14:29–34
49. Peterlin ZA, Kozloski J, Mao BQ, Tsiola A, Yuste R (2000) Optical probing of neuronal circuits with calcium indicators. Proc Natl Acad Sci U S A 97:3619–3624
50. Pologruto TA, Yasuda R, Svoboda K (2004) Monitoring neural activity and [Ca2+] with genetically encoded Ca2+ indicators. J Neurosci 24:9572–9579
51. Rae JL, Levis RA (2002) Single-cell electroporation. Pflügers Arch 443:664–670
52. Rathenberg J, Nevian T, Witzemann V (2003) High-efficiency transfection of individual neurons using modified electrophysiol-ogy techniques. J Neurosci Methods 126:91–98
53. Reiff DF, Ihring A, Guerrero G, Isacoff EY, Joesch M, Nakai J, Borst A (2005) In vivo performance of genetically encoded indicators of neural activity in flies. J Neurosci 25:4766–4778 54. Roorda RD, Hohl TM, Toledo-Crow R, Miesenbock G (2004)
Video-rate nonlinear microscopy of neuronal membrane dynamics with genetically encoded probes. J Neurophysiol 92:609–621 55. Ruthazer ES, Akerman CJ, Cline HT (2003) Control of axon branch
dynamics by correlated activity in vivo. Science 301:66–70 56. Ryttsen F, Farre C, Brennan C, Weber SG, Nolkrantz K,
Jardemark K, Chiu DT, Orwar O (2000) Characterization of single-cell electroporation by using patch-clamp and fluorescence microscopy. Biophys J 79:1993–2001
57. Sabatini BL, Maravall M, Svoboda K (2001) Ca2+ signaling in dendritic spines. Curr Opin Neurobiol 11:349–356
58. Smetters D, Majewska A, Yuste R (1999) Detecting action potentials in neuronal populations with calcium imaging. Methods 18:215–221
59. Stosiek C, Garaschuk O, Holthoff K, Konnerth A (2003) In vivo two-photon calcium imaging of neuronal networks. Proc Natl Acad Sci U S A 100:7319–7324
60. Stuart GJ, Dodt HU, Sakmann B (1993) Patch-clamp recordings from the soma and dendrites of neurons in brain slices using infrared video microscopy. Pflügers Arch 423:511–518
61. Svoboda K, Denk W, Kleinfeld D, Tank DW (1997) In vivo dendritic calcium dynamics in neocortical pyramidal neurons. Nature 385:161–165
62. Teruel MN, Meyer T (1997) Electroporation-induced formation of individual calcium entry sites in the cell body and processes of adherent cells. Biophys J 73:1785–1796
63. Teruel MN, Blanpied TA, Shen K, Augustine GJ, Meyer T (1999) A versatile microporation technique for the transfection of cultured CNS neurons. J Neurosci Methods 93:37–48
64. Turrigiano GG, Nelson SB (2000) Hebb and homeostasis in neuronal plasticity. Curr Opin Neurobiol 10:358–364
65. Umeda T, Ebihara T, Okabe S (2005) Simultaneous observa-tion of stably associated presynaptic varicosities and post-synaptic spines: morphological alterations of CA3-CA1 synapses in hippocampal slice cultures. Mol Cell Neurosci 28:264–274
66. Waters J, Larkum M, Sakmann B, Helmchen F (2003) Supralinear Ca2+influx into dendritic tufts of layer 2/3 neocortical pyramidal neurons in vitro and in vivo. J Neurosci 23:8558–8567 67. Wimmer VC, Nevian T, Kuner T (2004) Targeted in vivo
expression of proteins in the calyx of Held. Pflügers Arch 449:319–333