ORIGINAL PAPER
Hans-Christoph Steinhausen Æ Leslie Foldager Æ Gurli Perto Æ Povl Munk-Jørgensen
Family aggregation of mental disorders in the nationwide
Danish three generation study
Received: 10 July 2008 / Accepted: 8 December 2008 / Published online: 17 February 2009
j
Abstract
Objective The study of familial
aggre-gation of major mental disorders in a national
pop-ulation. Method Within a Danish register-based
cohort study, aggregation of mental disorders was
analysed in all case-probands with first psychiatric
contact before the age of 19 years in the time period
between 1 April 1969 and 29 June 2004 followed up
until the age of 35 years, their first-degree relatives,
and a matched group of control-probands including
their first-degree relatives. Results Hazard rate ratios
were significantly elevated for cases as compared to
controls for all diagnoses among probands, parents,
and siblings. Among children of the probands, these
ratios were significantly elevated for neurotic
(anxi-ety) disorders, mental retardation, developmental
disorders, behavioural and emotional disorders of
childhood and adolescence, and miscellaneous
dis-orders. Family aggregation of any diagnosis was
sig-nificantly higher in probands with substance use
disorder, schizophrenia, affective disorders, neurotic
(anxiety) disorders, and miscellaneous disorders.
There
was
specificity
of
familial
transmission
for affective and neurotic (anxiety) disorders.
Conclusion This large nationwide study found some
differential patterns of familial aggregation of major
mental disorders.
j
Key words
psychopathology Æ family
aggrega-tion Æ epidemiology Æ register study
Introduction
Familial aggregation has been demonstrated for most
of the major mental disorders. There is a considerably
higher risk of schizophrenia in the first-degree
rela-tives of schizophrenia patients (lifetime risk 1–16%)
than in relatives of control probands from the general
population (0–2%) [10,
18,
28]. This applies also to
the families of patients suffering from schizoaffective
disorders who show higher lifetime rates of the
diagnoses within the group of the schizophrenias and
related disorders and vice versa [8,
17]. Furthermore,
there is a partial overlap in susceptibility for
schizo-phrenia and bipolar disorder, in that relatives of
probands with these disorders are at increased risk
for schizoaffective and recurrent unipolar disorders
[1]. The recurrence risk of bipolar disorder is 8.7% for
first-degree relatives of bipolar probands and 14.1%
for unipolar depression [26]. Prepubertal onset of
bipolar disorder may represent a distinct subtype that
is genetically related to ADHD, has a poorer response
to lithium and a fourfold greater risk in first-degree
relatives [26]. Various studies based on both adult
and adolescent patients have also shown that major
depression is a family disorder [14,
19,
23,
25,
27].
EAPCN
865
H.-C. Steinhausen, MD, Dipl.Psych., PhD Chair of Child and Adolescent Psychiatry
Aalborg Psychiatric Hospital, Aarhus University Hospital Mølleparkvej 10
9000 Aalborg, Denmark
H.-C. Steinhausen, MD, Dipl.Psych., PhD
Clinical Child and Adolescent Psychology, Institute of Psychology University of Basel
4055 Basel, Switzerland
H.-C. Steinhausen, MD, Dipl.Psych., PhD (&) Department of Child and Adolescent Psychiatry University of Zurich
Neumu¨nsterallee 9 8032 Zurich, Switzerland
e-mail: [email protected] L. Foldager, MSc Æ G. Perto Centre for Psychiatric Research Aarhus University Hospital, Risskov 8240 Risskov, Denmark
P. Munk-Jørgensen, DrMSc Unit for Psychiatric Research
Aalborg Psychiatric Hospital, Aarhus University Hospital 9000 Aalborg, Denmark
Various manifestations of substance dependence
including alcohol, marijuana, and cocaine
depen-dency and habitual smoking are all familial [12], and
there is evidence of both common and specific
addictive factors transmitted in the families [4] and in
alcoholism alone there is an up to sevenfold increase
of the disorder in the families of affected patients
compared to controls [20]. From less extended
re-search it is also clear that among the anxiety
disor-ders, panic disordisor-ders, agoraphobia, and generalized
anxiety disorders are recurrent in families [6,
11].
There is also evidence of a familial risk of suicidal
ideation and suicidal behaviour in the general
popu-lation [9].
Studies originating from either child and
adoles-cent or adult index patients with ADHD have shown
strong family loadings for various mental disorders
including ADHD, antisocial disorders, and affective
disorders [2,
3,
5,
7]. The familial risk of ADHD has
been recorded to be two- to eightfold greater in
first-degree relatives of ADHD probands [13]. In autism
there is a recurrence rate in siblings of affected
chil-dren that is much higher than the prevalence rate in
the general population [21]. In addition, there is not
only strong familial aggregation of autism-spectrum
disorders [16] but also more frequently a broader
phenotype including speech and learning disorders
and intellectual deficits predominantly in the verbal
domain that is specific to these families [15].
To date, there have been only few large scale
studies of familial aggregation based on probands
selected from general population samples. Few studies
have exploited the potential of population registries to
examine patterns of transmission of mental disorders
across generations. In the present study, we use data
from the Danish psychiatric central register (PCR) in
order to study to our knowledge for the first time the
family aggregation of major mental disorders across
three generations in a nationwide population. Within
this register-based cohort study, aggregation of all
major mental disorders was analysed in all
case-pro-bands with first psychiatric contact during childhood
and adolescence over an extended time period
fol-lowed up until the age of 35 years, their first-degree
relatives, and a matched group of control-probands
including their first-degree relatives.
Methods
j
Sample
The sample for this study is based on linkage of data across reg-isters of the population of Denmark. The Danish centralized civil register system (CRS) assigns a unique personal and life-lasting identification number but no names to all residents in Denmark. This unique personal identification number allows accurate linkage between various other registers and across generations. The sample for the present study was derived from the psychiatric central re-search register (PCR) of Denmark [22] which contains
computer-ized data on all admissions to Danish inpatient facilities since 1 April 1969, and outpatients since 1995. All psychiatric admissions are represented in the register because there are no private psy-chiatric hospitals in the country. Both the CRS and the PCR contain all residents of the country, i.e. those born in the country as well as immigrants.
Cases
Cases for the present study included individuals with at least one psychiatric record with first contact before the age of 19 years in the period from 1 April 1969 to 29 June 2004. Only those born between 1 April 1969 and 29 June 1985 were included in the sample in order to obtain coverage for the entire period of childhood and adolescence (0–18 years) by the end of the study period in 29 June 2004 when the cohort had a maximum age of 35 years. Case-pro-bands dying before the age of 19 years were excluded. Moreover, cases never admitted during the period of childhood and adoles-cence with a diagnosis among those shown in the Appendix were excluded. A total of 20,114 individuals remained after exclusions. The case-probands index-time is defined as the time of their first admission.
Controls
For each case-proband a total of three control-probands were ob-tained from the Danish centralized civil register (CRS) using risk-set sampling [24], that is they were alive and without registrations in the PCR at the case-probands index-time. Furthermore, control-probands were matched with regard to gender, age (same month and year of birth) and living in the same county at the case-pro-bands index-time. Only control-procase-pro-bands born between 1 April 1969 and 29 June 1985 were included. Persons with PCR records during childhood and adolescence were excluded. Furthermore, control-probands were excluded if they died before the age of 19 years. This ensured total coverage of the period of childhood and adolescence.
For some case-probands, however, fewer than three control-probands were obtained (probably due to matching restrictions). Furthermore, some control-probands were excluded due to reasons mentioned above. The entire cohort of control-probands consisted of a total of 56,802 individuals.
First-degree relatives
For each proband (cases and controls) first-degree relatives including parents, siblings and children were identified in the CRS. The relatives were then identified in the PCR. The PCR data of the parents and the siblings of probands are taken into account with regard to the entire set of data during the observation period from 1 April 1969 to 29 June 2004. The PCR data of the children of the probands were included as far as childhood and adolescence were concerned. Note, however, that only three children of the probands among those included reached the age of 19 years before the end of the study period. Thus, the entire dataset includes three generations with the case-probands having a psychiatric contact during child-hood and adolescence and being the index probands of the study. Furthermore, a distinction was made between case-parents and control-parents. If a parent did have both case and control children, then this parent was defined as a case-parent only. This procedure was applied using the whole sample, i.e. the case/control status of the excluded probands was used when defining the case/control status of the parents. The same procedure applied also to the sib-lings and to the children of probands.
We identified a total of 39,855 case-parents (19,721 males and 20,134 females) and 104,169 control-parents (51,712 males and 52,457 females). Each individual is counted only once even if he or she is a parent of more than one proband. In addition, 22,872 case-siblings (11,668 males and 11,204 females), 70,816 control-case-siblings (36,481 males and 34,335 females), 5,914 case-children (2,991 males and 2,923 females), and 15,495 control-children (8,017 males and 7,478 females) were identified. Further details concerning the first degree relatives are shown in Table1.
j
Diagnoses
The PCR data include date of birth, gender, admission and dis-charge date (including number of episodes), diagnoses (ICD-8 until 1993 and ICD-10 from 1994), type of admission (inpatients, out-patients and emergency cases). Date of death was taken from the Danish causes of death registry (CDR). Diagnoses differentiate between underlying disorder (main diagnosis) and the condition leading to the present admission (action diagnosis). In addition, the dataset contains auxiliary diagnoses and additional codes (mainly other diagnoses and medication codes). In order to match ICD-8 and ICD-10 categories a list of corresponding groups of included diagnoses was set up as shown in the Appendix. Data analysis was based on main diagnoses and action diagnoses. In general, the action diagnosis was used only if no main diagnosis was given.
j
Statistical analysis
Two different kinds of analyses were applied: (a) Cox regression analysis of time-to-event data considering the event of being diagnosed with a mental disorder (see below), and (b) familiality by examining the proportion of first-degree relatives having any or the
same psychiatric diagnosis as their proband. These proportions were compared by use of a logistic regression with standard errors corrected for the correlation between multiple observations from subjects having more than one proband. The P value for the two-sided Wald test of no difference (odds ratio = 1) was calculated in order to cheque if the proportions found in relatives of cases were higher than those found in the relatives of controls. Testing was only done if all expected frequencies in the corresponding two by two table were greater than five.
For the Cox proportional hazards model, we first examined whether in general subjects from the case-cohorts were more prone to receive a psychiatric diagnosis. This was done by considering first contact ever as the event psychiatric contact in general, i.e. admission to either outpatient or inpatient psychiatric care. Sec-ondly, we investigated whether the patterns differed with specific diagnoses by using the first event the specific diagnosis was given. The Cox regression analyses were stratified by gender in order to prevent violations of the proportionality assumption. Birth co-horts for the parents were constructed by stratification of the parents by 20 quantiles, (i.e. 5, 10 and 15% percentiles) based on birth dates since 1 January 1960 (negative numbers if earlier than this date). Age was adjusted for by using age as time scale. Results are presented as hazard rate ratio with 95% confidence intervals, i.e. as the ratio between the hazard rate for the case-cohort and the hazard rate for the control-cohort.
Time limitations of the PCR induce left truncated observation time for most parents and also a few of the siblings. Therefore, entire or large parts of the childhood and adolescence period was missing for most of the parents and we decided to left censor this time period for the remaining parents. As a result of the exclusion criteria none of the probands have left truncated observations and, of course, neither do their children.
Dates of death were obtained from the CDR. The extract from CDR did, however, only include death until 31 December 2000. In the analyses, parents were censored at the date of death, at 31 December 2000 (latest date in CDR) or at the last date of discharge from a psychiatric admission later than 31 December 2000. For probands, siblings and children date of death was known until 31 May 2004 from the CRS and the censoring procedure was accordingly adjusted. Analyses were carried out using Stata release 9.2 (StataCorp. 2005. Stata Statistical Software: Release 9. College Station, TX: StataCorp LP).
Results
j
Diagnoses of the case-probands
For each individual we identified the most severe
diagnosis with respect to the hierarchy shown in the
Appendix. Considering the entire study period, the
frequencies (and proportions) of these diagnoses
were: D0 brain disorders: 536 (2.7%); D1 substance
use disorders: 1,649 (8.2%); D2 schizophrenic
disor-ders: 1,947 (9.7%); D3 affective disordisor-ders: 1,726
(8.6%); D4 neurotic (anxiety) disorders: 5,169
(25.7%); D5 psychosomatic disorders: 1,570 (7.8%);
D6 personality disorders: 1,659 (8.2%); D7 mental
retardation: 469 (2.3%); D8 developmental disorders:
1,227 (6.1%); D9 emotional and behavioural disorders
in childhood and adolescence: 3,674 (18.3%); D10
miscellaneous disorders: 488 (2.4%).
j
Findings of the Cox regression analyses
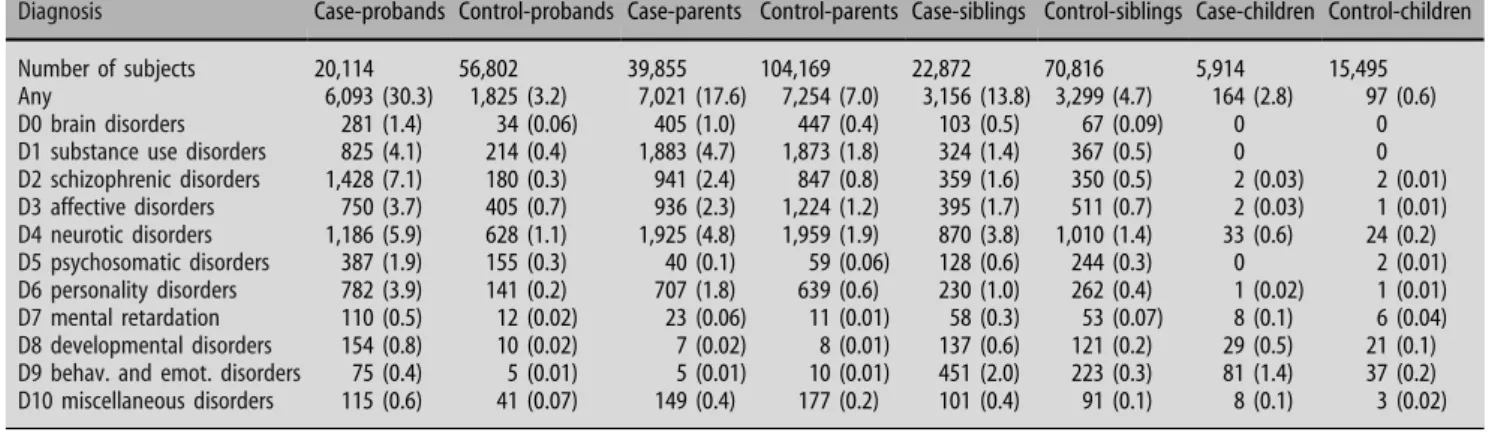
Frequencies and proportions of the most severe
diagnosis given during the entire observation period
Table 1 Description of first-degree relatives of the probands (cases and controls). Proportions in percentage relate to the relevant total number (N) of subjects Cases (N = 20,114) (%) Controls (N = 56,802) (%) Both (%) No of parents None 124 (0.6) 386 (0.7) One 586 (2.9) 1,096 (1.9) Both 19,404 (96.5) 55,320 (97.4) Case-parents (N = 39,855) 34,201 (85.8) 0 (0) 5,654 (14.2) Control-parents (N = 104,169) 0 (0) 104,169 (100) 0 (0) No of siblings None 5,984 (29.8) 10,983 (19.3) One 8,536 (42.4) 27,205 (47.9) Two 3,809 (18.9) 12,625 (22.2) Three or more 1,785 (8.9) 5,989 (10.5) Total 20,114 (100) 56,802 (100) Case-siblings (N = 22,872) 20,528 (89.8) 0 (0) 2,344 (10.2) Control-siblings (N = 70,816) 0 (0) 70,816 (100) 0 (0) No of children None 16,233 (80.7) 46,873 (82.5) One 2,333 (11.6) 5,216 (9.2) Two 1,130 (5.6) 3,704 (6.5) Three 322 (1.6) 845 (1.5) Four or more 96 (0.5) 164 (0.3) Total 20,114 (100) 56,802 (100) Case-children (N = 5,914) 5,709 (96.5) 0 (0) 205 (3.5) Control-children (N = 15,495) 0 (0) 15,495 (100) 0 (0)
are shown in Table
2. In the cohort of probands the
76,916 subjects contributed a total of 371,507 person
years and a total of 7,918 were diagnosed with a
mental disorder from the hierarchy: 6,093 (30.3%)
case-probands and 1,825 (3.2%) control-probands.
Here, every proband was analysed from his or her
19th birthday and contributed risk time (person
years) until first psychiatric contact as adult or until
censoring. The latest observed exit was at the age of
35. In the cohort of parents, the 144,024 persons
contributed a total of 3,864,926 person years and a
total number of 14,275 had at least one psychiatric
contact after their 19 years birthday with a diagnosis
from the hierarchy: 7,023 (17.6%) of the case-parents
and 7,255 (7.0%) of the control-parents. Mean age at
entry was 21.1 years (SD = 4.0) but this distribution
was highly skewed and the median age was 19.0 years
whereas the 75% percentile was 21.9 years of age. The
latest entry age was 67.6 years but 99% were
37.3 years or younger. In the cohort of siblings, the
93,688 persons contributed 2,194,015 years in total
and 6,455 were diagnosed: 3,156 (13.8%) of the
case-siblings and 3,299 (4.7%) of the control-case-siblings. Most
siblings were observed from birth but the latest exit
was at the age of 53, so a few had left truncated
observations and entered the study on 1 April 1969.
The 21,409 children contributed 85,246 person years
but only 261 were diagnosed during the study period,
so the data on the child-cohorts were somewhat
sparse. In every cohort these numbers are different
when specific diagnoses are considered because
sub-jects then contribute risk time until the first contact
with this diagnosis or until censoring.
The results of the Cox regression analyses for each
of the four cohorts are shown in Figs.
1
and
2. In the
cohort of probands, only the period after their 19th
birthday was analysed as control-probands by design
had no psychiatric contacts during childhood and
adolescence. The parents were only assessed after age
19 so no information was available on earlier onset
disorders. Because the sample of offspring of
pro-bands were only evaluated from birth to age 18,
sev-eral adult disorders were too rare for meaningful
analysis. In general, the number of subjects in the
cohort of the probands’ children is small and the
confidence intervals are correspondingly wide.
Table 2 Frequencies of subjects by most severe diagnosis during the time of observation in the various cohorts
Diagnosis Case-probands Control-probands Case-parents Control-parents Case-siblings Control-siblings Case-children Control-children
Number of subjects 20,114 56,802 39,855 104,169 22,872 70,816 5,914 15,495
Any 6,093 (30.3) 1,825 (3.2) 7,021 (17.6) 7,254 (7.0) 3,156 (13.8) 3,299 (4.7) 164 (2.8) 97 (0.6)
D0 brain disorders 281 (1.4) 34 (0.06) 405 (1.0) 447 (0.4) 103 (0.5) 67 (0.09) 0 0
D1 substance use disorders 825 (4.1) 214 (0.4) 1,883 (4.7) 1,873 (1.8) 324 (1.4) 367 (0.5) 0 0
D2 schizophrenic disorders 1,428 (7.1) 180 (0.3) 941 (2.4) 847 (0.8) 359 (1.6) 350 (0.5) 2 (0.03) 2 (0.01) D3 affective disorders 750 (3.7) 405 (0.7) 936 (2.3) 1,224 (1.2) 395 (1.7) 511 (0.7) 2 (0.03) 1 (0.01) D4 neurotic disorders 1,186 (5.9) 628 (1.1) 1,925 (4.8) 1,959 (1.9) 870 (3.8) 1,010 (1.4) 33 (0.6) 24 (0.2) D5 psychosomatic disorders 387 (1.9) 155 (0.3) 40 (0.1) 59 (0.06) 128 (0.6) 244 (0.3) 0 2 (0.01) D6 personality disorders 782 (3.9) 141 (0.2) 707 (1.8) 639 (0.6) 230 (1.0) 262 (0.4) 1 (0.02) 1 (0.01) D7 mental retardation 110 (0.5) 12 (0.02) 23 (0.06) 11 (0.01) 58 (0.3) 53 (0.07) 8 (0.1) 6 (0.04) D8 developmental disorders 154 (0.8) 10 (0.02) 7 (0.02) 8 (0.01) 137 (0.6) 121 (0.2) 29 (0.5) 21 (0.1)
D9 behav. and emot. disorders 75 (0.4) 5 (0.01) 5 (0.01) 10 (0.01) 451 (2.0) 223 (0.3) 81 (1.4) 37 (0.2)
D10 miscellaneous disorders 115 (0.6) 41 (0.07) 149 (0.4) 177 (0.2) 101 (0.4) 91 (0.1) 8 (0.1) 3 (0.02) Proportions in percentage of the total number of subjects in each cohort in parentheses
Hazard rate ratio D10 Miscellaneous disorders
D9 Behav. And emot. disorders D8 Developmental disorders D7 Mental retardation D6 Personality disorders D5 Psychosomatic disorders D4 Neurotic disorders D3 Affective disorders D2 Schizophrenic disorders D1 Substance use disorders D0 Brain disorders Any psychiatric diagnosis
15.2 (12.7-18.2) *** 18.0 (16.1-20.1) *** 7.92 (6.72-9.34) *** 6.81 (6.28-7.38) *** 6.61 (5.94-7.37) *** 23.7 (20.6-27.1) *** 11.3 (9.73-13.1) *** 22.9 (16.0-32.7) *** 11.5 (10.9-12.1) *** 0 10 20 30
Fig. 1 Results from stratified Cox regression analyses showing the main differences in terms of the hazard rate ratio (HR) between the case- and control-probands. 95% Confidence intervals are given in parentheses after the HR
In the cases (Fig.
1) the probability of falling
mentally ill as adults is 11.5 times higher for any
diagnosis than in the controls. For the various
diagnoses these hazard rate ratios vary between a
low of 6.6 (affective disorders) to a high of 24
(schizophrenic disorders). All these ratios are highly
statistically significant different from 1. Similarly, in
the parents (Fig.
2) the hazard rate ratio for any
disorder is 2.6, with a range from 2.0 to 3.5 for other
disorders. In the siblings, the hazard rate ratio for
any diagnosis is 3.1 and varies between 1.7 and 6.6
for other disorders. Even though the low frequencies
of disorders in offspring precluded statistical
analy-sis for many conditions in offspring, there are
sig-nificantly increased hazard rates in the offspring of
cases compared to those of controls, with a ratio of
3.7 for any disorder, and ratios ranging between 2.6
and 4.5 for those five diagnostic groups that were
sufficiently prevalent in this cohort: neurotic
(anxi-ety) disorders, mental retardation, developmental
disorders, behavioural and emotional disorders in
childhood and adolescence, and miscellaneous
dis-orders.
j
Familiality
Familial aggregation of the various study diagnoses is
shown in Table
3
that presents the frequencies of
first-degree relatives of cases and controls who
re-ceived any diagnosis or the same diagnosis as that of
the proband. For the entire group of relatives as
indicated in the column labelled ‘all’ and the
aggre-gation of any diagnosis, there were significantly
in-creased frequencies among first-degree relatives of
cases for D1 substance use disorders, D2
schizo-phrenic disorders, D3 affective disorders, D4 Neurotic
(anxiety) disorders, and D10 miscellaneous disorders.
The same pattern also emerged for parents, whereas
the association with any diagnosis was significantly
elevated for D1 substance use, D3 affective and D4
neurotic disorders among the siblings. Almost all
expected frequencies were less than five in the
off-spring of controls. Only a single test was done and
this showed no significant difference in D4 neurotic
disorders.
Probands and relatives were significantly more
likely to exhibit the same diagnosis for D3 affective
disorders and D4 Neurotic disorders. For siblings,
specificity only emerged for D4 Neurotic disorders.
The frequency of neurotic disorders was elevated
among the control children. However, it should be
noted that some of the relatively high proportions of
diagnoses among the control children are seen in
relatively small subsample sizes. Again, sample sizes
in children were too small to analyse anything
sepa-rately about familiality of same diagnoses in the
off-spring.
Discussion
This study is one of the largest studies of the familial
aggregation of mental disorders based on a national
register across three generations. The unique
sam-pling of cases from a complete sample of individuals
treated in the Danish National Health Service and
selection of a large representative sample of controls
from a centralized register afforded the opportunity
to conduct the first study of the familial aggregation
of mental disorders that is representative of the total
population of Denmark. However, for the
under-standing of the results it has to be born in mind that
the study is primarily based on patients with
child-hood onset disorders. Only in the parents,
infor-2.80 (2.50-3.13) *** 3.51 (3.29-3.74) *** 2.18 (1.60-2.97) ** 2.66 (2.53-2.79) *** 2.00 (1.86-2.14) *** 2.96 (2.73-3.21) *** 2.54 (2.39-2.70) *** 2.23 (1.94-2.55) *** 2.61 (2.52-2.69) *** 3.69 (3.16-4.30) *** 6.58 (5.76-7.52) *** 3.50 (2.87-4.28) *** 3.61 (2.67-4.89) *** 3.52 (3.16-3.93) *** 1.71 (1.43-2.06) *** 2.85 (2.64-3.08) *** 2.48 (2.21-2.78) *** 3.41 (2.99-3.88) *** 2.89 (2.50-3.34) *** 4.75 (3.50-6.47) *** 3.09 (2.94-3.24) ***
Hazard rate ratio D10 Miscellaneous disorders
D9 Behav. And emot. disorders D8 Developmental disorders D7 Mental retardation D6 Personality disorders D5 Psychosomatic disorders D4 Neurotic disorders D3 Affective disorders D2 Schizophrenic disorders D1 Substance use disorders D0 Brain disorders Any psychiatric diagnosis
3.92 (1.64-9.39) ** 4.53 (3.19-6.44) *** 2.57 (2.57-4.41) *** 3.01 (1.04-8.68) * 3.03 (1.76-5.21) *** 3.69 (2.86-4.75) *** 0
Parents Siblings Children
10 8 6 4 2 0 8 6 4 2 0 4 2 Fig. 2 Results from stratified Cox
regression analyses showing the main differences in terms of the hazard rate ratio (HR) between the individual case- and control-cohorts (parents, siblings, children. 95% confidence intervals are given in parentheses after the HR
mation on childhood onset disorders was not
avail-able.
The chief finding is that the first degree relatives
of the cases are significantly more likely to receive
treatment for any mental disorder as well as that
manifest by the proband than those of control
pro-bands. These findings corroborate those from prior
family studies of clinical and community samples of
probands for all disorders including substance use
disorders [4,
12,
20], the schizophrenias [10,
18,
28],
affective disorders [2,
3,
14,
19,
23,
25–27], and
anxiety disorders [6,
11]. We also found that there
was strong specificity of familial aggregation of the
probands’ disorders, particularly in parents and
siblings. This was particularly marked for affective
and neurotic (anxiety) disorders. In contrast, other
disorders like the schizophrenias did not show this
pattern of aggregation. These disorders are very rare
in childhood and adolescence. Thus, a relatively low
base rate of these disorders in the present sample of
case probands may be predominantly responsible for
the lacking familial aggregation of the
schizophre-nias.
Significantly increased hazard rates in relatives
were also obtained for some types of disorders for
which there have not been prior studies of familial
clustering, such as brain disorders, psychosomatic
disorders, personality disorders, and mental
retarda-tion. The analysis of the familial aggregation of
attention-deficit hyperactivity disorders or autism in
the present cohort will need further analyses in order
to evaluate findings of a small series of both clinical
and population based family studies [2,
3,
5,
13,
15,
16].
As would be expected by the sampling of probands
with childhood onset disorders, there was stronger
familial aggregation among parents and their siblings
than for offspring due to the restricted observation
period and the smaller number in the study. Even
though the magnitude was lower among offspring,
there was still increased risk for early onset disorders
including neurotic (anxiety) disorders, mental
retar-dation, and developmental disorders.
Despite the unique and large sample, there are also
limitations to the present study. First, our analyses
did not include subjects or relatives with mental
disorders who did not seek treatment and those who
were treated abroad. However, in Denmark health
service including psychiatry is free to the public
fol-lowing referral from general practitioners. All
inpa-tient and outpainpa-tient services are in the public domain
and there are no private hospitals available. The entire
health service system is paid via taxes. Given this
background, it may be assumed that the threshold for
Table 3 Frequencies (proportions in percentage) of the most severe diagnosis observed in first-degree relatives of probands (cases and controls) during the study period
Proband’s diagnosis Relative’s diagnosis
All Parents Siblings Children
Cases Controls Cases Controls Cases Controls Cases Controls
D0 Brain Disorders Any 376 (20.7) 19 (15.2) 248 (23.6) 15 (22.4) 121 (18.9) 4 (9.1) 7 (5.5) 0a
Same 41 (2.3) 1 (0.8)a 26 (2.5) 0a 15 (2.3) 1 (2.3)a 0 0a
D1 substance use disorders Any 1,084 (19.9) 110 (14.4)*** 767 (23.9) 75 (17.9)** 293 (17.5) 32 (11.9)* 24 (4.3) 3 (3.9)a
Same 339 (6.2) 34 (4.4) 277 (8.6) 29 (6.9) 62 (3.7) 5 (1.9) 0 0a
D2 schizophrenic disorders Any 1,221 (18.8) 87 (13.8)** 794 (21.2) 50 (14.2)** 399 (16.9) 35 (15.2) 28 (7.2) 2 (4.2)a
Same 252 (3.9) 18 (2.9) 158 (4.2) 10 (2.8) 92 (3.9) 8 (3.5) 2 (0.5) 0a
D3 affective disorders Any 866 (14.6) 160 (11.0)*** 590 (17.3) 112 (13.9)* 265 (12.6) 44 (9.1)* 11 (2.6) 4 (2.4)a
Same 212 (3.6) 29 (2.0)** 142 (4.2) 20 (2.5)* 70 (3.3) 9 (1.9) 0 0a
D4 neurotic disorders Any 2,620 (14.7) 241 (10.3)*** 1,786 (17.7) 161 (13.1)*** 802 (13.5) 70 (8.8)*** 32 (1.8) 10 (3.1)
Same 884 (5.0) 65 (2.8)*** 571 (5.6) 40 (3.3)*** 305 (5.2) 20 (2.5)** 8 (0.5) 5 (1.6)a
D5 psychosomatic disorders Any 453 (8.4) 40 (7.3) 295 (9.5) 26 (8.5) 155 (8.1) 13 (7.2) 3 (0.9) 1 (1.6)a
Same 21 (0.4) 2 (0.4)a 3 (0.1) 0a 18 (0.9) 2 (1.0)a 0 0a
D6 personality disorders Any 867 (15.4) 72 (13.8) 625 (19.3) 52 (18.5) 222 (12.8) 18 (10.7) 20 (3.1) 2 (2.7)a
Same 100 (1.8) 11 (2.1) 75 (2.3) 8 (2.8) 25 (1.4) 3 (1.8)a 0 0a
D7 mental retardation Any 209 (13.6) 3 (6.8) 137 (14.9) 3 (12.5)a 71 (12.2) 0a 1 (3.2) 0a
Same 14 (0.9) 0a 3 (0.3) 0a 11 (1.9) 0a 0 0a
D8 developmental disorders Any 506 (13.1) 6 (21.4)a 345 (14.3) 4 (21.1)a 158 (11.6) 2 (22.2)a 3 (3.1) –b
Same 28 (0.7) 0a 0 0a 27 (2.0) 0a 1 (1.0) –b D9 behavioural and emotional dis. Any 2,047 (16.5) 6 (28.6)a 1,418 (19.6) 4 (40.0)a 595 (15.7) 2 (20.0)a 34 (2.6) 0a Same 226 (1.8) 0a 5 (0.07) 0a 204 (5.4) 0a 17 (1.3) 0a D10 miscellaneous disorders Any 384 (22.0) 17 (11.3)** 276 (28.9) 13 (15.9)* 102 (18.7) 4 (7.8) 6 (2.5) 0a Same 42 (2.4) 1 (0.7)a 14 (1.5) 1 (1.2)a 28 (5.1) 0a 0 0a
Separate rows are showing the frequencies found in relatives having any of the diagnoses from the hierarchy and the same diagnosis as their proband. Proportions refer to the total number of first-degree relatives of probands having this diagnosis
*P < 0.05, **P < 0.01, ***P < 0.001
aExpected frequency less than five (no test done) b
getting into treatment is similar in the proband and
control cohorts. It may also be assumed that both
indigenous people and the small group of immigrants
were represented to the same extent in the two
co-horts because both are registered in the CPR. Thus,
one may be rather sure that the large size and the
representative nature of the treated samples may help
to correct expected findings based on previous
smaller and more biased clinical family aggregation
study samples.
Second, we could not examine the reliability and
validity of the findings because they were based on
clinical records [16,
21]. However, the specialist
education both in child and adult psychiatry has been
organized always by the national psychiatric societies
and surveyed by the National Board of Health so that
all received the same education. When ICD-10 was
launched in 1994, all psychiatrists were trained over a
2-year period including two follow-up courses. Since
then, yearly nationwide courses in diagnoses and
classification have been provided. Thus, the large
group
of
physicians
who
provided
diagnoses
throughout the study period all received continuous
education in assessment and classification within the
same organization.
Third, diagnoses were partly based on the ICD-8
scheme of classification without any operationalized
criteria for diagnoses and partly on the ICD-10 with a
stronger adherence to descriptive diagnostic criteria.
However, we attempted to minimize this limitation by
using broader diagnostic categories instead of smaller
specific diagnostic groups in the analyses. In addition,
diagnostic correspondence between the two systems
was not only established by the senior author alone
but also controlled by another senior child and
ado-lescent psychiatry chair person. Fourth, the left
truncation of the parent data due to lacking
infor-mation on mental disorders in childhood and
ado-lescence is another limitation.
Despite these limitations, our findings confirm the
importance of familial aggregation of mental
disor-ders and suggest that future research will address the
specific mechanisms of the specificity and consistency
of this finding. We hope that future studies of the
cohort of offspring using contemporary clinical and
biologic measures may shed additional light on this
important question.
j Acknowledgments H. C. S. and P. M. J. were responsible for conception and design of the study and interpretation of results. L. F. performed all the statistical analyses and G. P. was responsible for data collection and control in the PCR. H. C. S. drafted the article and all other authors revised it critically for intellectual content. The authors are indebted to Per Hove Thomsen for his cheque of the correspondence between ICD-8 and ICD-10 diagno-ses.
Appendix
See Table
4
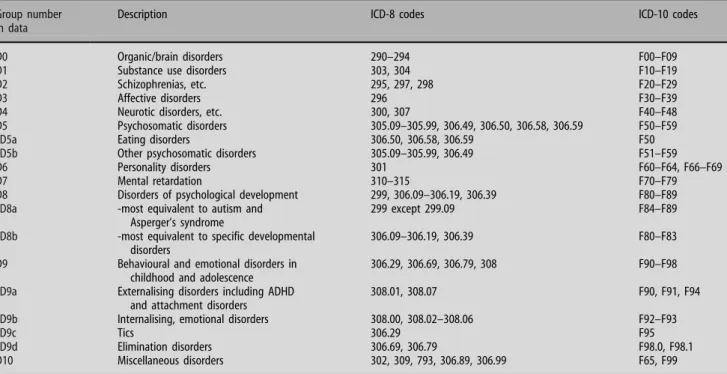
Table 4 Main groups and subgroups of diagnoses and correspondence between ICD-8 and ICD-10 codes
Group number in data
Description ICD-8 codes ICD-10 codes
D0 Organic/brain disorders 290–294 F00–F09
D1 Substance use disorders 303, 304 F10–F19
D2 Schizophrenias, etc. 295, 297, 298 F20–F29
D3 Affective disorders 296 F30–F39
D4 Neurotic disorders, etc. 300, 307 F40–F48
D5 Psychosomatic disorders 305.09–305.99, 306.49, 306.50, 306.58, 306.59 F50–F59
D5a Eating disorders 306.50, 306.58, 306.59 F50
D5b Other psychosomatic disorders 305.09–305.99, 306.49 F51–F59
D6 Personality disorders 301 F60–F64, F66–F69
D7 Mental retardation 310–315 F70–F79
D8 Disorders of psychological development 299, 306.09–306.19, 306.39 F80–F89
D8a -most equivalent to autism and
Asperger’s syndrome
299 except 299.09 F84–F89
D8b -most equivalent to specific developmental disorders
306.09–306.19, 306.39 F80–F83
D9 Behavioural and emotional disorders in childhood and adolescence
306.29, 306.69, 306.79, 308 F90–F98
D9a Externalising disorders including ADHD and attachment disorders
308.01, 308.07 F90, F91, F94
D9b Internalising, emotional disorders 308.00, 308.02–308.06 F92–F93
D9c Tics 306.29 F95
D9d Elimination disorders 306.69, 306.79 F98.0, F98.1
References
1. Berrettini W (2003) Evidence for shared susceptibility in bipolar disorder and schizophrenia. Am J Med Genet C Semin Med Genet 123:59–64
2. Biederman J, Faraone S, Keenan K, Knee D, Tsuang MT (1990) Family-genetic and psychosocial risk factors in DSM-III: attention-deficit disorder. J Am Acad Child Adolesc Psychiatry 29:526–533
3. Biederman J, Faraone SV, Keenan K, Benjamin J, Krifcher B, Moore C, Sprich-Buckminster S, Ugaglia K, Jellinek MS, Steingard R et al (1992) Further evidence for family-genetic risk factors in attention deficit hyperactivity disorder. Patterns of comorbidity in probands and relatives psychiatrically and pediatrically referred samples. Arch Gen Psychiatry 49:728–738 4. Bierut LJ, Dinwiddie SH, Begleiter H, Crowe RR, Hesselbrock V, Nurnberger JI Jr, Porjesz B, Schuckit MA, Reich T (1998) Familial transmission of substance dependence: alcohol, mari-juana, cocaine, and habitual smoking: a report from the Col-laborative Study on the Genetics of Alcoholism. Arch Gen Psychiatry 55:982–988
5. Epstein JN, Conners CK, Erhardt D, Arnold LE, Hechtman L, Hinshaw SP, Hoza B, Newcorn JH, Swanson JM, Vitiello B (2000) Familial aggregation of ADHD characteristics. J Abnorm Child Psychol 28:585–594
6. Finn CT, Smoller JW (2001) The genetics of panic disorder. Curr Psychiatry Rep 3:131–137
7. Frick PJ, Lahey BB, Crist MAG, Loeber R, Green S (1991) History of childhood behavior in biological relatives of boys with attention-deficit hyperactivity disorder and conduct dis-order. J Clin Child Psychol 20:445–451
8. Gershon ES, Hamovit J, Guroff JJ et al (1982) A family study of schizoaffective, bipolar I, bipolar II, and normal control pro-bands. Arch Gen Psychiatry 39:1157–1167
9. Goodwin RD, Beautrais AL, Fergusson DM (2004) Familial transmission of suicidal ideation and suicide attempts: evidence from a general population sample. Psychiatry Res 126:159–165 10. Hallmayer J (2000) The epidemiology of the genetic liability for schizophrenia. Aust N Z J Psychiatry 34:47–55 (discussion 56– 47)
11. Hettema JM, Neale MC, Kendler KS (2001) A review and meta-analysis of the genetic epidemiology of anxiety disorders. Am J Psychiatry 158:1568–1578
12. Kendler KS, Davis CG, Kessler RC (1997) The familial aggre-gation of common psychiatric and substance use disorders in the National Comorbidity Survey: a family history study. Br J Psychiatry 170:541–548
13. Khan SA, Faraone SV (2006) The genetics of ADHD: a literature review of 2005. Curr Psychiatry Rep 8:393–397
14. Klein DN, Lewinsohn PM, Seeley JR, Rohde P (2001) A family study of major depressive disorder in a community sample of adolescents. Arch Gen Psychiatry 58:13–20
15. Lauritsen M, Ewald H (2001) The genetics of autism. Acta Psychiatr Scand 103:411–427
16. Lauritsen MB, Pedersen CB, Mortensen PB (2005) Effects of familial risk factors and place of birth on the risk of autism: a nationwide register-based study. J Child Psychol Psychiatry 46:963–971
17. Laursen TM, Labouriau R, Licht RW, Bertelsen A, Munk-Olsen T, Mortensen PB (2005) Family history of psychiatric illness as a risk factor for schizoaffective disorder: a Danish register-based cohort study. Arch Gen Psychiatry 62:841–848
18. Lichtermann D, Karbe E, Maier W (2000) The genetic epide-miology of schizophrenia and of schizophrenia spectrum dis-orders. Eur Arch Psychiatry Clin Neurosci 250:304–310 19. Lieb R, Isensee B, Hofler M, Pfister H, Wittchen HU (2002)
Parental major depression and the risk of depression and other mental disorders in offspring: a prospective-longitudinal community study. Arch Gen Psychiatry 59:365–374
20. Merikangas KR (1990) The genetic epidemiology of alcoholism. Psychol Med 20:11–22
21. Muhle R, Trentacoste SV, Rapin I (2004) The genetics of aut-ism. Pediatrics 113:e472–e486
22. Munk-Jorgensen P, Mortensen PB (1997) The Danish psychi-atric central register. Dan Med Bull 44:82–84
23. Rice F, Harold G, Thapar A (2002) The genetic aetiology of childhood depression: a review. J Child Psychol Psychiatry 43:65–79
24. Rothman KJ, Greenland S (1998) Modern epidemiology. Lip-pincott, Williams and Wilkins, Philadelphia
25. Schreier A, Hofler M, Wittchen HU, Lieb R (2006) Clinical characteristics of major depressive disorder run in families—a community study of 933 mothers and their children. J Psychiatr Res 40:283–292
26. Smoller JW, Finn CT (2003) Family, twin, and adoption studies of bipolar disorder. Am J Med Genet C Semin Med Genet 123:48–58
27. Sullivan PF, Neale MC, Kendler KS (2000) Genetic epidemiol-ogy of major depression: review and meta-analysis. Am J Psy-chiatry 157:1552–1562
28. Tsuang MT, Stone WS, Faraone SV (1999) Schizophrenia: a review of genetic studies. Harv Rev Psychiatry 7:185–207