HAL Id: hal-03009250
https://hal.archives-ouvertes.fr/hal-03009250
Submitted on 17 Nov 2020
HAL is a multi-disciplinary open access
archive for the deposit and dissemination of
sci-entific research documents, whether they are
pub-lished or not. The documents may come from
teaching and research institutions in France or
abroad, or from public or private research centers.
L’archive ouverte pluridisciplinaire HAL, est
destinée au dépôt et à la diffusion de documents
scientifiques de niveau recherche, publiés ou non,
émanant des établissements d’enseignement et de
recherche français ou étrangers, des laboratoires
publics ou privés.
From globular clusters to the disc: the dual life of our
Galaxy
Alejandra Recio-Blanco
To cite this version:
Alejandra Recio-Blanco. From globular clusters to the disc: the dual life of our Galaxy. Astronomy
and Astrophysics - A&A, EDP Sciences, 2018, 620, pp.A194. �10.1051/0004-6361/201833179�.
�hal-03009250�
https://doi.org/10.1051/0004-6361/201833179 c ESO 2018
Astronomy
&
Astrophysics
From globular clusters to the disc: the dual life of our Galaxy
Alejandra Recio-Blanco
Université Côte d’Azur, Observatoire de la Côte d’Azur, CNRS, Laboratoire Lagrange, France e-mail: arecio@oca.eu
Received 6 April 2018/ Accepted 25 October 2018
ABSTRACT
The halo and disc globular cluster population can be used as a tracer of the primordial epochs of the Milky Way formation. In this work, literature data of globular clusters ages, chemical abundances, and structural parameters are studied, explicitly focussing on the origin of the known split in the age-metallicity relation (AMR) of globular clusters. When the α-element abundances, which are less strongly affected by the internal light-element spread of globular clusters (Si, Ca), are considered, a very low observational scatter among metal-poor clusters is observed. A plateau at [SiCa/Fe] ∼ 0.35 dex, with a dispersion of only 0.05 dex (including abundance errors) is observed up to a metallicity of about −0.75 dex. Only a few metal-poor clusters in this metallicity interval present low [SiCa/Fe] abundances. Moreover, metal-rich globular clusters show a knee in the [α/Fe] vs. [Fe/H] plane around [Fe/H] ∼ −0.75 dex. As a consequence, if a substantial fraction of galactic globular clusters has an external origin, they have to be mainly formed either in galaxies that are massive enough to ensure high levels of α-element abundances even at intermediate metallicity, or in lower mass dwarf galaxies accreted by the Milky Way in their early phases of formation. Finally, clusters in the metal-poor branch of the AMR present an anti-correlation of [SiCa/Fe] with the total cluster magnitude, while this is not the case for metal-rich branch clusters. In addition, this lack of faint high-α clusters in the young metal-poor population is in contrast with what is observed for old and more metal-poor clusters, possibly reflecting a higher heterogeneity of formation environments at lower metallicity. Accretion of high-mass satellites, as a major contribution to the current Milky Way globular cluster system both in the metal-poor and the metal-intermediate regime is compatible with the observations.
Key words. globular clusters: general – Galaxy: halo – Galaxy: stellar content
1. Introduction
In the era of Milky Way surveys, photometric, spectroscopic, and astrometric data for large numbers of stars are rapidly changing our view of the Galaxy. The fingerprints of different galactic evo-lutionary processes can now be revealed in the chemodynamical characteristics of the stellar populations, with databases increas-ing every day. The isolated, time-frozen snapshots of separated galactic components today become a moving picture that pro-gressively unveils the Milky Way history. In this context, the comparative analysis of what looked like, in principle, different populations (e.g. the halo and the disc) is crucial to detect the signatures of major evolutionary events that globally affect the Galaxy formation.
Globular clusters (GC) have always been a key population for Galactic archaeology studies. They are witnesses of the ancient times of the Milky Way history, with ages spanning over five gigayears and overlapping the halo and the primordial disc formation. The galactic GC system is therefore at the cross-roads of two key Milky Way stellar populations, and it is precisely this characteristic that this analysis wishes to highlight.
Moreover, GC formation points out the fundamental ques-tion of galaxy in situ vs. ex situ, or accreques-tion formaques-tion. In sim-ulations, the in situ and/or ex situ origin of a population can be tagged and tracked separately. However, the situation is much more complex in observations. The distinction between GCs that formed in situ and those formed in another galaxy that were sub-sequently accreted is blurred when detailed physical processes are taken into consideration. For instance, clumpy dissipative collapse, inflowing of cold gas into a turbulent gas disc, mergers
of gas-rich galaxies originating in situ formation, etc. are pro-cesses that highlight the weakness of a sharp classification into in situ vs. accretion scenarii.
In recent years, several studies have analysed the proper-ties of the Galactic GC age-metallicity relation (AMR). First of all, the increase in age dispersion as a function of the metallic-ity has been noted (e.g.Buonanno et al. 1998;Rosenberg et al. 1999;VandenBerg 2000;Salaris & Weiss 2002;De Angeli et al. 2005). Later on, Marín-Franch et al.(2009), Forbes & Bridges
(2010), andDotter et al. (2011) reported that the AMR exhib-ited a split, with one sequence of old clusters at all metallicities, and another sequence of intermediate-metallicity clusters. GC accretion has currently been invoked to explain the spread of the AMR.
More recently,Leaman et al.(2013) used the age estimates of VandenBerg et al.(2013) to reveal that the AMR bifurcates at [Fe/H] ∼ −1.8 dex, with clusters having halo type or disc-like orbits that populate different branches.Leaman et al.(2013) sug-gested that the metal-rich branch of the AMR consists of clus-ters that formed in situ in the disc, while the metal-poor clusclus-ters could have been formed in relatively low-mass (dwarf) galax-ies and later accreted by the Milky Way. More generally, it is currently assumed that metal-rich GCs are mainly an in situ population because the stellar components of massive early-type galaxies and their red GCs share many physical properties (e.g.
Pota et al. 2013). In this sense, metal-poor GCs seem to be better candidates for accretion.
Nevertheless, the real observational situation is much more complex. In particular, radial chemical gradients have been detected in several GC systems (e.g. Harris 2009), being
A&A 620, A194 (2018) probably similar for both metal-rich and metal-poor GCs
(Forbes et al. 2011). Although these gradients appear to be related with some sort of in situ formation, the invoked scenario should be able to explain them, regardless of which scenario it is. In parallel, many clear signatures of accretion in the halo have been revealed, and the Sagittarius dwarf galaxy and its associ-ated streams and GCs is an outstanding example of it.
From the point of view of galactic disc formation, the ques-tion of the in situ vs. accreques-tion contribuques-tion is a key topic as well. In particular, the thick- or thin-disc bimodality has been offered to be explained by either accretion processes such as minor mergers (e.g. Villalobos & Helmi 2008) or gas infall (Chiappini et al. 1997), or by poor internal secular processes such as radial migration (e.g.Schönrich & Binney 2009). In this sense, the apparent membership of many metal-rich GCs to the galactic thick disc should once again be linked to these disc for-mation mechanisms.
In this work, I address the question of the in situ vs. accretion GC formation by focussing on the split of the AMR: are there signs of accretion in the chemical properties of the clusters, and what is their link with the AMR? How do other properties such as the cluster total luminosity vary in the different features of the AMR? What is the transition between the halo and the disc chemical properties? It is important to note that the complex for-mation and disruption mechanisms analysed through theory and simulations (for an extensive review, seeForbes et al. 2018) hin-der the interpretation of present-day GC properties.
With these caveats in mind, literature data of GCs ages, chemical abundances, and structural parameters are studied here in the perspective of the bifurcated age-metallicity relation. In Sect. 2 the observational data are presented. Section 3 com-pares the GC age-metallicity relation with that of local disc stars. Section4explores the α−element abundances of GCs in relation with the AMR properties. Section5presents an analysis of the absolute magnitude distribution of the clusters. The conclusions are presented in Sect.6.
2. Observational data of GCs and disc stars
This work is based on literature data for the GC analysis and on data from the AMBRE Project (e.g.de Laverny et al. 2012) for the galactic disc comparison sample.
Table1presents the complete list of parameters and chemical abundances for the GCs considered in this work. In particular, the following compilations have been used:
– Age estimates have been taken from the homogeneous sam-ple ofVandenBerg et al.(2013), completed byLeaman et al.
(2013) using the same procedure.
– The [Fe/H] abundance corresponds to the Carretta et al.
(2009a) scale.
– The total luminosity has been taken from the most recent version of the Harris catalogue (Harris 1996).
– The mean abundance of α−elements with respect to iron, in particular [Mg/Fe], [Si/Fe], [Ca/Fe], and [Ti/Fe], have been taken where possible fromCarretta et al.(2009b) and other papers of the same group (50% of the sample), and other-wise, from the most recent estimate from the literature (cf. Table 1, Col. 7)1.
For the local disc comparison sample, the stars included in the AMBRE Project data have been considered. In particu-lar, the AMBRE:HARPS sample of De Pascale et al. (2014)
1 Absolute errors in the abundances for this heterogeneous sample
from the literature can be of the order of 0.1 dex.
was used. The corresponding [Fe/H] and [Mg/Fe] are those of Mikolaitis et al. (2017)2, while the ages are taken from
Hayden et al.(2017) and were determined using Gaia DR1 par-allaxes (Lindegren et al. 2016). It is worth noting that possi-ble systematic differences between field stars and GCs could be present in the chemical abundances and the ages because of the different assumptions made in their analysis by different groups.
3. Age-metallicity relation
Figure 1 shows the age-metallicity relation found by
Leaman et al. (2013), colour-coded following a three-group classification: old metal-poor clusters (black), clusters populat-ing the metal-rich branch of the AMR split (red), and clusters populating the metal-poor branch of the AMR (blue). This three-groups classification is based on the following considerations: i) isolate the metal-rich branch including its oldest clusters; ii) identify the metal-poor branch clusters that are younger than the spread of the age plateau (ranging from 13 to 12 Gyr), and iii) define a separate class for the oldest metal-poor clusters in the AMR plateau. This arbitrary classification is established for analysis purposes. It allows me to generally compare the properties of the clusters in the different features of the AMR (but see also Kruijssen et al. 2018, for a physically motivated separation by accreted galaxy mass in this parameter space). In addition, as shown in the following sections, the conclusions of the analysis are not influenced by slight modifications of the three groups.
As noted in the Introduction, the metal-rich (red) group is generally considered to be formed in situ and to be associated with the galactic disc. The young metal-poor (blue) group and at least a fraction of the old metal-poor (black) group are assumed to have an accretion origin. This classification into three groups is used in the following sections to compare the chemodynamical and structural parameters of the clusters in these groups and with respect to the local disc field stars.
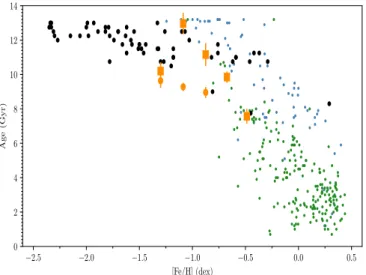
First of all, Fig. 2 again shows the Leaman et al. (2013) AMR (black points) together with the local thick disc (light blue points) and the local thin disc AMRs (green points) from the AMBRE sample. For comparison purposes, the oldest age limit of the field sample was corrected to be in agreement with the GC one (using a constant shift of 1.5 Gyr that can be explained by modelling-dependent age biases).
On one hand, Fig. 2 shows that the metal-rich branch of the GC AMR bifurcation partially overlaps the locus of thick discs. This suggests that these GCs might have formed in situ during the first epochs of disc formation, in agreement with the
Leaman et al.(2013) suggestion of a disc classification of those objects. On the other hand, the metal-poor branch clusters are, as expected, much more metal poor than the thin-disc clusters, with only two clusters (Pal 12 and Ter 7) overlapping the locus of the thin disc AMR.
To better understand if a link can be established between the two GC branches and the disc bimodality, the homogeneous sample of 67 halo stars investigated bySchuster et al.(2012) was included in the plot as orange points. AfterNissen & Schuster
(2010) revealed the existence of low-α halo stars, a series of papers of the same group have explored their physical prop-erties in detail, comparing them to canonical high-α halo stars (see also the recent work ofHayes et al.(2018). This confirmed
2 The errors in the abundances are around 0.06 dex (Mikolaitis et al.
2017, Table 4, lower panel). A194, page 2 of9
Table 1. Adopted parameters for the GCs.
Cluster [Fe/H] Age [SiCa/Fe] [α/Fe] [Mg/Fe] nb Ref. α−abundance MV
NGC 104 −0.76 11.75 ± 0.25 0.357 0.414 0.52 11 Carretta et al.(2009b) −9.00 NGC 288 −1.32 11.50 ± 0.38 0.391 0.379 0.45 10 Carretta et al.(2009b) −6.74 NGC 362 −1.30 10.75 ± 0.25 0.290 0.270 0.33 92 Carretta et al.(2013) −8.41 NGC 1261 −1.27 10.75 ± 0.25 0.125 0.150 0.20 3 Filler et al.(2012) −7.81 NGC 1851 −1.18 11.00 ± 0.25 0.355 0.308 0.37 119 Carretta et al.(2011) −8.33 NGC 2808 −1.18 11.00 ± 0.38 0.310 0.268 0.20 12 Carretta et al.(2009b) −9.39 NGC 3201 −1.51 11.50 ± 0.38 0.298 0.249 0.34 13 Carretta et al.(2009b) −7.46 NGC 4147 −1.78 12.25 ± 0.25 0.43 0.390 0.42 18 Villanova et al.(2016) −6.16 NGC 4590 −2.27 12.00 ± 0.25 0.331 0.282 0.35 13 Carretta et al.(2009b) −7.35
NGC 4833 −1.89 12.50 ± 0.50 0.405 0.333 0.37 78 Carretta et al.(2014a) −8.16
NGC 5024 −2.06 12.25 ± 0.25 0.350 0.300 0.33 16 Mészáros et al.(2015) −8.70 NGC 5053 −2.30 12.25 ± 0.38 0.385 0.385 1 Sbordone et al.(2015) −6.72 NGC 5272 −1.50 11.75 ± 0.25 0.340 0.382 0.61 33 Carretta et al.(2009b) −8.93 NGC 5286 −1.70 12.50 ± 0.38 0.36 0.407 0.55 62 Marino et al.(2015) −8.61 NGC 5466 −2.31 12.50 ± 0.25 0.275 0.238 0.277 3 Lamb et al.(2015) −6.96 NGC 5904 −1.33 11.50 ± 0.25 0.340 0.316 0.41 14 Carretta et al.(2009b) −8.81 NGC 5927 −0.29 10.75 ± 0.38 0.090 0.128 0.230 56 Recio-Blanco et al.(2017) −7.80 NGC 5986 −1.63 12.25 ± 0.75 0.300 0.284 25 Johnson et al.(2017) −8.44 NGC 6101 −1.98 12.25 ± 0.50 −6.91 NGC 6121 −1.18 11.50 ± 0.38 0.470 0.439 0.55 14 Carretta et al.(2009b) −7.20 NGC 6144 −1.82 12.75 ± 0.50 −6.75 NGC 6171 −1.03 12.00 ± 0.75 0.470 0.429 0.51 5 Carretta et al.(2009b) −7.13 NGC 6205 −1.58 12.00 ± 0.38 0.420 0.378 0.44 53 Carretta et al.(2009b) −8.70 NGC 6218 −1.33 13.00 ± 0.50 0.387 0.389 0.52 11 Carretta et al.(2009b) −7.32 NGC 6254 −1.57 11.75 ± 0.38 0.312 0.320 0.49 14 Carretta et al.(2009b) −7.48 NGC 6304 −0.37 11.25 ± 0.38 −7.32 NGC 6341 −2.35 12.75 ± 0.25 0.275 0.194 0.13 47 Mészáros et al.(2015) −8.20 NGC 6352 −0.62 10.75 ± 0.38 0.165 0.235 0.47 9 Feltzing et al.(2009) −6.48 NGC 6362 −1.07 12.50 ± 0.25 0.29 0.33 0.36 2 Gratton(1987) −6.94 NGC 6366 −0.59 11.00 ± 0.50 0.275 0.290 0.29 5 Johnson et al.(2016) −5.77 NGC 6397 −1.99 13.00 ± 0.25 0.309 0.312 0.46 13 Carretta et al.(2009b) −6.63 NGC 6426 −2.15 12.25 ± 0.25 0.37 0.345 0.44 4 Hanke et al.(2017) −6.69 NGC 6496 −0.46 10.75 ± 0.38 −7.23 NGC 6535 −1.79 12.75 ± 0.50 0.365 0.348 0.478 30 Bragaglia et al.(2017) −4.75
NGC 6541 −1.82 12.50 ± 0.50 0.436 0.377 0.35 3 Lee & Carney(2002) −8.37
NGC 6584 −1.50 11.75 ± 0.25 −7.68 NGC 6624 −0.42 11.25 ± 0.50 −7.49 NGC 6637 −0.59 11.00 ± 0.38 −7.64 NGC 6652 −0.76 11.25 ± 0.25 −6.68 NGC 6656 −1.70 12.50 ± 0.50 0.37 0.34 0.39 35 Marino et al.(2011) −8.50 NGC 6681 −1.62 12.75 ± 0.38 0.43 0.41 0.52 9 O’Malley et al.(2017) −7.11
NGC 6715 −1.44 11.75 ± 0.50 0.34 0.285 0.28 76 Carretta et al.(2010a) −10.01
NGC 6717 −1.26 12.50 ± 0.50 −5.66 NGC 6723 −1.10 12.50 ± 0.25 0.33 0.28 0.23 7 Rojas-Arriagada et al.(2016) −7.84 NGC 6752 −1.55 12.50 ± 0.25 0.386 0.366 0.500 14 Carretta et al.(2009b) −7.73 NGC 6779 −2.00 12.75 ± 0.50 −0.10 1 Khamidullina et al.(2014) −7.38 NGC 6791 0.29 8.3 ± 0.30 0.010 0.092 0.124 32 Linden et al.(2017) NGC 6809 −1.93 13.00 ± 0.25 0.366 0.323 0.470 14 Carretta et al.(2009b) −7.55 NGC 6838 −0.82 11.00 ± 0.38 0.344 0.398 0.490 12 Carretta et al.(2009b) −5.60 NGC 6981 −1.48 11.50 ± 0.25 −7.04 NGC 7006 −1.46 11.25 ± 0.25 0.350 105 Kirby et al.(2008) −7.68 NGC 7078 −2.33 12.75 ± 0.25 0.290 0.303 0.450 13 Carretta et al.(2009b) −9.17 NGC 7089 −1.66 11.75 ± 0.25 0.135 0.185 0.410 94 Recio-Blanco et al.(2017) −9.02 NGC 7099 −2.33 13.00 ± 0.25 0.309 0.331 0.51 10 Carretta et al.(2009b) −7.43
Arp 2 −1.74 12.00 ± 0.38 0.32 0.31 0.38 2 Mottini et al.(2008) −5.29
Pal 12 −0.81 9.0 ± 0.38 −0.035 −0.045 0.08 4 Cohen(2004) −4.48
Ter 8 −2.34 13.00 ± 0.38 0.220 0.240 0.47 7 Carretta et al.(2014b) −5.05
Ter 7 −0.45 7.75 ± 0.50 0.035 −0.020 −0.11 5 Sbordone et al.(2005) −5.05
IC 4499 −1.62 11.25 ± 0.25 −7.33
Rupr 106 −1.78 10.75 ± 0.25 −0.020 0.000 −0.02 9 Villanova et al.(2013) −6.35
Pyxis −1.20 10.50 ± 0.25 −5.75
Notes. Metallicity (Col. 2, in dex), age (Col. 3, in Gyr), α−element chemical abundances in dex (mean of [Si/Fe] and [Ca/Fe] in Col. 4; mean of [Si/Fe], [Ca/Fe], [Ti/Fe], and [Mg/Fe] in Col. 5; [Mg/H] in Col. 6), number of observed stars (Col. 7) and their corresponding reference (Col. 8), and absolute magnitude (Col. 9).
A&A 620, A194 (2018) −2.5 −2.0 −1.5 −1.0 −0.5 0.0 0.5 [Fe/H] (dex) 7 8 9 10 11 12 13 14 Age (Gyr)
Fig. 1. Leaman et al.(2013) age-metallicity relation, colour-coded to define three groups of clusters: old poor clusters (black), metal-rich branch clusters (red), and metal-poor branch (blue) clusters.
the existence of two chemically distinct halo populations in the field halo stars. In particular, Schuster et al. (2012) inves-tigated the mean ages of a sample of high-α and low-α stars as a function of the metallicity (cf. their Table 2). Figure 2
presents these mean values for the high-α stars as orange squares and for the low-α ones as orange circles (the same shift of 1.5 Gyr as was applied to the disc field sample was used). The error bar corresponds to the reported standard deviation at each metallicity bin. TheSchuster et al.(2012) stars again present a bimodality. Low-α halo objects seem to approximately lie along the metal-poor GC branch and certainly below the metal-rich branch and the thick-disc locus, suggesting a connection with the thin-disc locus at higher metallicities. Nevertheless, the lack of objects in the younger part of the AMR bimodality between −1.2 and −0.8 dex prevents me from robustly concluding about the connection between the metal-poor branch GCs and thin-disc GCs. The high-α halo stars, as already known, more or less overlap the thick-disc sequence and the GC metal-rich sequence.
Generally speaking, the GC AMR bimodality seems to have some overlap with the Galactic disc AMR bimodality, especially during the thick-disc formation phase. However, the inhomo-geneity of the plot, which includes three different sets of data (clusters, disc, and field halo stars), each of it with its biases in age and metallicity, prevents a conclusion on the relations between them. Despite this, Fig.2 shows that a bimodality of the AMR is present in the three galactic populations. A more homogeneous data set that includes clusters, field halo stars, and disc stars needs to be analysed to clearly conclude on the sub-structure of the galactic AMR.
Finally, it is also important to point out that substructures in the age-metallicity plane, such as the above discussed bimodal-ities, can be created by different evolutionary processes that dif-ferently different structural galactic components independently. For instance, accretion from dwarf galaxies in the halo or the disc, gas infall or radial outflows in the disc, radially dependent star formation rates, etc. might all be responsible for an AMR split in a way that the overlap of the clusters and disc features would only be result of a degeneracy in the age-metallicity domain and not the expression of a common evolutionary path. Despite this caveat, the comparative analysis of different galactic components is extremely useful to allow a general vision of the Milky Way evolution and of the complex relations between its different stellar populations.
−2.5 −2.0 −1.5 −1.0 −0.5 0.0 0.5 [Fe/H] (dex) 0 2 4 6 8 10 12 14 Age (Gyr)
Fig. 2. Leaman et al.(2013) AMR (black points) together with the local thick disc AMR (light blue points) and the local thin disc AMR (green points) fromHayden et al.(2017) and the mean values for the low-α (orange circles) and high-α (orange squares) halo field stars investigated bySchuster et al.(2012; orange).
4.
α−
element abundances and the GC AMR bifurcationIn this section the mean α-element abundance of GCs is exam-ined in relation with the AMR bifurcation. It is well known that the [α/Fe] chemical abundance ratio is an important indicator of the chemical evolution of a system. In particular, and accord-ing to the time-delay model (Tinsley 1979;Matteucci & Greggio 1986), the initially enhanced α-abundance levels with respect to iron start to strongly decline with [Fe/H] after the supernovae Ia explosion rate reaches maximum.
On one hand, this produces a knee in the [α/Fe] vs. [Fe/H] trend whose location provides constraints on the star formation rate during the early star formation of a system (e.g. de Boer et al. 2014). As a consequence, the knee loca-tion also depends on the system total mass: the less massive the system, the lower the [Fe/H] value of the [α/Fe] turnover. Observations of dwarf galaxies of different masses have con-firmed this dependence. A low-mass galaxy like Carina shows a very metal-poor knee ([Fe/H]= −2.7 ± 0.3 dex), while the more massive Sculptor presents a slightly more metal-rich knee ([Fe/H]= −1.9 ± 0.1 dex,McConnachie 2012). Finally, the knee of higher mass galaxies, like Sagittarius can reach metallici-ties as high as [Fe/H]= −1.27 ± 0.05 dex (de Boer et al. 2014). In addition, the Milky Way galaxy has a knee in the range −1.0 dex to −0.5 dex, depending on the authors (de Boer et al. 2014;Rojas-Arriagada et al. 2017)
On the other hand, the initial mass function (IMF) of the system influences the primordial [α/Fe] and therefore the [α/Fe] abundance of the low-metallicity plateau. Finally, the [α/Fe] is a fairly good age indicator for [Fe/H] values higher than the knee value (e.g. Haywood et al. 2013; Hayden et al. 2017).
Figure 3 presents [Mg/Fe] as a function of [Fe/H] for i) theLeaman et al.(2013) GCs with available chemical informa-tion, using the colour code of Fig. 1, ii) the AMBRE thick-and thin-disc comparison sample, thick-and iii) the low-α thick-and high-α halo field stars investigated bySchuster et al.(2012). For clar-ity, the same colour code as in Fig.2is used. Clearly, the GCs show a bimodal behaviour for metallicities higher than about A194, page 4 of9
−2.5 −2.0 −1.5 −1.0 −0.5 0.0 0.5 [Fe/H] (dex) −0.2 −0.1 0.0 0.1 0.2 0.3 0.4 0.5 0.6 [Mg/F e] (dex)
Fig. 3.[Mg/Fe] abundance as a function of [Fe/H] for theLeaman et al. (2013) GCs, the disc comparison sample, and theSchuster et al.(2012) halo field stars. The colour codes are those of Figs. 1and 2for the clusters, the disc, and the halo field stars.
−1.5 dex, although a large scatter is present. Moreover, this bifur-cation separates the two cluster populations that were identified in the AMR split: clusters in the metal-rich branch (red points in Figs. 1 and3) seem to have higher [Mg/Fe] values than clus-ters in the metal-poor branch (blue points in Figs. 1 and 3). This would be in agreement with a possible accreted origin of the metal-poor young clusters, as suggested by Leaman et al.
(2013). In addition, when the two disc sequences are considered, the thick-disc sequence presents [Mg/Fe] abundances that are compatible with those of the metal-rich branch clusters, again in agreement with a disc origin for these clusters. The thin disc, for its part, shows higher [Mg/Fe] abundances than the youngest GCs in the metal-poor branch, although both sequences seem to join at around [Fe/H] ∼ −1.0 dex. Finally, the halo field low-α stars occupy the same locus as the more metal-rich clusters of the metal-poor branch, while the [Mg/Fe] abundances of high-α halo field stars are more similar to those of the thick disc and the metal-rich branch clusters (declining for metallicities higher than about −0.75 dex). As a consequence, the three studied pop-ulations (GCs, disc, and halo field stars) and their sub-classes (metal-rich and metal-poor branch clusters, thick and thin disc, and high- and low-α halo stars) show similar overlaps in the AMR and in the [Mg/Fe] vs. [Fe/H] planes. It has to be stressed, nevertheless, that the disc, the GC, and the halo sequences are plotted together mainly for a general comparison, as data biases between the two data sets prevent a robust conclusion on their links. In addition, the origin of the Schuster et al. (2012) halo stars is under debate, so that their abundance patterns alone do not provide evidence whether the halo and its GCs formed in situ or ex situ.
Furthermore, only the mean chemical abundances for each cluster are taken into account in Fig. 3, neglecting the well-known internal light element abundance scatter. GC star forma-tion is currently believed to be bimodal, with a second generaforma-tion of stars born from the ejecta of the primeval generation (e.g.
Carretta et al. 2009b). There is evidence that the Mg-Al cycle is active in cluster polluters, causing the so-called star-to-star anti-correlation between the Mg and the Al abundances. In this sense, part of the scatter observed in the GC data in Fig. 3
could come from this internal spread in the Mg abundances. To solve this problem, Fig. 4 shows the [α/Fe] vs. [Fe/H] of the
Leaman et al.(2013) GCs, considering four different α-elements
−2.5 −2.0 −1.5 −1.0 −0.5 0.0 0.5 [Fe/H] (dex) −0.2 −0.1 0.0 0.1 0.2 0.3 0.4 0.5 0.6 [MgSiCaTi/F e] (dex) 7 8 9 10 11 12 13 14 Age (Gyr)
Fig. 4. Mean [α/Fe] abundance vs. metallicity for theLeaman et al. (2013) GCs, considering four different α-elements (Mg, Si, Ca, and Ti). The points are colour-coded by cluster age.
(Mg, Si, Ca, and Ti). The points are colour-coded by their age. Clearly, the scatter in the more metal-poor clusters is reduced with respect to Fig.3. In addition, the bifurcation of the abun-dances at about [Fe/H] ∼ −1.5 dex, although still present, seems to be less clear, with several metal-poor branch clusters having high [α/Fe], compatible with those of the older metal-poor pop-ulation.
Finally, Fig. 5 shows the mean [α/Fe] abundances consid-ering only Si and Ca. On one hand, this allows avoiding the scatter due to the Mg-Al anti-correlation, and on the other hand, it excludes Ti, which is not a pure α-element and is also pro-duced in great abundance by Type Ia supernovae. The Si and Ca mean abundance clearly presents a less strongly scattered high-α sequence of clusters from −2.5 dex to −1.0 dex. The mean value of the [SiCa/Fe] of this sequence is 0.35 dex, with only 0.05 dex of standard deviation. This observational scatter is perfectly within the errors of the abundance estimate, especially for an inhomogeneous sample taken from the literature. As a way of comparison, the dispersion for the same clusters in the range −2.5 dex ≤ [Fe/H] ≤ −1.0 dex is 0.11 dex in [Mg/Fe] and [α/Fe]. Moreover, Fig.5shows a knee around ∼−0.75 dex, from which a declining sequence of abundances starts that is similar to the thick-disc sequence. Finally, only a few metal-poor clus-ters present low [SiCa/Fe] abundances (Rupr 106, NGC 7089, NGC 1261, and Pal 12).
To facilitate comparison between the [SiCa/Fe] abundance distribution and the AMR cluster groups, Fig.6shows the same colour-coding as Fig.1. Interestingly, the majority of the metal-poor branch clusters present high values of the [SiCa/Fe] abun-dance, equal to (within the error estimates) those of the oldest in situ population and those of the co-eval clusters in the metal-rich branch. To facilitate interpretation of this result, Fig. 6
includes the knee positions of the Milky Way (grey verti-cal band) and those of three different dwarf galaxies follow-ing de Boer et al.(2014) and Tolstoy et al.(2009): Sagittarius, Sculptor, and Carina.
Several conclusions can be inferred from Figs. 5 and 6. First of all, as I described above, the metal-rich branch GCs (in red) follows the Milky Way thick-disc sequence, with a knee at about [Fe/H] ∼ −1.0 dex. Secondly, the majority of the metal-poor clusters have high [SiCa/Fe] abundances with a very low scatter. This indicates that if they have been formed in dwarf galaxies and were subsequently accreted by
A&A 620, A194 (2018) −2.5 −2.0 −1.5 −1.0 −0.5 0.0 0.5 [Fe/H] (dex) −0.2 −0.1 0.0 0.1 0.2 0.3 0.4 0.5 0.6 [SiCa/F e] (dex) 7 8 9 10 11 12 13 14 Age (Gyr)
Fig. 5.Mean [α/Fe] abundances as a function of metallicity for Si and Ca alone. The age colour-code is the same as in Fig.4.
the Milky Way, two possibilities exist: 1) they could all have been formed in massive dwarf galaxies like Sagittarius, which presents a knee in the intermediate-metallicity regime ([Fe/H] at about −1.2 dex), or 2) they could have been formed in dwarf galaxies with a variety of masses, but have been accreted very early (especially the low-mass dwarfs), before the onset of Type I supernovae causes the decrease in [SiCa/Fe] ratio. Conversely, there is also room for an in situ formation of all the metal-poor clusters in the Milky Way halo, which has a metal-rich [SiCa/Fe] knee.
Finally, four GCs that are known to be non-monometallic, that is, to have an iron abundance spread (Grebel 2016) (NGC 6656, NGC 6715, NGC 7098, and Terzan 7), are labelled in Fig.6with an open black circle. Two of them, Terzan 7 and NGC 7089, clearly present low [SiCa/Fe] abundances, which is an unmistakable sign of accretion. In addition, the cluster NGC 6715 (M 54), which is known to be embedded at the centre of the Sagittarius dwarf galaxy, presents a high [SiCa/Fe] ratio that is compatible with the high-metallicity knee of the massive Sagittarius.
In conclusion, when α-element abundances (not disturbed by the internal scatter of GCs) are considered, the hypothesis of an accretion origin for the metal-poor branch clusters seems to be restricted, with only a few exceptions, to the most massive dwarf galaxies and to early accretion of low-mass dwarfs. On the other hand, and based on the α-element abundances alone, their in situ formation cannot be ruled out. Their α-abundance patterns are indeed also compatible with the isolated chemical evolution of a high-mass galaxy such as the Milky Way.
5. Total luminosity distributions
This section analyses the total visible luminosity of the clus-ters, taken from the most recent version of the Harris catalogue (Harris 1996). The luminosities are compared with the different groups defined in Sect.3 from the AMR. This exercise is nev-ertheless challenging because of the complex physics involved in the formation and disruption of GCs (e.g.Forbes et al. 2018), which hinders the interpretation of the cluster luminosity func-tion. On one hand, the luminosity function of GCs has histor-ically been considered universal and was used as a secondary distance indicator. Recent results have revealed weak depen-dences on Hubble type, mass, environment, and dynamical his-tory of the host galaxy (e.g. Rejkuba 2012;Harris et al. 2014),
−2.5 −2.0 −1.5 −1.0 −0.5 0.0 0.5 [Fe/H] (dex) −0.2 −0.1 0.0 0.1 0.2 0.3 0.4 0.5 0.6 [SiCa/F e] (dex)
Carina Sculptor Sagittarius MW
Fig. 6.Same as Fig.5, but using the colour code of Fig.1to distinguish the different groups of clusters in the AMR. The knees of the Milky Way, Sagittarius, Sculptor, and Carina are presented as vertical bands in grey, pink, green, and blue, respectively.
which affect the turnover luminosity (where the luminosity func-tion peaks), only to second order. On the other hand, the lumi-nosity function of Local Group dwarf spheroidals and that of the outer halo Milky Way cluster population are found to con-tain fainter GCs (van den Bergh 2006;van den Bergh & Mackey 2004;Carretta et al. 2010b).
With these challenges in mind, the luminosity distribution of the clusters in theLeaman et al. (2013) sample can still be studied to report similarities or differences depending on age and or metallicity. It is important to note that the great majority of bulge clusters are not included in theLeaman et al.(2013) data base. This biases the analysis of the metal-rich population and excludes very high density environments.
First of all, the top panel of Fig.7 shows the (absorption-corrected) MV for the old GCs in the AMR plateau (grey
his-togram) compared to that of the metal-poor (blue histograms) and metal-rich branch clusters (shown in red). As it is difficult to infer the corresponding mass loss of each GC that is lost in the stars that have escaped the cluster, the three histograms in the top panel were smoothed through a kernel density estima-tion (KDE) technique. To this purpose, two different λ covari-ance factors were used: 0.2 (middle panel of Fig. 7) and 0.5 (lower panel). Finally, a Kolmogorov–Smirnov (K-S) test was performed to compare the three distributions. When the MV
dis-tribution of the metal-poor branch young GCs (shown in blue) is compared that of the metal-poor old GCs (shown in grey), the K-S p-value is 0.65, showing that both distributions are very similar. This result highlights the fact that no particular discon-tinuity in the typical luminosity of the clusters seems to exist among the metal-poor clusters, even considering an age range of at least 3 Gyr. Conversely, metal-rich branch GCs (in red) are generally less luminous than the others: the total magnitudes of 80% of the metal-rich branch clusters are fainter than −8.0, while this number decreases to 50% and 55% for the other two subpopulations I analysed (metal-poor branch and old clusters). The K-S p-value that compares the two distributions is 0.33, which quantifies the lower degree of similarity between the disc-associated clusters and the old halo discs. Nevertheless, a final word of caution has to be said about two aspects of this analy-sis: i) there is not necessarily a mass dependence if a difference in Mv is seen because of the difficult interplay between clus-ter mass and luminosity, which depends on multiple parameclus-ters A194, page 6 of9
−10 −9 −8 −7 −6 −5 −4 0.0 0.2 0.4 0.6 0.8 −10 −9 −8 −7 −6 −5 −4 0.0 0.2 0.4 0.6 −10 −9 −8 −7 −6 −5 −4 MV 0.0 0.1 0.2 0.3 0.4
Fig. 7.Top panel: normalised MVdistribution of old in situ GCs (grey
histogram) compared to that of the metal-poor branch clusters (blue histogram) and that of the metal-rich branch clusters (shown in red). Middleand lower panels: three distributions smoothed through a KDE, with a λ covariance factor of 0.2 and 0.5.
(metallicity, environmental effects, etc.), and ii) the reported K-S p-values are estimated in a regime of relatively low-number statistics.
To further examine the nature of the possible luminosity dis-tribution differences between the clusters subpopulations, Fig.8
explores the chemical dependences on cluster luminosity. The upper panel shows the mean [SiCa/Fe] as a function of the total cluster magnitude, using a colour code with age. On one hand, as I highlighted in the previous section, the majority of the clusters appear in a high-α regime ([SiCa/Fe] ∼ 0.35 dex). No particular tendency with Mv or age appears for these clusters, which offers no additional constraints about their origin (e.g. massive dwarf galaxies, early accretion of low-mass dwarfs or in situ forma-tion). On the other hand, a less densely populated low-α regime ([SiCa/Fe] ≤ 0.20 dex, with a mixture of rich and metal-poor clusters) is also visible and appears to be clearly sepa-rated from the standard high-α regime, especially for the brighter luminosities.
To distinguish the nature of the features seen in the [SiCa/Fe] vs. Mv plane, the lower panel of Fig.8 presents the mean [SiCa/Fe] as a function of the total cluster magnitude with a colour code showing clusters in the AMR metal-poor branch (blue), the metal-rich branch (red) and the old metal-poor pop-ulation (grey). First of all, high-α metal-poor branch clusters (which represent the majority of this population and cover the metallicity regime between about −1.6 dex and −1.1 dex) are all brighter than about Mv ∼ −7 mag. This is not the case for more metal-poor old clusters ([Fe/H]/ −1.5 dex, grey points), which can be as faint as −4.5 mag. As discussed in the previous section, the high-α metal-poor population could have formed in a mix-ture of massive and less massive dwarf galaxies, in contrast to the high-α population at normal metallicity level, whose exter-nal origin requires higher-mass satellites. The greater luminosity range spanned by the old metal-poor clusters with respect to the high-α clusters in the intermediate metallicity range suggests a higher heterogeneity of formation (and eventually, distruption) environments at lower metallicity.
−10 −9 −8 −7 −6 −5 −4 −0.1 0.0 0.1 0.2 0.3 0.4 0.5 0.6 [SiCa/F e] (dex) 7 8 9 10 11 12 13 14 Age (Gyr) −10 −9 −8 −7 −6 −5 −4 Mv −0.1 0.0 0.1 0.2 0.3 0.4 0.5 0.6 [SiCa/F e] (dex)
Fig. 8.Top panel: [α/Fe] abundances as a function of total cluster mag-nitude for Si and Ca alone. Points are colour coded by age. Lower panel: same as the upper panel, but identifying clusters in the AMR metal-poor branch (blue points), the AMR metal-rich branch (red points), and the old metal-poor population (black points). The solid blue and red lines correspond to the linear fit of the metal-poor and the metal-rich branch clusters, respectively. An anti-correlation of the [SiCa/Fe] abundance with the total magnitude (r= −0.59) seems to be present only for metal-poor branch clusters.
Secondly, when the few clusters with [SiCa/Fe] ≤ 0.20 dex are also considered, metal-poor branch clusters present an anti-correlation (r = −0.59, solid blue line) of [SiCa/Fe] with Mv, while this is not the case for metal-rich branch clusters (r = −0.08, solid red line). This difference between the two subpop-ulations is strongly driven by the fact that no faint high-α clus-ters are observed among the metal-poor branch subpopulation, in contrast to the metal-rich branch population. Although the rea-sons for such a difference can be multiple and degenerate, and the number of clusters with available data is not very high, I point out that clusters that are separated in the AMR plane seem di ffer-ent in their chemical properties as well when the low-luminosity regime is considered. The environment in which faint metal-poor branch clusters have formed and evolved could have been sub-ject to lower star formation rate or preferential loss of elements from massive supernova type II than the environment that hosts faint metal-rich branch clusters. These two conditions are com-patible with the formation of the faint metal-poor branch clus-ters in dwarf galaxies, and therefore are compatible also with their accreted origin. In addition, the observed anti-correlation of the [SiCa/Fe] ratio with Mv for metal-poor branch clusters is also puzzling, suggesting that their chemical evolution con-ditions might be different for brighter clusters (higher star for-mation rate or more efficient massive supernova feedback) than for fainter clusters. Although the available data do not allow concluding on this, one possibility would be that more mas-sive dwarfs would host more luminous clusters, as has been sug-gested byvan den Bergh(2006).
A&A 620, A194 (2018)
6. Summary and discussion
Different aspects of the galactic GC populuation are revealed by the analysis of the substructures in the Milky Way GC age-metallicity relation, coupled with chemical abundance infor-mation, the study of the total luminosity distribution, and the comparison with field stars data. First of all, the bimodality in the age-metallicity relation, reported by Leaman et al. (2013), seems to overlap in time with the halo field star bimodal-ity (Schuster et al. 2012) and the thick-thin disc bimodality (Hayden et al. 2017), although the biases between the different datasets prevent us from a detailed conclusion on their relative links.
Secondly, when the α-element abundances, which are less strongly affected by internal light-element spread of GCs, are considered, a very low observational scatter among the metal-poor clusters is observed. A plateau at [SiCa/Fe] ∼ 0.35 dex, with a dispersion of only 0.05 dex, is observed up to a metal-licity of about −0.75 dex. Only a few metal-poor clusters in this metallicity interval (Rupr 106, NGC 7089, NGC 1261 and Pal 12) present low [SiCa/Fe] abundances. Moreover, metal-rich GCs follow the Milky Way thick-disc sequence, with a knee at about [Fe/H] ∼ −0.75 dex. This result places a clear constraint on scenarios of GC formation in the Milky Way. On one hand, if a substantial fraction of galactic GCs has an external origin, they must have formed either in galaxies that were massive enough to ensure high levels of α-element abundances even at interme-diate metallicity (e.g. the Sagittarius dwarf galaxy), or in lower-mass dwarf galaxies that accreted in their early formation phase (before they reached their [α/Fe] vs. [Fe/H] knee). On the other hand, the in situ formation of clusters with high [α/Fe] values is also a plausible explanation.
Finally, the study of the absolute luminosity distribution in the different features of the AMR reveals that the total luminos-ity distributions of old metal-poor GCs in the AMR plateau are similar to those of younger clusters of intermediate metallic-ity. However, when only high-α clusters are considered, old metal-poor clusters seem to span a wider luminosity range than younger clusters of intermediate metallicity. In addition, this lack of faint high-α clusters in the AMR metal-poor branch sub-population also contradicts what is observed for the metal-rich branch population and reinforces the differences between these two AMR branches. Moreover, metal-rich branch clusters are generally less luminous than metal-poor clusters.
In conclusion, although the interpretation of the differently biased data samples is complex and multi-parametric, the analy-sis reported here places simple observational constraints on sce-narios of GC formation and disruption:
– The duplicity of the Milky Way GC population, illustrated by its bifurcated age-metallicity relation, is confirmed by the combined analysis of the [α/Fe] abundances and the total luminosity distributions. Some overlap with the disc popula-tion in the various bimodalities is observed, although com-mon evolutionary paths for the disc and the GC populations are not guaranteed because of the observational biases and the degeneracy in the effects of different physical evolution-ary processes.
– The external origin of metal-poor branch clusters seems rein-forced (or at least not excluded) by the [α/Fe] abundances. – The greater luminosity range that is spanned by the old
poor clusters with respect to the high-α metal-intermediate clusters suggests a higher heterogeneity of formation environments at lower metallicity, which might reflect the contribution of low-mass satellite accretion.
– Accretion of high-mass satellites, as a major contribution to the current Milky Way GC system in the metal-poor and intermediate-metallicity regimes, is compatible with the observations.
Generally speaking, the duality of the GC in situ vs. accre-tion formaaccre-tion scenarios remains only partially unveiled, but the combined analysis of the AMR, the chemical abundances, and the cluster luminosities gives some constraints on the accretion epochs and/or the masses of the accreted objects. Precise dynam-ical data are of course another crucial piece of the puzzle. The Gaiamission, from its second data release, has already started to open new paths of exploration. In particular, several studies have suggested the accretion of a high-mass satellite to which several GCs are associated, which might have built up the halo inner regions and perturbed the primordial disc (Helmi et al. 2018;
Kruijssen et al. 2018; Myeong et al. 2018). Moreover, the age-metallicity relation of halo field stars needs to be studied and placed in relation with the GC AMR in order to confirm a possi-ble, and expected, link between field stars and clusters.
Acknowledgements. I acknowledge financial support from the ANR 14-CE33-014-01. I thank all the people involved in the AMBRE project for the use of the AMBRE:HARPS data as a comparison disc sample. I am sincerely grateful to the anonymous referee of this paper for their careful reading of the work and for all the suggestions for improvement. In particular, their help has been crucial for the results in Sect. 5. I warmly thank Patrick de Laverny for his constant support, personal and professional.
References
Bragaglia, A., Carretta, E., D’Orazi, V., et al. 2017,A&A, 607, A44
Buonanno, R., Corsi, C. E., Pulone, L., Fusi Pecci, F., & Bellazzini, M. 1998,
A&A, 333, 505
Carretta, E., Bragaglia, A., Gratton, R., D’Orazi, V., & Lucatello, S. 2009a,
A&A, 508, 695
Carretta, E., Bragaglia, A., Gratton, R., & Lucatello, S. 2009b,A&A, 505, 139
Carretta, E., Bragaglia, A., Gratton, R. G., et al. 2010a,A&A, 520, A95
Carretta, E., Bragaglia, A., Gratton, R. G., et al. 2010b,A&A, 516, A55
Carretta, E., Lucatello, S., Gratton, R. G., Bragaglia, A., & D’Orazi, V. 2011,
A&A, 533, A69
Carretta, E., Bragaglia, A., Gratton, R. G., et al. 2013,A&A, 557, A138
Carretta, E., Bragaglia, A., Gratton, R. G., et al. 2014a,A&A, 564, A60
Carretta, E., Bragaglia, A., Gratton, R. G., et al. 2014b,A&A, 561, A87
Chiappini, C., Matteucci, F., & Gratton, R. 1997,ApJ, 477, 765
Cohen, J. G. 2004,AJ, 127, 1545
De Angeli, F., Piotto, G., Cassisi, S., et al. 2005,AJ, 130, 116
de Boer, T. J. L., Belokurov, V., Beers, T. C., & Lee, Y. S. 2014,MNRAS, 443, 658
de Laverny, P., Recio-Blanco, A., Worley, C. C., & Plez, B. 2012,A&A, 544, A126
De Pascale, M., Worley, C. C., de Laverny, P., et al. 2014,A&A, 570, A68
Dotter, A., Sarajedini, A., & Anderson, J. 2011,ApJ, 738, 74
Feltzing, S., Primas, F., & Johnson, R. A. 2009,A&A, 493, 913
Filler, D., Ivans, I. I., & Simmerer, J. 2012, AAS Meeting Abstracts, 219, 152.02
Forbes, D. A., & Bridges, T. 2010,MNRAS, 404, 1203
Forbes, D. A., Spitler, L. R., Strader, J., et al. 2011,MNRAS, 413, 2943
Forbes, D. A., Bastian, N., Gieles, M., et al. 2018,Proc. R. Soc. London, Ser. A, 474, 20170616
Gratton, R. G. 1987,A&A, 179, 181
Grebel, E. K. 2016, in Star Clusters and Black Holes in Galaxies across Cosmic Time, eds. Y. Meiron, S. Li, F.-K. Liu, & R. Spurzem,IAU Symp., 312, 157
Hanke, M., Koch, A., Hansen, C. J., & McWilliam, A. 2017,A&A, 599, A97
Harris, W. E. 1996,AJ, 112, 1487
Harris, W. E. 2009,ApJ, 699, 254
Harris, W. E., Morningstar, W., Gnedin, O. Y., et al. 2014,ApJ, 797, 128
Hayden, M. R., Recio-Blanco, A., de Laverny, P., Mikolaitis, S., & Worley, C. C. 2017,A&A, 608, L1
Hayes, C. R., Majewski, S. R., Shetrone, M., et al. 2018,ApJ, 852, 49
Haywood, M., Di Matteo, P., Lehnert, M., Katz, D., & Gomez, A. 2013,A&A, 560, A109
Helmi, A., Babusiaux, C., Koppelman, H. H., et al. 2018,Nature, 563, 85
Johnson, C. I., Caldwell, N., Rich, R. M., Pilachowski, C. A., & Hsyu, T. 2016,
AJ, 152, 21
Johnson, C. I., Caldwell, N., Rich, R. M., et al. 2017,ApJ, 842, 24
Khamidullina, D. A., Sharina, M. E., Shimansky, V. V., & Davoust, E. 2014,
Astrophys. Bull., 69, 409
Kirby, E. N., Guhathakurta, P., & Sneden, C. 2008,ApJ, 682, 1217
Kruijssen, J. M. D., Pfeffer, J. L., Reina-Campos, M., Crain, R. A., & Bastian, N. 2018,MNRAS, in press [arXiv:1806.05680]
Lamb, M. P., Venn, K. A., Shetrone, M. D., Sakari, C. M., & Pritzl, B. J. 2015,
MNRAS, 448, 42
Leaman, R., VandenBerg, D. A., & Mendel, J. T. 2013,MNRAS, 436, 122
Lee, J.-W., & Carney, B. W. 2002,AJ, 124, 1511
Lindegren, L., Lammers, U., Bastian, U., et al. 2016,A&A, 595, A4
Linden, S. T., Pryal, M., Hayes, C. R., et al. 2017,ApJ, 842, 49
Marín-Franch, A., Aparicio, A., Piotto, G., et al. 2009,ApJ, 694, 1498
Marino, A. F., Sneden, C., Kraft, R. P., et al. 2011,A&A, 532, A8
Marino, A. F., Milone, A. P., Karakas, A. I., et al. 2015, MNRAS, 450, 815
Matteucci, F., & Greggio, L. 1986,A&A, 154, 279
McConnachie, A. W. 2012,AJ, 144, 4
Mészáros, S., Martell, S. L., Shetrone, M., et al. 2015,AJ, 149, 153
Mikolaitis, Š., de Laverny, P., Recio-Blanco, A., et al. 2017, A&A, 600, A22
Mottini, M., Wallerstein, G., & McWilliam, A. 2008,AJ, 136, 614
Myeong, G. C., Evans, N. W., Belokurov, V., Sanders, J. L., & Koposov, S. E. 2018,ApJ, 863, L28
Nissen, P. E., & Schuster, W. J. 2010,A&A, 511, L10
O’Malley, E. M., Knaizev, A., McWilliam, A., & Chaboyer, B. 2017,ApJ, 846, 23
Pota, V., Forbes, D. A., Romanowsky, A. J., et al. 2013,MNRAS, 428, 389
Recio-Blanco, A., Rojas-Arriagada, A., de Laverny, P., et al. 2017,A&A, 602, L14
Rejkuba, M. 2012,Ap&SS, 341, 195
Rojas-Arriagada, A., Zoccali, M., Vásquez, S., et al. 2016,A&A, 587, A95
Rojas-Arriagada, A., Recio-Blanco, A., de Laverny, P., et al. 2017,A&A, 601, A140
Rosenberg, A., Saviane, I., Piotto, G., & Aparicio, A. 1999,AJ, 118, 2306
Salaris, M., & Weiss, A. 2002,A&A, 388, 492
Sbordone, L., Bonifacio, P., Marconi, G., Buonanno, R., & Zaggia, S. 2005,
A&A, 437, 905
Sbordone, L., Monaco, L., Moni Bidin, C., et al. 2015,A&A, 579, A104
Schönrich, R., & Binney, J. 2009,MNRAS, 399, 1145
Schuster, W. J., Moreno, E., Nissen, P. E., & Pichardo, B. 2012,A&A, 538, A21
Tinsley, B. M. 1979,ApJ, 229, 1046
Tolstoy, E., Hill, V., & Tosi, M. 2009,ARA&A, 47, 371
van den Bergh, S. 2006,AJ, 131, 304
van den Bergh, S., & Mackey, A. D. 2004,MNRAS, 354, 713
VandenBerg, D. A. 2000,ApJS, 129, 315
VandenBerg, D. A., Brogaard, K., Leaman, R., & Casagrande, L. 2013,ApJ, 775, 134
Villalobos, Á., & Helmi, A. 2008,MNRAS, 391, 1806
Villanova, S., Geisler, D., Carraro, G., Moni Bidin, C., & Muñoz, C. 2013,ApJ, 778, 186
Villanova, S., Monaco, L., Moni Bidin, C., & Assmann, P. 2016,MNRAS, 460, 2351

![Fig. 4. Mean [α/Fe] abundance vs. metallicity for the Leaman et al.](https://thumb-eu.123doks.com/thumbv2/123doknet/13581511.422134/6.892.64.433.121.378/fig-mean-α-fe-abundance-vs-metallicity-leaman.webp)


