HAL Id: hal-03103740
https://hal.archives-ouvertes.fr/hal-03103740
Submitted on 8 Jan 2021
HAL is a multi-disciplinary open access
archive for the deposit and dissemination of
sci-entific research documents, whether they are
pub-lished or not. The documents may come from
teaching and research institutions in France or
abroad, or from public or private research centers.
L’archive ouverte pluridisciplinaire HAL, est
destinée au dépôt et à la diffusion de documents
scientifiques de niveau recherche, publiés ou non,
émanant des établissements d’enseignement et de
recherche français ou étrangers, des laboratoires
publics ou privés.
Shivangi Shree, Ioannis Paradisanos, Xavier Marie, Cédric Robert, Bernhard
Urbaszek
To cite this version:
Shivangi Shree, Ioannis Paradisanos, Xavier Marie, Cédric Robert, Bernhard Urbaszek. Guide to
optical spectroscopy of layered semiconductors. Nature Reviews Physics, 2020,
�10.1038/s42254-020-00259-1�. �hal-03103740�
Guide to optical spectroscopy of layered semiconductors
Shivangi Shree, Ioannis Paradisanos, Xavier Marie, Cedric Robert, and Bernhard Urbaszek
Universit´e de Toulouse, INSA-CNRS-UPS, LPCNO, 135 Avenue Rangueil, 31077 Toulouse, France In this technical review we give an introduction to optical spectroscopy for layered materials as a powerful, non-invasive tool to access details of the electronic band structure and crystal qual-ity. Potential applications in photonics and optoelectronics are based on our understanding of the light-matter interaction on an atomic monolayer scale. Here atomically thin transition metal dichalcogenides, such as MoS2 and WSe2, are model systems for layered semiconductors with a
bandgap in the visible region of the optical spectrum. They can be assembled to form heterostruc-tures and combine the unique properties of the constituent monolayers. We review the working principles of micro-photoluminescence spectroscopy and optical absorption experiments. We discuss the physical origin of the main absorption and emission features in the optical spectra and how they can be tuned. We explain key-aspects of practical set-ups for performing experiments in different conditions such as variable temperatures or in applied magnetic fields and how parameters such as detection spot size and excitation laser wavelength impact the optical spectra. We describe the important influence of the direct sample environment, such as substrates and encapsulation layers, on the emission and absorption mechanisms. A survey of optical techniques that probe the coupling between layers and analyse carrier polarisation dynamics for spin- and valleytronics is provided.
I. INTRODUCTION TO LAYERED
SEMICONDUCTORS
The physical properties of atomic monolayers often change dramatically from those of their parent bulk materials. Prime examples are monolayers of graphite
(graphene) and MoS2, as their ultimate thinness makes
them extremely promising for applications in
electron-ics and optelectron-ics. At the same time they give access to
new degrees of freedom of the electronic system such as the valley index or interactions between quasi-particles such as excitons (Coulomb bound electron-hole pairs). Additional functionalities emerge as these materials are
stacked in van der Waals heterostructures [1]. In
ad-dition to the currently investigated materials, recently about 1800 materials were predicted to be exfoliable, sta-ble in monolayer form [2] and therefore tools for investi-gating the properties of these emerging layered materials are of prime importance. Here we provide a guide to optical emission and absorption spectroscopy for atom-ically thin layered materials, commonly carried out in optical microscopes for increased spatial resolution. Op-tical spectroscopy gives access to key information such as the bandgap, exciton binding energy and absorption strength of a material. Combining spatial and polarisa-tion resolupolarisa-tion gives access to the spin and valley physics in monolayers and also in heterostructures. In the latter optical, transitions are tunable over a wide wavelength range and electron-hole pairs can experience nanoscale
moir´e confinement potentials for quantum optics
exper-iments and investigating collective effects of electronic excitations [3, 4]. Moreover, optical spectroscopy tech-niques can be applied to semiconducting, magnetic lay-ered materials such as chromium trihalides for probing their magnetisation [5–8]. Optical spectroscopy also re-veals magnetic proximity effects and charge transfer as non-magnetic and magnetic layers are placed in direct
contact to form heterostructures [9–11]. For
applica-tions in photonics optical spectroscopy reveals how light matter coupling is enhanced when layered materials are placed in optical cavities or on resonators [12, 13]. Opti-cal spectroscopy can be used as a non-invasive technique for studying lattice structure, interlayer coupling and stacking, that provides complementary information to di-rect atomic-resolution imaging from electron microscopy [14–18].
The target of this review is to give an overview on what kind of information on novel layered materials we can access in practical optical spectroscopy, how the op-tical spectra are impacted by several distinct parameters such as the set-up and equipment used, the experimen-tal conditions (temperature, external fields), the sample structure and very importantly the active layer environ-ment. The electronic excitations in an atomically thin layer are strongly impacted by the substrate and encap-sulating layers. This leads to two directions for experi-ments, (i) access intrinsic properties of the layers placed in a well controlled environment (i.e. between two in-ert buffer layers) or (ii) the layered material acts as a probe as we make use of the interaction of the optical ex-citations with the direct environment to investigate, for example, the magnetisation of adjacent layers or detect-ing molecules in the proximity [19].
Optical properties of layered semiconductors, using the model system of transition metal dichalcogenide (TMD) semiconductors are introduced in the remainder of Sec-tion I, together with fabricaSec-tion methods for typical
sam-ple structures. The equipment used for optical
spec-troscopy set-ups, commercially available systems or com-ponents assembled in a laboratory, are discussed in Sec-tion II A. Optical spectroscopy techniques used to un-cover the main optical transitions in TMD materials and how they are impacted by the sample structure and the surrounding layers are detailed in the remainder of Sec-tion II. How to access spin and valley polarisaSec-tion ef-fects using optical methods is introduced in Section III.
Finally, opportunities for Raman scattering and second harmomic generation (SHG) are outlined in Section IV.
A. Optical properties of layered semiconductors : transition metal dichalcogenides
Interlayer van der Waals forces are considerably weaker than intralayer covalent bonding which makes a very large number of crystals exfoliable [2, 26]. TMD mono-layers consist of a hexagonally oriented transition metal layer covalently bonded with top and bottom chalcogen layers [27, 28], see FIG. 1a. Multilayers are coupled by weak van der Waals forces and their symmetry is given by the stacking order [29, 30], i.e. the relative twist angle
being 0o or 60o. TMDs such as MoS
2 occur in different
phases with semiconducting or metallic properties, here we focus on the semiconducting phase (2H). The elec-tronic and optical properties of TMDs change drastically as their thickness is reduced from bulk to atomic bilayer
and monolayers. Bulk and few-layered TMDs exhibit
an indirect bandgap, however, TMD monolayers show a direct bandgap. This gives rise to strong photolumines-cence (PL) emission [31, 32] and also to a large, tunable absorption in monolayers [33, 34]. The light-matter inter-action is dominated by excitons, Coulomb bound electron hole pairs, and this interaction is strongly enhanced when the incoming electromagnetic wave is resonant with the energy of the excitonic states [35].
The binding energies of excitons in TMD monolayers are of the order of several hundreds of meV. This is a con-sequence of the large electron and hole effective masses [36], the reduced dielectric screening and the spatial con-finement of the carriers. As a result, excitonic effects dominate the optical properties even at room tempera-ture and beyond [37–40]. A strong spin-orbit splitting of about 200 meV (for Mo-based) and 400 meV (W-based) appears in the valence bands at the K-point [36, 41, 42]. As a consequence, two separate interband optical tran-sitions are observed in absorption, named A (transition from the upper valence band) and B (transition from the lower valence band) [28].
Interestingly, the strong Coulomb interaction is ex-tremely sensitive to the dielectric screening associated with a spatially inhomogeneous environment [43, 44] as discussed in Section II. This implies that the exciton tran-sition energy, and to a larger extent, both the exciton binding energy and the free carrier bandgap can be tuned by engineering the local dielectric environment [45, 46]. However, a possible undesirable consequence is that local dielectric fluctuations from disorder and impurities can result in strongly broadened optical transitions [47, 48].
Optical transitions that are dipole-, momentum- and spin-allowed are referred to as ’bright’ and the excitons recombine by emitting a photon. In layered materials excitons with different spatial orientations of the opti-cal dipole, either in-plane or out-of the layer plane (see scheme in FIG. 3), participate in optical transitions in
WSe2 [49] and InSe2 [50], for example. Taking into
ac-count also optical transitions that rely on phonon absorp-tion or emission or spin-mixing of the different electronic states results in a large number of possible optical tran-sitions (’bright’ and ’dark’) for a specific material. The emission and detection efficiency can be optimised in ap-plied magnetic fields and by selecting a particular light
polarisation and propagation direction [51–53]. These
different types of optical transitions can be addressed selectively in the optical microscope set-up as detailed below. Mainly the interband transitions between the va-lence band and conduction band are probed, but also transitions between excitonic states [54] or intersubband transitions in multilayers can be observed [55].
When the electron and hole reside within the same layer, we speak of intralayer excitons, as sketched in FIG. 1c. Interlayer excitons can form in TMD heterobi-layers due to the type-II (or staggered) band alignment [25] with the photoexcited electrons and holes residing in different layers, see FIG. 1d. These excitons are referred to as indirect in real space. The difference in the lattice constants between the monolayers forming the heterobi-layer affects (i) the alignment of K-points which deter-mines if the interlayer transition is direct or indirect in reciprocal space, i.e. a phonon is needed in addition to a photon in the emission process [56, 57] and, (ii)
for-mation of moir´e effects/reconstructions [15, 58–60]. The
latter leads to a periodic modulation of the electron and hole bandstructure depending on the difference between the lattice constants and/or twist angle, see FIG. 4a. The
depth and periodicity of the moir´e potential can generate
localised emitters (individual excitons) or collective exci-tations (trapping of excitons) [61], with encouraging first reports all using optical spectroscopy [4, 62, 63]. This ap-proach for generating periodic, nanoscale potentials can certainly be extended to new types of van der Waals het-erostructures.
B. Layered semiconductor samples : monolayers
and heterostuctures
Widespread fabrication methods of monolayer samples
on common SiO2/Si substrates include mechanical
ex-foliation from bulk crystals (top-down) and bottom-up chemical vapor deposition (CVD). Promising results of high quality monolayers are also obtained by molecular beam epitaxy (MBE) [64, 65].
Exfoliated TMD crystals from high quality bulk show
commonly defect densities of around 1012 cm−2 [47],
which is still considerably larger than in III-V semicon-ductor nanostructures. Currently the impact of defect concentration and type on the luminescence efficiency is widely investigated, with improvements reported for
samples treated with super-acids [66]. Exfoliation is
widely used because of simple handling even outside clean-room facilities and cost efficiency. However, there are several limitations: (a) the location of a single
mono-c
d
a
S Mob
armchair
zigzag
Transition metal dichalcogenide monolayers K+
s
+ 2 3 4 5 6 7 8 9 0 10 20 30 40 50Parabola Fit of Sheet1 B
B A Model Parabola Equation y = A + B*x + C*x^2 Plot B A 137.76297 ± 3.81262 B -48.31821 ± 1.52251 C 4.28604 ± 0.13232 Reduced Chi-Sqr 2.55963 R-Square (COD) 0.99341 Adj. R-Square 0.99152 2 3 4 5 6 7 8 9 0 10 20 30 40 50 P ara bo la F it of Sh ee t1 B B A Mo del Pa rabo la*x + C + B Ay = ntiouaEq *x^2 Plo t B62977.713 A ± 3.812 62 B -48.3 18 21 ± 1.522 51.13232 ± 086044.2 C Re du ce d C hi-Sq r 2.5 59 63930.9 )OD (CarequR-S 41 Ad j. R-S qu are 0.9 91 52
➝
➝
K-s
-2 3 4 5 6 7 8 9 0 10 20 30 40 50 P ara bo la F it of Sh ee t1 B B A Mo de l Para bola B*x + A +y = tionuaEq C*x ^2 Plo t B97 ±62137.7 A 3.812 62 B -48.3 18 21 ± 1.522 5132 ± 0.13204864.2 C Re du ced C hi-Sq r 2.5 59 63930.9 )OD (CquareR-S 41 Ad j. R-S quare 0.9 91 52➝
➝
708nm740nm 1050nm 590nm WS 2 665nm Mo S2 WS e2 Mo S e2 Mo Te2 2 3 4 5 6 7 8 9 0 10 20 30 40 50Parabola Fit of Sheet1 B
B A Model Parabola Equation y = A + B*x + C*x^2 Plot B A 137.76297 ± 3.81262 B -48.31821 ± 1.52251 C 4.28604 ± 0.13232 Reduced Chi-Sqr2.55963 R-Square (COD) 0.99341 Adj. R-Square 0.99152
-Intralayer exciton Interlayer exciton MoSe2 WSe2
+
n=1 n=3 n=2 Heterobilayers+
-+
--+ 3.6 4.4 5.2 6.0 Eva c –E( eV) WSe2 MoTe2 MoSe2 MoS2 WS2 WTe2 MoTe2 WSe2 WTe2 MoSe2 MoS2 WS2 Conduction band Valence band
FIG. 1: Excitons in TMD monolayers and heterobilayers for optical spectroscopy. a, Top view of MoS2 monolayer
hexagonal crystal structure, here transition metal atoms are shown in blue, the chalcogen atoms in black. The armchair and zigzag directions are indicated by purple and grey arrows. b, Schematic illustrations of valley selective optical transition which obey chiral selection rules addressed optically using σ+ (σ−) polarised light [20–24], see the details in Section III. The direct bandgap is at the K-points of the Brillouin zone for TMD monolayers. c, Schematic of van der Waals heterobilayers. The individual monolayers show intralayer excitons (orange oval) a bound pair of an electron and hole which resides in a single layer. Interlayer excitons can be found in heterobilayers where the two charge carriers are located in different layers (green oval). Inset shows the hydrogen-like, exciton states which correspond to different energy levels, designated by their principal quantum number n. d, Band alignment between 2D semiconductor monolayers calculated in [25]. Arrow shows the wavelength of the bandgap for different materials varying from the visible to near-infrared.
layer on the stamp/substrate is random and searching for a monolayer among flakes of different thickness is time consuming (b) the monolayers are relatively small with an average lateral dimension of tens of micrometer, and (c) the yield for finding monolayer per unit of surface area is low.
As an alternative to exfoliation, CVD allows direct growth of monolayer material on a large surface area [67– 70]. Here, the monolayer dimensions and the number of monolayers per unit of surface area are considerably larger than for exfoliation, see FIG. 3, with the limiting case of monolayer material covering the entire substrate surface. Recently, it has been demonstrated that lateral, as well as vertical TMD heterostructures can directly
grow on flat or patterned SiO2/Si substrates [71, 72].
De-taching CVD-grown samples from the growth substrate to deterministically fabricate heterostructures is possi-ble using, for instance, water assisted pick-up techniques [73, 74].
For CVD-grown and exfoliated samples, the intrin-sic quality can be evaluated by low-temperature optical spectroscopy. Emission from defects and inhomogeneous broadening in the optical spectra can be used as a diag-nostic tool. In addition to the intrinsic layer quality, the impact of the underlying substrate can also be a limiting factor of the optical quality. This has been demonstrated by comparing low-temperature optical spectra between
TMD monolayers (both CVD and exfoliated) on SiO2
and encapsulated with hexagonal boron nitride (hBN) [17, 48, 75]. It is possible to further improve the
opti-cal response by optimising the thickness of the top and bottom hBN in encapsulated TMD samples [76–78], see FIG. 2b.
Individual layers from high quality bulk crystals of dif-ferent layered materials can be assembled into van der Waals heterostructures by using deterministic dry
stamp-ing [79] or direct pick-up [80]. This allows controlled
transfer of layers at precise locations on the substrate. An optical micrograph of a van der Waals heterostruc-ture is shown in FIG. 2a. During the transfer micro-bubbles (blisters) can appear due to trapped air, water or hydrocarbons [80]. Agglomeration of the bubbles can be achieved by thermal annealing. This leaves clean, smooth areas with sharp interfaces [81]. In layered TMDs, the presence of bubbles or wrinkles can introduce defect emis-sion due to strain and/or carrier localisation. This can lower the optical transition energy and lead to the ap-pearance of localised emission, see FIG. 2b and section II.
Besides the intrinsic carrier density of a sample, charge impurities from a disordered substrate or adsorbates can introduce charge potential fluctuations, which strongly
impact the optical properties. This is commonly
ob-served in TMD monolayers on SiO2/Si. As a result,
transitions corresponding to charged exciton states (tri-ons) can be detected in low temperature PL, shown in FIG. 2b,c. Independent control of the carrier density in gated field-effect devices [82, 83] is thus crucial to study the optical properties in the charge neutral, p- or n-doped regimes [82, 84].
II. MEASURING OPTICAL ABSORPTION AND
LUMINESCENCE IN LAYERED SEMICONDUCTORS
The fundamental optical transitions in TMDs lie in
the energy range from ≈ 1.1 eV (monolayer MoTe2) up
to ≈ 2.1 eV (monolayer WS2), see FIG. 1d.
Ferromag-netic semiconductors, such as CrBr3and CrI3cover
sim-ilar transition energies [89, 90]. Interlayer excitons in
heterostructures such as MoS2/WSe2 can reach emission
wavelengths above 1100 nm (<1.1 eV), approaching the telecommunication bands [91]. Black phosphorous is a layered semiconducting material with a direct bandgap that strongly varies with the number of layers and covers the visible (monolayer) to mid-infrared (bulk) spectral region [92]. The same evolution of band gap change
ver-sus thickness occurs in PtSe2 [93], but here the bandgap
is indirect as for Si, so applications for detectors are pos-sible. At the opposite end of the spectrum layered hexag-onal BN has a bandgap in the deep ultraviolet at 6 eV (200 nm) [94]. Below we describe the working principles of experiments to study absorption and emission of the optical transitions in layered semiconductors.
A. Optical spectroscopy equipment
A typical spectroscopy set-up contains a light source and several optical components to guide the exci-tation light to the sample and the signal to the
spectrometer (monochromator) and detector. A
charged-coupled device (CCD) or a complementary metal–oxide–semiconductor (CMOS) camera is also es-sential for the sample imaging. In this section we out-line the characteristics of the main components and ex-plain in FIG. 3 the working principle of a versatile micro-spectroscopy set-up, widely used in commercial and also home-built systems.
Light sources.- The main parameters for the laser excitation depend on the application and the sample’s band structure: (i) the wavelength is selected in accor-dance to the investigated optical transitions (ii) the laser can be continuous-wave (CW) or pulsed. Pulsed lasers are more suitable for time-resolved experiments. For fem-tosecond (fs) or picosecond (ps) pulse duration the spec-tral width should be taken into account when investigat-ing transitions close in energy. At the same time, the laser peak power should be calculated to avoid sample damage. High beam quality (aiming for perfect
collima-tion, i.e. low M2factor) lasers are preferable for focusing
the beam tightly to a diffraction limited spot, consider-ing the small lateral dimensions of many exfoliated sam-ples. For CW excitation, laser diodes can be typically selected between 375 nm and 2000 nm. For experiments requiring tunable wavelength excitation, convenient so-lutions for the 700-1000 nm range include Titanium Sap-phire (Ti:sapSap-phire) lasers [95], which can be either pulsed (ps/fs) or continuous. To cover the wavelength range be-tween 500-700 nm and 1000-1600 nm, an optical para-metric oscillator can be coupled to the Ti:sapphire laser combined with a doubling crystal. Dye lasers can also be used, where the choice of dye and its solvent allows for the selection of the emission range. Absorption or reflection measurements are performed using a broadband white-light source to cover the full visible wavelength range. Often a simple halogen lamp suffices. When only one specific optical transition is investigated, a monochro-matic LED or SLED with 10-20 nm spectral bandwidth can be used. This enables a good compromise between a small spot size and sufficient excitation power. Other so-lutions include laser driven light-sources or super contin-uum white lasers [96] that allow to select a broad or nar-row wavelength range for excitation, which makes them versatile for photoluminescence but also for broad band absorption experiments.
Optical components.- The optical components used in the set-up are selected for a specific wavelength range depending on both the excitation source and the emis-sion wavelength. These include the polarisation compo-nents, microscope objectives, and lenses (ideally achro-matic doublets) shown in FIG. 3. Homogeneous areas (flat surface, no charge fluctuations) in typical exfoliated sample have lateral dimensions down to a few
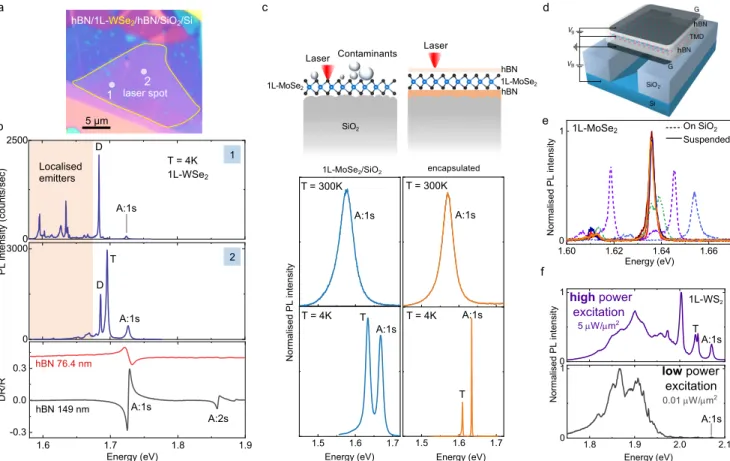
microm-1.5 1.6 1.7 1.5 1.6 1.7 on SiO2 Energy (eV) N or m al is ed P L in te ns ity Energy (eV) capped on SiO2 0 1 1.8 1.9 2.0 2.1 0 1 high power excitation N or m al is ed P L in te ns ity 5 µW/µm2 0.01 µW/µm2 Energy (eV) low power excitation
hBN/1L-WSe2/hBN/SiO2/Si
5 μm laser spot2 1 a hBN Contaminants SiO2 SiO2 d A:1s A:1s T T = 4K 1L-WSe2 D D 2 1 c b T T A:1s Laser hBN encapsulated Localised
emitters 1L-MoSe2/SiO2
e A:1s A:1s A:1s A:2s T = 4K T = 300K T = 300K T = 4K Laser A:1s f 1L-MoSe2 1L-WS2 A:1s T A:1s 1L-MoSe2 1L-MoSe2 1.600 1.62 1.64 1.66 1 N or m al is ed P L in te ns ity Energy (eV) On SiO2 Suspended 0 30000 2500 1.6 1.7 1.8 1.9 -0.3 0.0 0.3 P L in te ns ity ( co un ts /s ec ) hBN 149 nm D R /R Energy (eV) hBN 76.4 nm h h
FIG. 2: Variation in photoluminescence (PL) response for different experimental conditions. a, Optical mi-crograph of a typical van der Waals heterostructure sample containing a WSe2 monolayer between hBN top and bottom
encapsulation layer, sample homogeneity and sample imperfections (bubbles and wrinkles) can be seen. The homogeneous and non-homogeneous regions of the sample are labelled 1 and 2 in white, respectively. b, Typical PL spectra at T = 4 K recorded at two different locations 1 and 2 of the sample shown in a. The main exciton transitions (neutral excitons (A:1s), charged excitons (T) and spin- forbidden dark exciton (D) are quenched and localised emitters appear when PL is recorded on the bubbles or on wrinkles. However, strong PL emission corresponding to the main excitons from WSe2 monolayers is recorded
on the flat region of the sample. c, Sketch of MoSe2 monolayer sample structures in different dielectric environment. The left
panel is the sample structure of a non-encapsulated TMD monolayer on SiO2 and the TMD monolayer encapsulated in hBN
is on the right panel. Typical PL spectra recorded at room temperature and at cryogenic temperature on the encapsulated and the non-encapsulated sample are shown in the bottom panel. The linewidth reduces significantly for the encapsulated sample at T = 4 K compared to non-encapsulated sample. d, hBN encapsulated MoSe2layer suspended over a trench [83] and
corresponding spectra are shown in e. The PL emission energy remains constant on suspended samples on different locations on the monolayer showing sample homogeneity [83]. f, WS2monolayer encapsulated in hBN on a SiO2/Si substrate, WS2layer
plasma treated to generate optically active defects. Typical PL emission spectra for CW laser (532 nm) excitation at 0.01 µW and 5 µW at T=4 K. The PL emission intensity of the main excitons are clearly visible at high power density, whereas these features are almost not detectable at low laser power density. PL spectra at low laser power density reveal that carriers can be trapped efficiently by defect sites and recombine by emitting photons at lower energy. Therefore at low laser power the PL emission of defects is considerably stronger than the free exciton emission.
eters. Therefore small excitation/detection spots close to the diffraction limit are crucial to record spectra with transition linewidths limited by the homogeneous, not inhomogeneous, broadening. A diffraction limited spot diameter can be achieved by using high numerical aper-ture (N A) objectives.
Detection.- The final target is to detect the inten-sity as a function of wavelength of the light emitted from/scattered by the sample. The signal is focused onto the entrance slit of a spectrometer. The collected signal is then dispersed by a monochromator, which can host
dif-ferent diffraction gratings, where a small (large) number of lines/mm allows studying a broad (narrow) spectral range. The signal can then be detected by a CCD or high quality CMOS chips. Alternatively, the monochro-mator can be left out and a simple combination of filters can be used in front of the detector.
Experimental conditions.- Control of the ambient conditions is crucial. Many experiments are carried out at room temperature but low temperature experiments are necessary to access particular optical transitions. In simple bath cryostats the sample is kept in thermal
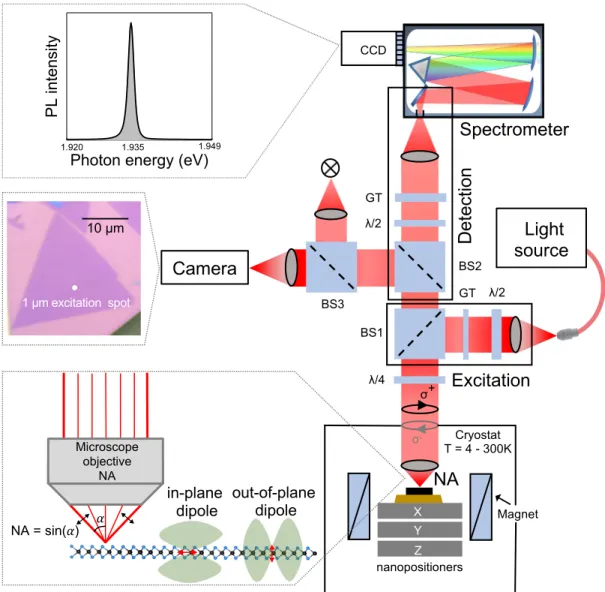
con-Spectrometer
σ+ σ -GTD
et
ect
io
n
Camera
GT λ/2 λ/4 BS2 BS1 nanopositioners Magnet Cryostat T = 4 - 300K X Y ZNA
Excitation
Light
source
BS3 λ/2➝
CCD A:1s ! NA = sin(!) Microscope objective NA in-planedipole out-of-planedipole 10 µm 1 µm excitation spot 1.9200 1.935 1.950 60000 PL inte nsit y
Photon energy (eV)
C % (2,@LG)
1.920 1.935 1.949
FIG. 3: Description of a typical microscope for optical spectroscopy: Micro-photoluminescence and reflectivity set-ups have to fulfill several key criteria: High spatial resolution for sample mapping and accessing specific sample areas, high detection efficiency for example for quantum emitters in layered materials, combination of two detectors (one CCD/CMOS camera for sample imaging to guide the experiment and another camera to accumulate the emission signal as a function of wavelength). All this can be combined in a microscope, where excitation and detection pass through the same objective (epifluorescence geometry). The spatial resolution is given by the diameter ∆ of the detection spot. This depends on the numerical aperture (N A) of the objective and the wavelength λ through the Rayleigh criterion as ∆ = 0.61λN A [85], where N A > 0.8 is common in commercial objectives. Excitons in layered materials can have an optical dipole either in-plane or out-of-plane, see inset representing emitters with in-plane and out-of-plane optical dipoles. Objectives with high N A also collect part of the emission from an out-of-plane optical dipole. A typical microscope set-up can be used to perform with similar equipment photoluminescence, reflectance, photoluminescence excitation (PLE), Raman scattering and second harmonic generation (SHG) spectroscopy experiments. Van der Waals heterostructures of different materials can be studied for temperatures T = 4 - 300 K. The samples are placed on nonmagnetic nanopositioners (travel distance several millimetres). An objective located inside a cryostat is more stable for long signal integration times. The other microscope components remain at room temperature. The microscope design has several modules: The excitation light propagates through an optical fibre via the lower horizontal arm. The upper horizontal arm consists of a camera and broad-band light source for sample imaging. The vertical arm is used for detection. The signal is collected by a spectrometer (here we show a Czerny-Turner geometry) with a diffraction grating coupled to a highly sensitive Si-CCD camera. Optionally an optical fibre can be used in the detection path. The fibre transports the signal from the microscope to the spectrometer entrance and also acts as a spatial pin-hole, making this a confocal arrangement for increased lateral (xy) and depth (z) resolution [86]. Polarisation analysis is a key motivation for studying layered materials such as TMDs for spintronics and valleytronics. Both linear polarisation and circular polarisation analysis can be achieved. For example, in the excitation part a Glan-Taylor (GT) polariser and a halfwave plate (λ/2) can be inserted. It is important to take into account the impact of the beamsplitters (BS) on the polarisation state. The quarter wave plate (λ/4) transforms the linear into circular polarisation and vice versa. Instead of a simple waveplate, a liquid crystal retarder (where a precise retardance of λ/2, λ/4 etc. can be adjusted by the applied bias) can optionally be used in the detection path. This avoids a macroscopic beam movement which can occur during rotation of a typical waveplate as the retardance/polarisation is changed. The performance of all optical set-up components is wavelength dependent, such as limited bandwidth of reflection coatings, chromatic aberrations of the objective or optical retardance for specific wavelengthd. Examples of optical components and polarisation analysis/rejection used in a microscope can be found in [86–88].
tact with a liquid helium bath at T = 4 K, either via he-lium exchange gas or a cold finger. The main drawback is that the bath needs to be periodically refilled with liquid helium. Alternatively, closed-cycle cryostats liquify the helium gas using external compressors and allow continu-ous operation. The external compressor needs to be me-chanically decoupled from the sample space to minimise vibrations. A piezo-based 3-axis stage with nanometer step-size is used to place a specific area of the layer of interest in the focal point of the objective. For high me-chanical stability of the set-up, a low-temperature com-patible microscope objective can be placed inside the cryostat, see FIG. 3.
The sample holder can also be placed inside the bore of a superconducting coil to apply magnetic fields. In this case the nanopositioners, as well as the objective lens must be made of non-magnetic materials such as
titanium and beryllium copper. The sample needs to
be placed at the centre of the coil which limits in prac-tice the sample size and also the optical access (beam diameter). The motivation for magneto-optics is mani-fold such as extracting the valley Zeeman splitting, and hence identifying the origin of new excitonic transitions including interlayer excitons in TMD homo- and heter-obilayers, trilayers and bulk [97, 98]. Furthermore, it is possible to investigate valley polarisation dynamics and ’brightening’ of otherwise spin forbidden-transitions [99]. Attention should be given to undesired Faraday effects in certain optical components. Magnetic ions in the glass result in an undesired rotation of the linear polarisation in the presence of magnetic fields. This needs to be com-pensated by other polarisation control elements [100].
B. Absorption spectroscopy
Strictly speaking, measuring absorption (A) requires to measure both transmittance (T ) and reflectance (R) where A = 1 − R − T . Transmission measurements re-quire a transparent substrate and a detection path dif-ferent from the excitation path, for example a separate microscope objective on each side of the sample or alter-natively one objective combined with a fibre on the other side of the sample [101]. In practice often reflectivity is measured as it is the simplest experiment for samples
on substrates like SiO2/Si that are not transparent. To
get a quantity independent of the optical response of the set-up, one generally measures the reflectivity contrast
defined as (Rsam− Rsub)/Rsub, where Rsamis the
inten-sity reflection coefficient of the sample with the TMD
layer and Rsub comes from the same structure without
the TMD layer. The spectra obtained this way are for brevity commonly referred to as absorption in the liter-ature.
The optical properties of a material can be seen in a simple classical picture as the interaction between light (electromagnetic radiation), and various types of lators [102]. In TMD monolayers, the dominating
oscil-lators are exciton resonances. Therefore, in reflectivity different exciton resonances are accessible up to room temperature as they possess strong oscillator strength and high density of states (DOS). This allows to observe the Rydberg series of the A-exciton: 1s, 2s, 3s...(see
FIG. 2b bottom panel), thus giving a measure of the
exciton binding energy and the single particle bandgap
[38, 101]. Other optical transitions related to defect
states in the gap or other exciton complexes which posses weaker oscillator strength and/or comparatively lower density of states are difficult to trace in absorption, al-though they might appear in photoluminescence emis-sion, as discussed below.
Monolayers.- The energy of the A-exciton transition in TMD monolayers is given by the difference of the sin-gle particle bandgap (of unbound electrons and holes) and the exciton binding energy. Engineering the dielec-tric environment (and hence all energy scales linked to the Coulomb interaction) results in significant changes in the single particle bandgap [46] and the exciton binding energy of TMD monolayers. But the shift in the global A-exciton transition energy is rather small, as changes in single particle bandgap and the exciton binding energies partially compensate each other. Compare FIG. 2c for
monolayer MoSe2 transition energies with and without
hBN encapsulation, which are very close in value. How-ever, the linewidth in absorption is significantly impacted by dielectric disorder [75]. For instance, bubbles, wrin-kles, polymer residues and hBN have different dielectric constants. Therefore, a non-uniform dielectric environ-ment affects the energy of the exciton transitions and the overall shape of reflectivity spectra. Uniform dielectric slabs such as thick (tens to hundreds of nm) hBN layers can be exploited to steer the absorption. The visibility of exciton resonances in absorption is mainly influenced
by the thickness of hBN and SiO2, see FIG. 2b. This
is due to thin-film interference effects, the bottom hBN thickness determines how far the monolayer is from the
Si/SiO2interface, which acts as a mirror. The choice of
hBN thickness of the heterostructure can be optimised using a transfer matrix approach to increase the visibil-ity of the targeted transitions [77]. In this process, the particular energy of the excitonic resonance of the lay-ered semiconductor should be taken into account [77]. Recent results in TMD materials placed in front of mir-rors show a modulation in the absorption strength of up to 100% due to interference/cavity effects [103–105]. The strong influence of the dielectric environment on the light-matter interaction of atomically thin semiconduct-ing membranes motivates a great potential for senssemiconduct-ing ap-plications including novel device architectures with pre-cisely tunable optical properties.
Multilayers.- In general the nature (direct or indi-rect) and the energy of the bandgap evolves as a function of the layer number for a given material. In addition, the absorption of layered semiconductors such as black
phos-phorous [92] and ReSe2[106, 107] reveals information on
is highly anisotropic in the layer plane, as a direct re-sult of a highly anisotropic lattice structure. In TMD multi-layers and even bulk strong excitonic features are reported even at room-temperature in early studies [28]. In addition to these features typically attributed to the intralayer A- and B-exciton, more recently the observa-tion of interlayer excitons (formed by carriers in 2 adja-cent layers) has been reported in absorption of bulk sam-ples [97, 108, 109]. Absorption of interlayer excitons is
also reported in homobilayers and homotrilayers of MoS2
[110, 111]. In these systems the transition energy of the absorption can be tuned through the application of an electric field perpendicular to the layers (Stark shift) over 120 meV and the interaction between interlayer and in-tralayer excitons can be investigated [60, 98, 112].
C. Photoluminescence spectroscopy
Luminescence experiments are widely used for study-ing the macroscopic optical properties of materials as well as their microscopic electronic excitation, for the evalu-ation of crystalline quality (presence of defects) and for
testing novel optoelectronic devices [116, 117].
Lumi-nescence is defined as a surplus of the electromagnetic radiation (light) emitted by a solid, in addition to its equilibrium radiation described by Planck’s law. This surplus energy is transformed into detectable lumines-cence radiation. During the process of lumineslumines-cence the electrons are excited to higher energy states (by a light -source in the case of photo-luminescence). Subsequently the carriers relax in energy for example through phonon emission, followed by photon emission. The succession of all involved relaxation and recombination events lasts a relatively long time, which is a main difference compared to other types of so-called secondary radiation: reflected light and scattered light (for example Raman). Once the material is excited with a light pulse, the luminescence continues to decay for some time and can be recorded in time-resolved photoluminescence [116], see a review on time-resolved spectroscopy [118] for technical details. These experiments give information on carrier relaxation and recombination times. In addition to time-resolved photoluminescence (an incoherent technique), also im-portant information can be gleaned from coherent spec-troscopy such as four-wave mixing and two-color pump-probe experiments [34, 119, 120].
In absorption spectra optical transitions with large os-cillator strength and high density of states dominate. In contrast, the emission spectrum given in photolumines-cence experiments can be dominated by other transitions as these experiments probe the population of a state. Typically, optical transitions at lower energies are de-tected in PL as carriers relax towards these lower energy states before radiative recombination. It is therefore in-structive to compare emission with absorption spectra (measured in reflection geometry) as in FIG. 2b. For the
material investigated, monolayer WSe2, the main bright
exciton transition (A:1s) that dominates in absorption is not generally the strongest feature in PL emission, as electron-hole pairs can relax towards states lying at lower energy to recombine [51].
Sample temperature.- At room temperature, the main transitions such as the A- and B-excitons in TMDs will be broadened due to scattering with phonons, com-pare spectra at T=4 K and 300 K in FIG. 2c. Carriers or excitons are mobile at high temperature and defect potentials in the lattice with only shallow confinement energy will not act as efficient trapping sites. At low tem-perature phonon absorption is reduced and the linewidth reveals the sample quality (inhomogeneous broadening versus homogeneous broadening [78]). This is illustrated in FIG. 2c. Spectral lineshape and main emission energy can change compared to high temperature. Carriers can get trapped at sufficiently deep defect potentials. Also excitonic complexes with lower binding energy, such as trions, are now stable and contribute to the PL signal, see FIG. 2b,c,f for three different materials [34, 48, 121, 122]. Excitation power.- Laser power plays an important role as it controls the number of photoexcited carriers. Strictly speaking, the power density (defined as the av-erage power per unit area) is directly related to the pho-togenerated exciton density in layered semiconductors. It is inversely proportional to the square of the focused beam radius, thus it is directly related to the numerical aperture of the objective lens and laser wavelength. Let us take an example of a sample with a finite value of defect density: for a tightly focused beam (spot size ≈ 1 µm), at low laser power (typically hundreds of nW) all carriers can be trapped at defect sites and the PL sig-nal of free excitons is not visible, as in FIG. 2f, lower panel. Increasing laser power (few µW) fills all defect sites and free exciton PL can be measured in addition to defect emission, see FIG. 2f upper panel. Further in-crease in power (tens to hundreds µW) will lead to such a high concentration of excitons that exciton-exciton in-teractions start to play a role. At high excitation den-sity very different phenomena such as biexciton formation and exciton-exciton annihilation can be studied depend-ing on the material [123–126]. Understanddepend-ing emission for high exciton (carrier) concentrations is crucial for ap-plications such as lasing and for investigating collective states such as condensates [63, 127].
Sample quality and dielectric environment.-Two monolayer samples exfoliated from the same quality bulk crystal but placed on different substrates can ex-hibit very different PL characteristics, see FIG. 2c for a
comparison of MoSe2 on SiO2and on hBN, respectively.
The total line broadening comes both from homogeneous contributions given by ≈ 1 ps lifetime (below 1 meV linewidth) and inhomogenous contribution from sample imperfections (impurities, defects, interface, substrate, etc) [119]. The key role of high quality hBN buffers with low defect density is to provide atomic flatness [128] for monolayer deposition and a very clean, homogeneous di-electric environment. The hBN bulk bandgap of 6 eV [94]
a b d 1L-WSe2 1L-MoSe2 MoSe2/WSe2 SEM 5 nm 1 2 3 c P L in te nsi ty (x1 0 3co un ts/ s) Energy (eV) 10 3 8 6 4 2 0 5 4 3 2 1 0 2 1 0 3 1.4 1.5 1.6 1.7 1.8 MoSe2/WSe2 1L-MoSe2 VTG = -0.75 V BG Energy (eV) 1.30 1.35 1.40 1.45 1.50 5 0 -5 -10 E ( V nm -1 ) -0.08 0 0.08 Intensity (a.u.) 1 0 e VTG -VBG 1200 600 1800 2400 3000 P ar al le l S H G in te nsi ty (n or m .)1.0 0.5 0 1.0 WSe2 MoSe2 SHG Θ = 6 ± 10 00 2 1 1L-WSe2 IX1 IX2 MoSe2 WSe2 0.5 1 Twist angle
➙
FIG. 4: Moir´e interlayer excitons in heterobilayers. a, Two different monolayer materials stacked vertically that display a moir´e pattern due to slight lattice mismatch and twist angle. Different local atomic alignments in the heterostructure show different optical properties [4, 61, 113, 114]. Three spots labelled 1, 2 and 3 are chosen for PL measurements on MoSe2monolayer,
WSe2 monolayer and MoSe2/WSe2 heterostructure, respectively, and corresponding spectra are shown in c. b, SEM imaging
of hBN-encapsulated twisted WSe2 bilayers with a spatially varying reconstruction pattern due to the interaction between the
respective layers after stacking [15]. c, Example of photoluminescence spectrum from an hBN-encapsulated MoSe2 monolayer
(solid red curve), MoSe2/WSe2 heterostructure (solid black curve) and WSe2 monolayer (solid blue curve) [114]. Intralayer
exciton emission is observed from the MoSe2 and WSe2 monolayers. The interlayer exciton emission (IX1 and IX2) appear in
energy below the intralayer resonances from the heterostructure. d, Electrical control of interlayer excitons in MoSe2/WSe2
heterobilayer. Colormap of PL emission spectra as a function of applied gate voltages VT Gand VBGwhen sweeping at constant
doping. Stark shift of the interlayer excitons in applied electric fields perpendicular to the layers showing out-of-plane electric dipole [114]. e, Polarisation-resolved second harmonic generation (SHG) intensity of the individual monolayers from a different publication compared to panels c,d, indicating the armchair directions of the monolayers which determine the twist angle (θ) between the WSe2 and MoSe2 layers [115].
is high enough to use it as an essentially transparent en-capsulation layer for many materials, providing an ideal environment to address intrinsic properties of 2D-TMDs and preserving good optical quality of air-sensitive
ma-terials such as CrI3 or black phosphorous. As the
inho-mogenous broadening is largely suppressed in high qual-ity samples of TMD monolayers, the linewidth starts to
be an indication of the exciton lifetime (homogeneous broadening) and can be tuned by carefully choosing the encapsulating hBN thickness - placing the monolayer on a node or anti-node of the electromagnetic field in the multilayer structure [78].
PL emission is sensitive to the presence of wrinkles or bubbles which induce strain and localisation potentials
in encapsulated monolayers. Small strain (1%) in mono-layer induces a rather significant (about 50 meV) shift in bandgap energy [129] which can explain shifts in ab-solute emission energy from sample to sample and for different areas of the same sample. Therefore, in prac-tice PL emission intensity as well as linewidth varies on different location of TMD monolayers, see FIG. 2b when the detection spot (1 µm diameter) is scanned across a
WSe2 monolayer. Remarkably, exciton emission energy
that does not vary as a function of the detection spot
position has been observed in hBN-encapsulated MoSe2
monolayers, suspended over a trench, see FIG. 2d,e [83], indicating a stable, inert environment.
The general study of the dielectric environment, sur-face quality, flatness, charging events and their impact on optical properties is very important also for other nanos-tructures such as carbon nano-tubes [130–134] and lay-ered perovskites [135] which show strong excitonic effects. Interference effects.- Layered materials are usually
placed on a substrate such as Si with an SiO2 layer of
typically 85 nm. As discussed earlier for white light ab-sorption experiments, optical interference will also be im-portant for the laser excitation beam and the PL
emis-sion as a function of the SiO2thickness and possibly the
encapsulation layer thickness. Reversely, for constant
SiO2 thickness absorption and emission intensities and
directivity will depend on the wavelength, as detailed in
[76, 136]. In practice the thickness of the SiO2 layer on
top of Si is chosen to maximise optical contrast of mono-layers already during sample fabrication, as discussed in
detail for graphene on SiO2 [137].
Emission dynamics.- The detected luminescence sig-nal from a layered semiconductor is the result of an intri-cate interplay between radiative and non-radiative energy relaxation. Time-resolved PL can be performed using a pulsed laser excitation and measuring the recombina-tion (emission) time. In clean TMD samples the strong exciton oscillator strength leads to an intrinsic radiative lifetime of the order of 1 ps at low temperature [138]. Lo-calised emitters recombine considerably slower and also dark excitons have a lifetime up to 3 orders of magnitude longer. In the time domain, low temperature measure-ments on high quality samples allow spectrally isolating each transition (either with bandpass filters or with a spectrometer) and then studying the emission dynamics of each optical transition separately [78, 121, 139].
Optical dipole orientation.- In TMD monolayers the main optical transitions have an in-plane optical dipole, they therefore emit light normal to the mono-layer plane. However, in addition to these bright (spin-allowed) transitions also excitons that have an out-of-plane optical dipole emit light [51]. Out-of-out-of-plane dipole transitions are also prominent in InSe [50, 140]. Due to the small sample dimensions most experiments are car-ried out in a microscope using an objective with high (>0.8) N A, see inset on microscope objective in FIG. 3. As a result, PL emission containing out-of-plane and also in-plane components in the monolayer are detected. In
WSe2and WS2monolayers, dark excitons are prominent,
see FIG. 2b and lead to exotic, higher order complexes (such as biexcitons made up of a dark and a bright ex-citon and so-called dark trions [125, 141]), that can be identified by monitoring the orientation of the exciton dipole. The role of out-of-plane dipole emission is also
investigated for quantum emitters in WSe2[142].
Bright-ening of (spin-) dark states due to an increased mixing of
the spin-states in WSe2, WS2, MoSe2 and MoS2
mono-layers can be observed in low-temperature magneto-PL experiments by applying strong (ideally several tens of T) in-plane magnetic fields [52, 53, 143].
Multilayers.- PL spectroscopy is useful also in TMD heterobilayers with type II alignement for the examina-tion of spatially indirect interlayer exciton (see FIGs. 1c and 4c) with large binding energies (≈ 150 meV) [57, 144,
145]. A long period moir´e pattern (see sketch in FIG. 4a)
offers new directions to explore and control exciton ar-rays in twisted TMD heterobilayers from potentials that trap individual excitons to the formation of minibands. This allows physics related to the Mott-insulator [4], for potential applications in quantum optoelectronic devices [16, 60]. Some key characteristics of interlayer excitons include a long-lifetime (ns), a wide transition energy tun-ability that ranges over several hundreds of meV via ap-plied electric fields, see FIG. 4d and a characteristic Zee-man splitting when compared to intralayer excitons [109].
D. Photoluminescence excitation spectroscopy
In photoluminescence excitation spectroscopy (PLE) the PL emission intensity for a chosen energy is recorded for different photon excitation energies. Tunable lasers or powerful white light sources are used as an excitation source. The linewidth and tuning step of the source will determine the spectral resolution of the PLE experiment. The measured PL intensity will depend on two factors (i) the absorption strength at the excitation energy and (ii) the efficiency of energy relaxation followed by radiative recombination (in competition with non-radiative chan-nels). This combined dependence on both absorption and energy relaxation (often through phonon emission) make PLE spectroscopy a very interesting tool for several in-vestigations :
Interlayer excitons.- A PL signal enhancement of interlayer excitons is observed when the laser excitation energy is resonant with intralayer states in one of the lay-ers, confirming that interlayer excitons form via charge transfer processes between the layers [57, 114, 146], see FIGs. 1d and 4c. In general electronic coupling or charge transfer between layers can be investigated by tuning a laser in resonance with an electronic transition in one layer and monitoring PL emission at an energy corre-sponding to the adjacent layer or to the heterostructure. Measuring excited exciton states.- PLE can be also used to establish a link between optical transitions with similar microscopic origin within the same
mono-layer. In MoS2monolayers, B-exciton states energetically
overlap with the excited A-exciton states (A:2s, A:3s..,). PLE spectroscopy allows to distinguish the excited states by collecting the emission intensity of the ground state, A:1s, as a function of the excitation laser energy, scanned over the energy of A:2s, A:3s, etc. Besides states with s-symmetry, also p-states can be examined. To access p-states, two-photon absorption processes are necessary and therefore the laser energy needs to be tuned to half of the transition energy [94]. The identification of high-excited exciton states in one and two-photon-PLE is a powerful method to evaluate the impact of different di-electric environments on the energy evolution of the ex-citon states. Furthermore, it is possible to extract the exciton binding energies [147] and investigate predictions of splittings of the p-exciton states [148]. However, one should note that the crystal symmetry or disorder effects can mix s and p exciton states [149, 150].
Identification of dominant phonon modes for energy relaxation.- In addition to key information on absorption, PLE is used to identify efficient relaxation
channels. In PLE experiments on MoSe2 monolayers a
periodic oscillation in energy is observed over an energy range without any expected exciton resonance (roughly constant absorption [151]). These maxima are all equally spaced in energy by longitudinal acoustic phonons at the M point of the Brillouin zone, LA(M), revealing the ef-ficient energy relaxation of excitons through emission of LA(M) phonons [122, 152]. This experimental observa-tion was possible due to the spectrally narrow excitaobserva-tion source, resolving fine separations between different peaks related to phonon emission [122, 153].
III. ACCESSING SPIN-VALLEY
POLARISATION IN OPTICAL SPECTROSCOPY
The symmetry of the electronic states in monolayers and multilayer crystals governs the optical selection rules for light polarisation in emission and absorption [21, 61], see FIG. 1b, as studied since several decades for semi-conductor nanostructures [154]. For polarisation analy-sis, linear polarisers and waveplates can be inserted in the detection and excitation path of the set-up, see FIG. 3 for practical details. Exciting a system with polarised light can address a specific spin or valley state, see FIG. 1b. The emitted light gives information on spin and valley dynamics in time-integrated PL experiments. The circu-lar pocircu-larisation in time-integrated experiments depends
on the exact ratio of PL emission time τP L versus
depo-larisation time (τdepol) as Pc = P0/(1 +ττP L
depol), where P0
is the initially generated polarisation which could depend on the excitation energy [155, 156].
TMD monolayers.- The interband transitions in
monolayer materials such as MoS2 are governed by
chi-ral selection rules as optical transitions in the K+ (K−)
valley are σ+ (σ−) polarised. For neutral, bright
ex-citons the intrinsic lifetime is of the order of 1 ps, so
from time-integrated PL experiments that report Pc
val-ues in the order of 50% one can infer that τdepol is at
least of this order of magnitude. In practice more so-phisticated pump-probe measurements reveal very short
valley lifetimes for neutral excitons [119]. The ratio τP L
τdepol
can be tuned by placing monolayers in optical
microcav-ities [157, 158]. Longer valley lifetimes in monolayers
are reported for resident carriers [159] not excitons, mea-sured with pump-probe techniques such as Kerr rotation employed for probing polarisation in semiconducting or metallic nano-structures [7].
TMD heterobilayers.- Optical spectroscopy can be used to probe the local atomic registry, i.e. how metal and chalcogen atoms are aligned in the top with respect to the bottom layer [3, 61, 114]. Here information can be
gleaned on the formation of nano-scale, periodic moir´e
potentials, see sample sketch in FIG. 4a. But similar to bilayer graphene, reconstruction can occur when two TMD layers are brought in contact, which can be visu-alised using imaging techniques such as transmission elec-tron microscopy (TEM) or scanning elecelec-tron microscopy (SEM). Recently Sushko et al. [15] reported SEM
imag-ing of hBN-encapsulated twisted WSe2bilayers showing
that a spatially varying reconstruction pattern develops due to the interaction between the respective layers
af-ter stacking, see FIG. 4b. Polarisation selection rules
probed in PL also carry information on different
stack-ings (H-type or R-type for 60◦ or 0◦ twist angle,
re-spectively) [160]. Therefore, polarisation-resolved opti-cal spectroscopy together with direct atomic-resolution imaging of the lattice is a very powerful combination for
analysing the formation of moir´e potentials [16]. The
PL experiment samples over a spot diameter of 1 µm,
whereas moir´e potentials can occur with a periodicity
of nanometers (see FIG. 4a), which leads to averaging ef-fects. The intrinsic lifetime of interlayer excitons is of the order of ns at low temperature and not ps as in mono-layers, which allows for imaging exciton and polarisation spatial diffusion in PL maps [161, 162]. The physics of both intralayer and interlayer excitons can be accessed in the monolayer and bilayer regions of the same sample, as in FIG. 4a and c.
Experiments in applied magnetic fields.- The cir-cular polarisation can be manipulated by applying exter-nal magnetic fields [163, 164]. Interesting examples are heterobilayers, where a giant Zeeman splitting of 26 meV at B = 30 T for interlayer excitons induces near-unity valley polarisation measured in PL emission [115]. In
monolayer MoSe2 a field of 7 T results in near unity
po-larisation of electrons probed in absorption and emission [165].
IV. OPTICAL TECHNIQUES FOR ACCESSING
CRYSTAL QUALITY AND ORIENTATION
Raman spectroscopy is based on the analysis of laser light scattered by a material. During this process
the crystal typically absorbs (or emits) energy in the form of lattice vibrations - phonons. The analysis of the scat-tered light’s energy and polarisation reveals information on the crystal symmetry and quality, doping and where applicable alloying and stacking in multilayers. A typical PL set-up (shown in FIG. 3) can be conveniently adapted to collect the Raman spectra by selecting a suitable set of filters according to the wavelength of the excitation laser. Typically, filters for Raman spectroscopy reject the
exci-tation laser with a cut-off frequency of few tens of cm−1
(≈ 10 meV from the single mode energy). The selection of laser wavelength λ has an important impact on the spectral sensitivity as the intensity of the Raman signal
is proportional to λ−4. Key parameters of the excitation
laser include spectral linewidth (≤1 MHz), frequency and power stability, spectral purity (≥65 dB side-mode sup-pression ratio), beam quality (close to Gaussian) and out-put power. The excitation wavelength in the Raman scat-tering of TMDs is also important because of the presence of excitonic states. When the photon energy matches the transition energy of a real state it gives rise to a strong signal enhancement and appearance of new features, as-sociated to symmetry dependent electron-phonon inter-actions (resonant Raman scattering) [166, 167].
Information on the structural phase and composition of materials can be obtained by means of Raman spec-troscopy [168]. This allows for example investigating cur-rently debated link between ferromagnetic ordering and
structural phase transitions in CrI3 [6] as a function of
temperature. Raman spectroscopy can reveal anisotropy
in the crystal structure of, for example, ReSe2, which can
be directly linked to measurements of anisotropic optical absorption in the same material [169]. Electron-phonon interactions can have significant effects on the Raman frequencies. As a result, doping effects can be effectively monitored in TMD monolayers for example with the
out-of-plane phonon, A01, due to its strong electron-phonon
coupling [170, 171]. It is also possible to extract quanti-tative information about the presence of uniaxial strain
since the in-plane phonon energy, E0, decreases with
ap-plying tensile strain and a splitting occurs (degeneracy is lifted) [172]. An estimation of the monolayer crystal qual-ity and presence of defects can be realised due to the ac-tivation of defect-induced zone-edge phonon modes, such as the LA(M) [173]. Furthermore, disorder and inter-ference effects originating from the substrate impact the intensity and spectral shape of the optical phonons in the monolayer [174]. A powerful and reliable means to determine the number of TMD layers with atomic-level precision is to measure the energy difference between the two main vibrational modes (E and A phonons), affected
by interlayer interactions [175]. Apart from the
high-frequency (≥ 80 cm−1) spectral range, the number of
layers can be identified by collecting optical signatures of the rigid layer vibrations (breathing and shear modes)
in the ultra-low frequency range [176]. In this case, im-portant information on the interlayer interaction and de-termination of the stacking order in multilayers can be obtained [29]. In TMD multilayers resonant Raman spec-troscopy can also provide a fingerprint of the extension of excitons over several layers, as otherwise symmetry for-bidden modes are activated for the so-called C-exciton re-gion [167] in energy above the A- and B-exciton. Raman spectroscopy can also be used to investigate the
com-petition between formation of periodic moir´e potentials
and local reconstruction (compare FIGs. 4a and b) in
artificially stacked WSe2/MoSe2 and bilayer MoS2 as a
function of twist angle [18, 177].
Second-harmonic generation (SHG) is a nonlinear optical process that converts two photons of the same frequency into one photon of twice the orignal frequency. It is a powerful technique to analyse the orientation and symmetry properties of 2D materials. For SHG experi-ments, the optical set-up is typically coupled to a pulsed laser that is capable of generating sufficient peak power for this nonlinear optical process. The SHG signal de-pends on the elements of the second-order
susceptibil-ity tensor χ(2) [102], which are vanishing for
non-centrosymmetric media (i.e. odd number of TMD lay-ers) along the armchair direction of TMDs, see FIG. 1a. This crystalographic direction can thus be directly deter-mined by rotating the linear polarisation in the experi-ment. The resulting polar plot of the SHG intensity re-veals the crystallographic orientation of the material, use-ful to precisely measure the relative twist angles (stack-ing) of homo- and heterobilayers [178], see FIG. 4e. Novel techniques exploit this effect to map with high spatial res-olution (≈ 400 nm) the armchair orientation in twisted
bilayers [179], as well as in large (> 104 µm2) monolayer
areas and evaluate their crystal quality since dislocations and grain boundaries can affect the armchair orientation i.e. change the lattice vector [180]. Also the presence of uniaxial strain can be quantified by measuring the SHG intensity along different polarisation directions [181].
The SHG response of a material does not only reflect the crystal structure but also depends on the electronic excitations [182]. The efficiency of the SHG signal can be enhanced by several orders of magnitude by selecting the excitation energy to be in resonance with excitonic states of the investigated materials [35]. This opens the way for investigating in general the role of electronic ex-citations (exciton resonances) on the SHG response of a material [183, 184]. Using the sensitive SHG response to detect the energy position of electronic transitions is
termed ’SHG spectroscopy’. In bilayer CrI3 SHG has
been shown to originate from the layered antiferromag-netic order, which breaks both the spatial inversion sym-metry and the time-reversal symsym-metry [5] of this centro-symmetric crystal. This makes SHG a highly sensitive probe also for magnetic ordering in layered materials.
[1] Ubrig, N. et al. Design of van der waals interfaces for broad-spectrum optoelectronics. Nature Materials 19, 299–304 (2020).
[2] Mounet, N. et al. Two-dimensional materials from high-throughput computational exfoliation of experimentally known compounds. Nature nanotechnology 13, 246–252 (2018).
[3] Seyler, K. L. et al. Signatures of moir´e-trapped valley excitons in mose 2/wse 2 heterobilayers. Nature 567, 66–70 (2019).
[4] Shimazaki, Y. et al. Strongly correlated electrons and hybrid excitons in a moir´e heterostructure. Nature 580, 472–477 (2020).
[5] Sun, Z. et al. Giant nonreciprocal second-harmonic gen-eration from antiferromagnetic bilayer cri 3. Nature 572, 497–501 (2019).
[6] Ubrig, N. et al. Low-temperature monoclinic layer stacking in atomically thin cri3 crystals. 2D Materials 7, 015007 (2019).
[7] Mak, K. F., Shan, J. & Ralph, D. C. Probing and controlling magnetic states in 2d layered magnetic ma-terials. Nature Reviews Physics 1, 646–661 (2019). [8] Paradisanos, I. et al. Prominent room temperature
valley polarization in ws2/graphene heterostructures grown by chemical vapor deposition. Applied Physics Letters 116, 203102 (2020).
[9] Zhong, D. et al. Van der waals engineering of ferro-magnetic semiconductor heterostructures for spin and valleytronics. Science Advances 3, e1603113 (2017). [10] Ciorciaro, L., Kroner, M., Watanabe, K., Taniguchi, T.
& Imamoglu, A. Observation of magnetic proximity effect using resonant optical spectroscopy of an electri-cally tunable mose2/crbr3 heterostructure. Phys. Rev.
Lett. 124, 197401 (2020).
[11] Lyons, T. P. et al. Interplay between spin proximity ef-fect and charge-dependent exciton dynamics in mose2 /
crbr3van der waals heterostructures (2020). 2004.04073.
[12] Sortino, L. et al. Enhanced light-matter interaction in an atomically thin semiconductor coupled with dielec-tric nano-antennas. Nature communications 10, 1–8 (2019).
[13] Paik, E. Y. et al. Interlayer exciton laser of extended spatial coherence in atomically thin heterostructures. Nature 576, 80–84 (2019).
[14] Zhang, C. et al. Interlayer couplings, moir´e patterns, and 2d electronic superlattices in mos2/wse2 hetero-bilayers. Science advances 3, e1601459 (2017).
[15] Sushko, A. et al. High resolution imaging of re-constructed domains and moire patterns in functional van der waals heterostructure devices. arXiv preprint arXiv:1912.07446 (2019).
[16] Andersen, T. I. et al. Moir\’e excitons correlated with superlattice structure in twisted wse 2/wse 2 homobi-layers. arXiv preprint arXiv:1912.06955 (2019). [17] Shree, S. et al. High optical quality of mos2 monolayers
grown by chemical vapor deposition. 2D Materials 7, 015011 (2019).
[18] Holler, J. et al. Low-frequency raman scattering in wse2
-mose2 heterobilayers: Evidence for atomic
reconstruc-tion (2020). 2004.14222.
[19] Zhao, Y., Ippolito, S. & Samor`ı, P. Functionalization of
2d materials with photosensitive molecules: From light-responsive hybrid systems to multifunctional devices. Advanced Optical Materials 7, 1900286 (2019).
[20] Cao, T. et al. Valley-selective circular dichroism of monolayer molybdenum disulphide. Nature communi-cations 3, 1–5 (2012).
[21] Xiao, D., Liu, G.-B., Feng, W., Xu, X. & Yao, W. Cou-pled spin and valley physics in monolayers of mos 2 and other group-vi dichalcogenides. Physical review letters 108, 196802 (2012).
[22] Mak, K. F., He, K., Shan, J. & Heinz, T. F. Control of valley polarization in monolayer mos 2 by optical helic-ity. Nature nanotechnology 7, 494–498 (2012).
[23] Sallen, G. et al. Robust optical emission polarization in mos 2 monolayers through selective valley excitation. Physical Review B 86, 081301 (2012).
[24] Zeng, H., Dai, J., Yao, W., Xiao, D. & Cui, X. Valley polarization in mos 2 monolayers by optical pumping. Nature nanotechnology 7, 490–493 (2012).
[25] Liu, Y., Stradins, P. & Wei, S.-H. Van der waals metal-semiconductor junction: Weak fermi level pinning en-ables effective tuning of schottky barrier. Science ad-vances 2, e1600069 (2016).
[26] Frindt, R. Single crystals of mos2 several molecular layers thick. Journal of Applied Physics 37, 1928–1929 (1966).
[27] Dickinson, R. G. & Pauling, L. The crystal structure of molybdenite. Journal of the American Chemical Society 45, 1466–1471 (1923).
[28] Wilson, J. A. & Yoffe, A. The transition metal dichalco-genides discussion and interpretation of the observed optical, electrical and structural properties. Advances in Physics 18, 193–335 (1969).
[29] Van Baren, J. et al. Stacking-dependent interlayer phonons in 3r and 2h mos2. 2D Materials 6, 025022 (2019).
[30] Frondel, J. W. & Wickman, F. E. Molybdenite poly-types in theory and occurrence. ii. some naturally-occurring polytypes of molybdenite. American Miner-alogist: Journal of Earth and Planetary Materials 55, 1857–1875 (1970).
[31] Mak, K. F., Lee, C., Hone, J., Shan, J. & Heinz, T. F. Atomically thin mos 2: a new direct-gap semiconductor. Physical review letters 105, 136805 (2010).
[32] Splendiani, A. et al. Emerging photoluminescence in monolayer mos2. Nano letters 10, 1271–1275 (2010). [33] Tonndorf, P. et al. Photoluminescence emission and
ra-man response of monolayer mos 2, mose 2, and wse 2. Optics express 21, 4908–4916 (2013).
[34] Moody, G. et al. Intrinsic homogeneous linewidth and broadening mechanisms of excitons in monolayer tran-sition metal dichalcogenides. Nature communications 6, 1–6 (2015).
[35] Wang, G. et al. Giant enhancement of the optical second-harmonic emission of wse 2 monolayers by laser excitation at exciton resonances. Physical review letters 114, 097403 (2015).
[36] Korm´anyos, A. et al. k· p theory for two-dimensional transition metal dichalcogenide semiconductors. 2D Materials 2, 022001 (2015).