HAL Id: hal-01736916
https://hal.archives-ouvertes.fr/hal-01736916
Submitted on 18 Mar 2018HAL is a multi-disciplinary open access archive for the deposit and dissemination of sci-entific research documents, whether they are pub-lished or not. The documents may come from teaching and research institutions in France or abroad, or from public or private research centers.
L’archive ouverte pluridisciplinaire HAL, est destinée au dépôt et à la diffusion de documents scientifiques de niveau recherche, publiés ou non, émanant des établissements d’enseignement et de recherche français ou étrangers, des laboratoires publics ou privés.
high-density cobalt antidot arrays
L. Rodriguez, C. Magen, Etienne Snoeck, Christophe Gatel, C.
Castán-Guerrero, J. Sese, L García, J. Herrero-Albillos, J. Bartolome, F.
Bartolome, et al.
To cite this version:
L. Rodriguez, C. Magen, Etienne Snoeck, Christophe Gatel, C. Castán-Guerrero, et al.. High-resolution imaging of remanent state and magnetization reversal of superdomain structures in high-density cobalt antidot arrays. Nanotechnology, Institute of Physics, 2014, 25 (38), �10.1088/0957-4484/25/38/385703�. �hal-01736916�
High resolution imaging of remanent state and
magnetization reversal of superdomain structures
in high-density cobalt antidot arrays
L A Rodríguez1,2,3,4, C Magén1,2,3,5*, E Snoeck3,4, C Gatel3,4, C Castán-Guerrero2,6, J Sesé1,2, L M García2,6, J Herrero-Albillos5,6,7, J Bartolomé2,6, F Bartolomé2,6 and M R Ibarra1,2,3
1. Laboratorio de Microscopías Avanzadas (LMA), Instituto de Nanociencia de Aragón (INA), Universidad de Zaragoza, 50018 Zaragoza, Spain.
2. Departamento de Física de la Materia Condensada, Universidad de Zaragoza, 50009 Zaragoza, Spain.
3. Transpyrenean Associated Laboratory for Electron Microscopy (TALEM), CEMES-INA, CNRS-Universidad de Zaragoza, Toulouse, France.
4. CEMES-CNRS 29, rue Jeanne Marvig, B.P. 94347 F-31055, Toulouse Cedex, France 5. Fundación ARAID, 50018 Zaragoza, Spain.
6. Instituto de Ciencia de Materiales de Aragón (ICMA), Universidad de Zaragoza-CSIC, 50009 Zaragoza, Spain.
7. Centro Universitario de la Defensa, Ctra. de Huesca, E-50090 Zaragoza, Spain.
*Email: cmagend@unizar.es
Abstract
Remanent state and magnetization reversal processes of a series of cobalt antidot arrays with a fixed hole diameter (d ≈ 55 nm) and an array periodicity (p) ranging between 95 and 524 nm have been studied by in situ Lorentz microscopy (LM) as a function of the magnetic field. At remanence, defocused LM images showed the periodicity dependence of the magnetic states inside the lattice. A remarkable transition was observed in the type of domain structures as a function of p: for the large periodicities (p > 300 nm), conventional 90º and 180º domain were formed, whereas in small-period antidot arrays (p ≦160 nm) magnetic superdomain walls (SDWs) were nucleated to separate regions with different average magnetization direction, the so-called magnetic superdomains. In the SDW regime, a low-frequency Fourier filtering method was implemented to allow a quantitative analysis of the LM images by the transport of intensity equation method. In situ LM experiments under applied magnetic fields were performed to study the reversal magnetization process in a particular array (p = 160 nm), and clear differences were observed as a function of the magnetic field orientation. The switching process under magnetic fields parallel to the horizontal antidot rows occurs in two stages: the system first nucleates and
propagates horizontal SDWs, parallel to the field. Then, at higher magnetic fields, vertical SDWs, perpendicular to the field, appear before saturation. When the magnetics field is applied at 45º with respect to the antidot rows, both horizontal and vertical SDWs are nucleated and propagated simultaneously. All the experiments were successfully correlated with micromagnetic simulations. The current study sheds new light on the magnetization reversal processes of antidot arrays and opens new possibilities of exploiting the potential of high-resolution in situ LM and new data analysis procedures to probe magnetization processes in nanomagnetism, particularly in periodic arrays of nanomagnets.
Keywords: magnetic antidot arrays, in situ Lorentz microscopy, magnetic superdomains, magnetization reversal, transmission electron microscopy
PACS numbers: 68.37.Lp, 81.16.Rf, 75.60.Jk, 75. 78.Cd
1. Introduction
The inclusion of holes, also called antidots, in a ferromagnetic thin film was considered as a viable alternative for favorably modifying their magnetic behavior in order to establish individual magnetic entities in confined geometries that could be used as magnetic bits of information in storage media with potential densities up to 10 Gbits/cm2 [1]. To this end, considerable effort was made to understand and control local magnetic states and to optimize the fabrication techniques aimed at producing functional devices with high storage capacity [24]. Antidots act as pinning centers that control the nucleation and propagation of domain walls (DWs) through film [5, 6] and induce a local shape anisotropy that tends to align the magnetization parallel to their edges. As a consequence, the presence of antidots in a continuous film induces a dramatic increase in the coercive field [2, 5, 716], a geometry-dependent magnetoresistance behavior [5, 7, 1720] and the formation of complex magnetic domain structures at remanence such as superdomains. The latter are exotic magnetic domain structures characterized by a common average magnetization while presenting inhomogeneous magnetization inside an antidot cell [21]. Neighboring superdomains with different average magnetization are separated by superdomain walls (SDWs). The geometrical confinement of the magnetization between holes may find different applications: in the field of information storage, the magnetic entity surrounded by nearest antidots can be used as memory bits [2, 3, 9, 22, 23], whereas the antidote arrays as a whole can be used as a magnonic crystal for spin wave filters and guides where the spin wave excitations depend on the period and the size of the holes [24, 25].
Different antidot geometries have been tested. Both rectangular [210, 12, 13, 1517, 2124] and hexagonal arrays [1, 5, 11, 14, 17, 20, 26] have been fabricated by electron beam
lithography, porous templates, or self-assembly. More recently, modern lithography techniques such as focused ion beam (FIB) etching has been used to fabricate two-dimensional antidot arrays with sub-micron periodicities [13, 15, 16, 27]. Such patterning methods have been optimized to reduce the dimensionality of the magnetic regions and therefore increase the storage density or fine-tune the magnonic band structure. Such high-density antidot arrays require the use of advanced magnetic characterization techniques to study quantitatively the magnetic configuration and the magnetization reversal processes of antidot arrays with high spatial resolution and sensitivity. Current technology provides different options for image magnetization processes in magnetic structures with high spatial resolution: magnetic force microscopy (MFM) and spin-polarized scanning tunneling microscopy (SP-STM), spin-resolved transmission x-ray microscopy, photoemission electron microscopy, spin polarized low-energy electron microscopy (SPLEEM), scanning electron microscopy with polarization analysis (SEMPA) and Lorentz microscopy (LM) are some examples [28]. These techniques present various spatial resolutions (tens of nanometers for MFM down to atomic resolution in SP-STM) and flexible conditions for in situ sample preparation and modification of external biases (such as x-rays techniques or SPLEEM), and some of them are non-destructive. Among them, LM provides the unique combination of quantitative local magnetic imaging of magnetic configurations with a spatial resolution of few nanometers (sub-nanometer in aberration-corrected LM), and the capability to apply in situ magnetic fields to visualize magnetization reversal processes by a relatively accessible transmission electron microscopy (TEM) technique [28, 29]. Even though LM has been used to explore antidot arrays with periodicities higher than
1 m [27, 30, 31], we exploited the full potential of in situ LM and optimized image analysis to explore the magnetic configurations of square cobalt antidot arrays with a wide range of periodicities p = 95-524 nm and an antidot diameter of d ≈ 55 nm. When the antidot diameter approaches the array periodicity at this length scale, the antidot separation (defined as p–d) is comparable to the exchange length and the system approaches the crossover from a continuous magnetic media (antidot regime) to an array of discrete nanomagnets (the dot regime) [16], which is of great interest for technological applications in data storage. In this regime of small array periodicities, we have analyzed the remanent magnetization configuration, observing the presence of SDWs and the formation of magnetic chains (MCs), and investigated the magnetization reversal processes of these nanostructures by in situ LM as a function of the magnetic field.
Square cobalt antidot arrays were fabricated on a 50-nm-thick electron-transparent Si3N4 membrane for TEM experiments. Following the same protocol published in reference [16], a continuous 10-nm-thick polycrystalline film of cobalt was first deposited by sputtering, completely covering the membrane area (250250 m). In a second step, hole arrays were created by FIB etching in the continuous film using the focused Ga+ ion beam of an FEI Helios 650 Dual Beam system. Each hole was etched by a single spot of the ion beam. Antidot diameter is defined by three parameters: the ion beam current (I), the acceleration voltage (V), and the dwell time of the beam at each spot. The parameters used for the antidot arrays studied in this work were I = 24 pA, V = 30 kV and dwell time = 10 ms, to produce a hole size of d ≈ 55 nm, as will be shown later. The large area of the Si3N4 membrane allowed us the creation of several arrays where the array periodicity (p), defined as the center-to-center hole distance, was varied from 524 to 95 nm. LM experiments in Fresnel mode and off-axis electron holography were performed in an image aberration corrected FEI Titan3 60-300 microscope, equipped with a Lorentz lens for TEM imaging in field-free conditions integrated as part of the aberration corrector (CETCOR from CEOS). The versatility of LM permits working not only at remanence but also with the application of an external magnetic field. Standard LM implies operating in a field-free environment by switching off the objective lens of the microscope and then using an additional lens (Lorentz lens) located far from the sample to image the magnetic sample (with a lower spatial resolution). However, it is possible to slightly excite the objective lens to apply magnetic fields up to 4000 Oe and perform in situ magnetization reversal experiments in nanostructures. Tilting the sample allows the projection of a component of the magnetic field in any direction of the sample plane, as discussed in [45]. Due to the strong in-plane shape anisotropy of ultrathin cobalt films, the out-of-plane component has a negligible effect on the reversal process. Thus, we have used this capability to image hysteresis loops with in-plane magnetic fields parallel and diagonal to the square antidot lattice. Micromagnetic simulations have been performed by GPMagnet software package to interpret the remanent states and magnetization reversal processes observed by in situ LM experiments.
3. Results
3.1. Magnetic imaging by Lorentz microscopy and electron holography
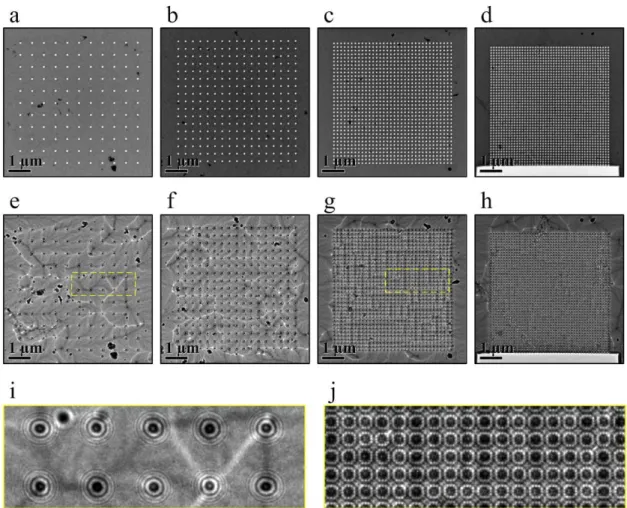
The low magnification bright field TEM image of cobalt antidot arrays with p = 160 nm shown in figure 1(a) illustrates the morphology of the system, where bright spots correspond to the holes forming a square lattice. The FIB etching process was optimized to fabricate circular holes with the smallest diameter possible. Figure 1(b) shows a high-magnification bright-field TEM image of the array with p = 116 nm. It shows that the holes are slightly elliptical, elongated
along the y-direction. If we consider in the TEM image only the brightest regions as an indication of hole size, the average hole diameters are 54 1 nm and 58 1 nm along the x- and
y-directions, respectively. Furthermore, small differences between center-to-center holes
distances along the x- and y-directions, px and py, indicate that the lattice is not perfectly squared. For the sake of clarity, we will use the values of px to define the array periodicity, p. The lattice parameters of the antidot arrays studied are presented in the Table 1. From figures 1(b) and (c), we identified four different regions within the lattice that can be clearly identified as a consequence of the Ga irradiation [16]: (i) the brightest regions, which are the physical holes where the FIB has drilled completely through the membrane; (ii) a small corona of ~ 6 nm in width surrounding the hole edges where the thickness varies due to the Gaussian-shaped FIB probe; (iii) amorphous areas formed by the Ga+ ion irradiation from the FIB etching that degrade the cobalt film, inducing Ga implantation and Co/substrate intermixing; and (iv) unaltered areas where the properties of the original metallic cobalt film are preserved. This is the typical morphology observed in antidot arrays fabricated by FIB [13, 16, 27]. In particular, areas (ii) and (iii) correspond to the Ga-damaged areas recently characterized by TEM by Castán-Guerrero and co-workers as a region of approximately 30 nm around the hole where the Co film suffers from Ga implantation and amorphization, which gives rise to a change in the effective diameter of the hole from a magnetic point of view. For antidot arrays fabricated on Si substrates with nominal holes of 80 nm, an effective diameter of 112 nm was estimated [16]. As observed in figure 1(c), the hole fabrication process makes the FIB-damaged areas progressively increase when p is reduced, and at small periodicities (i.e., p = 85 nm), they achieve the complete isolation of the original metallic cobalt regions between holes. Ga-induced amorphization is evident in figures 1(b) and (c) by the loss of diffraction contrast observed in areas (ii) and (iii). Depending on the fabrication conditions, the alteration of the amorphous regions could be sufficient enough to degrade and even suppress the magnetism of the cobalt film, thus defining an effective antidot size (accounted for the non-magnetic area) higher than the physical size [16]. This is further supported by the electron holography experiments displayed in figure 2 that were performed on the arrays with p = 160 nm and p = 95 nm. The electrostatic phase shift images in figures 2(a) and (c) are proportional to the mean inner potential of Co times the film thickness [32]. These images are color coded from yellow in areas with continuous homogeneously thick Co to reddish tones in areas with diminished thickness and/or density. The dark regions correspond to the real holes. The line profiles shown in figure 2(e) demonstrate that whereas in the array with p = 160 nm the areas between the antidots remain virtually unchanged, in p = 95 nm there is a clear decrease in the electrostatic phase shift down to 60% of the value obtained in the continuous film. This point is supported by the magnetic flux configuration reported in figures 2(b) and (d). Whereas a clearly magnetized state is seen between the holes for p = 160 nm, as evidenced by continuous flux lines contouring the
antidots, the same study for the p = 95 nm array presents no or very sparse magnetic flux lines, with no clear geometric distribution, as a consequence of the depressed magnetism caused by Ga irradiation.
The exploration of the remanent magnetic configurations of the antidot arrays was carried out by LM in Fresnel mode. This allows the direct visualization of magnetic structures by the observation of DWs when they are imaged out of focus [3336]. Detailed information about the image formation process in Fresnel mode is presented in the supplementary information. To study the magnetic configuration of the antidot arrays in a remanent state, a demagnetizing protocol was performed by the application of an oscillating magnetic field cycle along the x-direction, as defined in figure 1, where the amplitude of the field was progressively reduced from saturation to zero while wobbling the sample tilt. A series of in- and out-of-focus LM images for cobalt antidot arrays with different periodicities (p = 524, 327, 160 and 116 nm) is depicted in figure 3. Bright and dark lines corresponding to DWs are easily observed in the continuous film surrounding the patterns and inside the antidot arrays with large periodicity, p = 524 and 327 nm (see figures 3(e-f)). In this case, DWs are randomly distributed, with a clear tendency to run across two antidot positions. Studying the magnetic configuration in these two arrays, we observe that reduction of the periodicity increases the density of the DWs nucleated inside the antidot lattice, as a direct consequence of the increasing number of pinning centers. However, for antidot arrays of smaller periodicities, p = 160 and 116 nm, the geometry of the DW structure drastically changes toward a pattern of straight lines with weak contrast variations along the antidot rows. Castán-Guerrero et al recently proposed that a maximum observed in the coercivity of arrays around p = 150 nm corresponds to a crossover between the antidot regime and a dot regime of independent magnetic entities [16]. A dot regime would present a much-reduced volume of magnetic cobalt, which would corroborate the sharp decrease in magnetic contrast in the LM images observed between p = 160 and 116 nm.
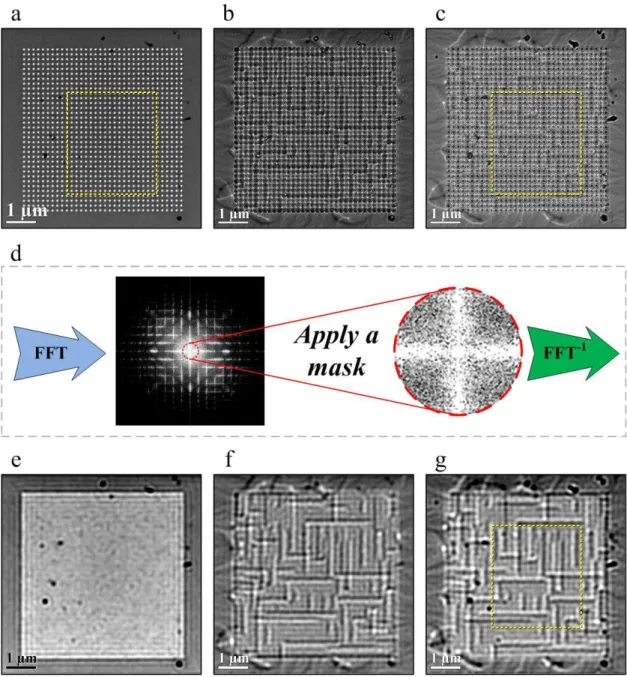
Quantitative interpretation of the domain structure nucleated in antidot arrays with small p from defocused LM images is not straightforward. In addition to the bright/dark DW contrasts, Fresnel fringes arising from the interference between the electrons passing through a the hole and those interacting with the film [37] form a series of concentric rings around each hole in defocused LM images, as illustrated in figure 3(i). For small p, figure 3(j) shows how the Fresnel fringes from neighboring antidots overlap, masking the magnetic contrast produced by the array itself. Therefore, they are a serious drawback in studying the magnetism of antidot arrays with small periodicities. To overcome this difficulty, was applied a filtering method to highlight the magnetic contrast between the antidots with small periodicity. Calculating the fast Fourier transform (FFT) of the LM images, we obtain a square pattern of spots in the Fourier space, which was related to the periodicity of the antidot array in the real space. Masking the
spots in the Fourier space and calculating the inverse Fourier transform (FFT-1), it was possible to minimize the effect of the Fresnel fringes and extract the low-frequency information caused by the magnetic contrast only. An example of the application of this low-frequency Fourier filtering method to the cobalt antidot array of p = 160 nm is illustrated in figure 4. FFTs were extracted from in-, over- and under-focus LM images (figures 4(a)(c)) and filtered using a circular mask that collected information only around the central spot of the FFT, which contained the magnetic information for the DWs, setting its radius smaller than the closest diffraction spot (see figure 4(d)). The maximum electron beam deflection caused by 10-nm-thick pure cobalt film was approximately 0.086 mrad. This defined a region of the FFT in which the magnetic information was confined, within a radius of 4.35 10-3 nm-1. This is equivalent to a distance in real space of 230 nm. Consequently, in the range of array periodicities most studied here (p ≤ 160 nm), the periodicity coming from the antidot lattice could be filtered out without losing any significant magnetic information. The FFT-1 of the masked FFT pattern led to the filtered LM images in figures 4(e)(g), where the contrast arising from the hole array was suppressed and the contrast due to the magnetic contrast was enhanced. This procedure was also applied to antidot arrays with p = 138, 116 and 95 nm. As shown in figures 5(a), (b), (d), and (e), the magnetic contrasts observed for p = 138 and 116 nm were similar to those found for antidot arrays with p = 160 nm, whereas it was not possible to visualize the formation of magnetic entities for p = 95 nm (figures 5(c) and (f)). Arrays with smaller periodicities were also observed by LM (not shown here), and likewise no magnetic contrast was found. Two factors could have contributed to the non-visualization of magnetic contrast: (i) the reduction of the hole spacing increased the overlapping of the Fresnel fringes, further degrading the quality of the LM images; (ii) as shown in figure 1(c), the reduction in periodicity also increased the extent of the damaged areas, which could have depressed the magnetism of the array. The significance of the latter can be deduced from the comparison of the magnetic contrast of figure 5(d)(e), where the intensity of the magnetic contrast gradually decreases with p. Therefore, these results demonstrate the capability of LM to evaluate, in a first approach, the magnetic configuration of cobalt antidot arrays with periodicities down to 116 nm by the direct visualization of magnetic contrasts. Moreover, further quantitative information can be extracted by mapping the magnetization as shown below.
3.2. Remanence state
The remanent magnetic configuration of cobalt antidot arrays was quantitatively studied using the transport of intensity equation (TIE) procedure, which is described in more detail in the SI. Following this method, the in-plane magnetic induction could be mapped from a focal series of LM images [38]. A color map of the magnetic induction of the antidot array with the largest
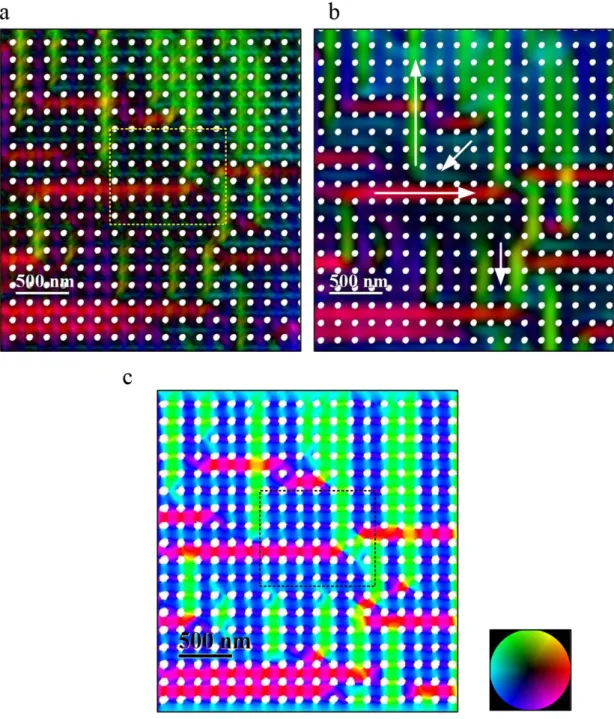
periodicity (p = 524 nm) is shown in figure 6(a) and shown further magnified in figure 6(b). Magnetic domains of different sizes and magnetization orientation formed inside the array. Focusing on a small region in the middle of the array, we observed that the magnetic domains were formed by 90º and 180º DWs, similar to those observed at remanence in continuous cobalt ultrathin films [3941]. In such an array, the holes appeared to affect the magnetic configuration mostly as pinning centers for DWs connecting them. Only in some cases we observed how the local magnetization turned around a single antidot, forming a flux closure. TIE reconstructions were also performed in the antidot array with p = 160 nm; the focal series of both raw and filtered images is displayed in figure 7. The comparison between the unfiltered reconstruction in figure 7(a) and the Fourier filtered in figure 7(b) demonstrates the efficiency of the Fourier filtering method in enhancing the magnetic contrast, allowing a clear and smooth image of the DWs to resolve more clearly the magnetization orientation in the TIE-reconstructed series. Direct comparison between the filtered defocused LM image in figure 4(g) and the magnetic reconstructions of figures 7(a) and (b) leads to the conclusion that the pairs of bright and dark straight lines constitute a type of stripe-shaped magnetic domains oriented along the horizontal and vertical directions of the hole lattice, similar to those imaged by magnetic force microscopy and x-ray photoemission electron microscopy in square antidot arrays with sub-micron hole spacing [10, 16, 21, 42]. For this particular remanent state, the color scale indicates that a large population of magnetic stripes had an average magnetization direction pointing up (green stripes) and left (red stripes). Between these magnetic stripes, regions (in violet, blue and cyan) were observed in which the average magnetization direction was not clearly determined. To improve the interpretation of the experimental LM results, a micromagnetic simulation of this specific remanent state was carried out using the GPMagnet package [43]. For this calculation, we used the exact physical geometry of the corresponding region using the in-focus LM image (yellow box in figure 4(a)). The starting configuration of the remanent state was defined by taking the average magnetization direction of the magnetic stripes extracted from the TIE reconstruction of figure 7(b) as a reference, assuming that the magnetization direction in the regions between the stripes pointed diagonally relative to the lattice (at 225º with respect to the
x-axis). For the micromagnetic simulation, a cell size of 5510 nm was defined and the following magnetic parameters for cobalt were used: saturation magnetization = 1400 103 A/m; exchange constant = 30 10-12 J/m [44]. The magnetocrystalline anisotropy constant was assigned the value 0 because of the combined effect of the small grain size of the polycrystalline cobalt film and the dominance of the shape anisotropy due to the small thickness of the film with respect to the in-plane distance between the antidots. The micromagnetic simulation was then run to minimize the total magnetic energy of the system. The resulting simulated magnetization state of the array depicted in figure 7(c) was substantially in agreement with the
experimental one, even though small differences were detected. The simulation could then be used to analyze in more detail and with higher spatial resolution the local magnetization around the holes. Both the experimental and simulated remanent states in fact exhibited small color variations along the magnetic stripes, indicating that the local magnetization direction was changing slightly inside each domain. Therefore, we performed TIE reconstruction of a smaller area (1.0 0.9 m2) with a higher spatial resolution. The resulting magnetic map is shown in figure 8(a), together with the simulated vector-color map of the same region (figure 8(b)). At this scale, both the experimental and the simulated results showed a similar remanent magnetic configuration of the cobalt antidot array that is schematized in figure 8(c). In the region enclosed by the two nearest neighboring holes (the Type 1 region in figure 8(c)), the magnetization was aligned horizontally or vertically parallel to the antidot rows. In the regions enclosed by the four nearest neighboring holes (the Type 2 regions in figure 8(c)), the dipolar effects introduced by the antidots oriented the magnetization diagonally with respect to the lattice. These magnetic configurations are comparable to those reported in previous works on magnetic square antidot arrays with hole periodicities up to 400 nm [10, 12, 19, 21]. Similarly to [19], we can assume that each magnetic unit cell; i.e. the area enclosed by the dotted yellow line in figure 8(c), is composed by five domains (four Type 1 and one Type 2) whose integration results in a mean magnetization vector. The regions of the array composed of consecutive magnetic cells with the same average magnetization vector from magnetic domains are superdomains, separated by SDWs [21], which have already been observed in cobalt antidot arrays [10, 31, 42]. In most cases, SDWs separate two neighboring cells with different average magnetization orientation by a continuous in-plane rotation of the magnetization through the
Type 1 region that connects them. At remanence, the square antidot array induces head-to-tail or
tail-to-head 90º SDWs. These types of walls are referred as low-energy superdomain walls (LE-SDWs) because they favor lower stray fields and exchange energy [21]. In the defocused LM images, depending on the magnetic configuration and the defocus value, the SDWs can produce bright or dark lines depending on the relative orientation of the Lorentz force caused by the magnetization at both sides of the SDWs. This fact is described in the SI. Our experimental results also indicate that between large superdomains, magnetic stripes appear along either single rows or columns of magnetic cells with the same average magnetization vector. These unit-cell-width superdomains are called magnetic chains (MC) [42] and are limited by two parallel head-to-tail SDWs of different Lorentz force (LF) orientations. As we will see later, MCs are nucleated to favor the magnetization switching of the array.
Magnetization reversal in antidot arrays with large periodicities (p > 160 nm) does not differ much from that of a continuous film, so no further detailed analysis was carried out. It takes place by nucleation and propagation of DWs until saturation is reached, with the particularity that DWs tend to connect a few antidots. The propagation then occurs by a sequence of depinning and pinning steps between different sets of antidots until saturation is reached. At the same time, a comprehensive analysis of the magnetization reversal mechanisms of the antidot array with p = 160 nm has been carried out by performing hysteresis loops with the in-plane component of the magnetic field horizontal (parallel to the antidot rows) and diagonal (at 45º with respect to the antidot lattice). These correspond to the magnetization hard axis (HA) and easy axis (EA), respectively [19, 31]. For this experiment, the sample was tilted by 16.7º with respect to the zero-tilt holder plane, where the ratio between the in-plane and the out-of-plane components was k = 0.3 [45]. Videos of the magnetization reversal processes can be found online in SI.
Two series of defocused LM images highlighting the most relevant behavior of the reversal processes along the HA (horizontal) and EA (diagonal) are represented in figures 9 and 10, respectively. In both cases, the magnetization switching occurs by the nucleation and propagation of SDWs, with the predominant formation of MCs. The magnetization reversal is, however, different along the HA and EA hysteresis loops. In the EA hysteresis loop, horizontal and vertical MCs nucleate at the edges of the lattice (see figure 9 at H = −132 Oe) and then propagate toward the center of the array with similar probability, as can be deduced from figure 9 at H = −227 Oe. At H = −320 Oe, just before saturation, small magnetic domains remain in the lattice as a result of the collapse of long MCs into single-cell MCs where magnetic flux closes around single antidots. On the other hand, the magnetization reversal in the HA hysteresis loop occurs initially by the nucleation and propagation of MCs parallel to the direction of the applied field (figure 10 at H = −110 Oe) and, just before saturation, by the formation of MCs in the perpendicular direction (at H = −194 Oe). We observe that some vertical MCs are nucleated after the saturation magnetic field along the horizontal is removed (see figure 10 at H = 0 Oe). This demonstrates that the perpendicular (vertical) direction of the antidot array is indeed the HA, and SDWs appear with a higher magnetic field (coming from saturation). In contrary, in the hysteresis loop with the horizontal magnetic field, no SDW is nucleated down to H = 0; thus, the system remains saturated in remanence, as expected along the EA.
Quasi-static micromagnetic simulations following the same protocol as the experiment previously described were performed to simulate the HA magnetization reversal process. To reduce computation time, we simulated a square antidot lattice of 3.0 2.7 m, smaller than the real one. In addition, the antidot array was constructed in the middle of a continuous thin film of
5.0 4.5 m so that the effect of the continuous magnetic region surrounding the antidot array was taken into account in the simulation. The results are displayed in the right panel of figure 10, next to the experimental LM images obtained for the same applied magnetic fields. The magnetic induction along x and y has been plotted independently to highlight the presence of horizontal/vertical MCs. Due to the different array size, specific details may differ between the simulation and the in situ experimental LM images, but as a whole the micromagnetic simulations of the HA hysteresis loop show the same behavior observed in the in-situ experiments. In particular, the simulation reproduced the two-step magnetization reversal: first, as the magnetic field decreased from saturation the simulation reproduced the magnetic hardness of the x-axis by showing the formation of a few MCs with magnetization perpendicular to the magnetic field direction (stage 1 in figure 10); then, at negative fields, the simulation showed the nucleation and propagation of SDWs parallel to the applied field (stage 2) and then the nucleation and propagation of SDWs in a perpendicular direction in stage 3. The simulation also revealed remaining small magnetic domains just before saturation. Similar micromagnetic simulations were carried out for the EA hysteresis loop (not shown here) and agree with the experimental observations of the reversal process. Figure 11(a) depicts in more detail a sequence of simulated vector-color maps extracted from the small region delimited by the black dashed lines in the simulations in figure 10. The corresponding hysteresis loop calculated with the x-component of the magnetic induction is displayed in figure 11(b) together with the same hysteresis loop calculated from the simulation (not shown here) for the EA. The nature of the in-plane EA and HA is subtle but observable in these hysteresis loops. Even though the coercive field is nearly the same within the experimental error (HC = 92(7) Oe for the EA, HC = 100(7) Oe for the HA), the EA presents a bit higher remanence magnetization (Mr = 1341(2) kA/m for EA, Mr = 1288(2) kA/m for HA) and a sharper saturation than the HA.
Starting at positive saturation (Hx/Hs = +1.0, where Hs = 77 mT), the entire magnetization was completely parallel to the x-direction. When the magnitude of the magnetic field was reduced progressively to zero (Hx/Hs = 0), the demagnetizing field of the array controlled the magnetization orientation, rotating the magnetization at 45º with respect to the positive x-axis in the Type 2 regions. The square symmetry of the array offers two orientation possibilities for the magnetization: it rotates either +45º or -45º with respect to the x-axis. Both the experimental results and the simulation demonstrate that at this stage there is a preferential magnetization rotation that allows the creation of large superdomains and one less likely that favors the nucleation of vertical MCs. At Hx/Hs = −0.1, we observe that the magnetization switching inside the extended superdomains continues through the nucleation of horizontal MCs, while the vertical MC remains almost unaltered. At Hx/Hs = −0.6, the mean magnetization within the large superdomains has turned negative, nearly parallel to the applied field. However, the competition between the demagnetization energy and the Zeeman energy due to the external field causes the
magnetization orientation in the Type 2 regions to be tilted slightly up or down with respect to the negative x-axis, favoring the formation of vertical MCs. On the other hand, in the vertical MC nucleated at remanence (Hx/Hs = 0), this energy competition makes the average magnetization direction point vertically. This highly stable magnetic configuration induces 180º vertical SDWs, as observed in figure 11 at Hx/Hs = −0.6. When increasing the negative applied field (Hx/Hs = −0.7) even more, the vertical MCs collapse into two single-unit-cell magnetic domains. This very last magnetic domain finally switches at saturation (Hx/Hs = −1). Summarizing, it is worth noting that each stage of the magnetization reversal process gives a particular behavior of the hysteresis loop plotted in figure 11(b): (1) the formation of vertical MCs slightly reduces the Mx value at H = 0; (2) the magnetization switching of horizontal MCs produces an abrupt drop in Mx across the coercive field; (3) the formation and switching of vertical MCs produces a slight variation in Mx, and (4) single-unit-cell magnetic domains are still present at high magnetic fields, just before saturation of the magnetization parallel to the magnetic field.
A careful analysis of the hysteresis loops along the easy and hard magnetization axes (see videos in the online SI) indicates that whereas the MCs tend to propagate easily along the superdomains as the magnetic fields increase, the eventual crossing of chain ends belonging to orthogonal MCs in an antidot cell causes a very energetically stable pinning center. Although MCs with free ends propagate in a continuous way, orthogonal magnetic chains with their ends pinned together are not depinned until the magnetic field increases up to near saturation. Heyderman et al have already reported this phenomenon in electron beam lithographed antidot arrays with higher period (p > 200 nm) [10]. These authors also report the tendency of the MCs to align their chain ends, which was not observed in our experiments. Along these lines, it is noteworthy that in addition to our smaller period, the Ga irradiation effect produces larger effective hole diameters. Thus the magnetic regions between the holes are further reduced, and significant discrepancies are expected.
4. Conclusion
High-resolution in situ Lorentz microscopy enabled us to provide a description of the magnetization states of cobalt square antidot arrays with periodicities down to 116 nm, both in remanence and under magnetic field, with unprecedented detail. For antidot arrays with large periodicities (p 327 nm), a direct visualization of the DW structure was possible through out-of-focus LM images, providing evidence that the remanent magnetic configuration inside the array was controlled by the periodicity of the lattice. For 160 p 116 nm, an original method was implemented to highlight the magnetic contrast in the defocused LM images to analyze the magnetic domain structure in antidot arrays with small p. A low-frequency Fourier filtering
procedure enabled the visualization and quantitative analysis of the lineal magnetic contrast produced by SDWs. At remanence, extended superdomains and MCs composed the magnetic configuration of the antidot array with p = 160 nm. For even smaller periodicities, i.e. for p 95 nm, the proximity of the antidots and the increasing proportion of the regions damaged by the FIB etching around the holes prevented the detection of a magnetic signal inside the array. The depressed magnetism in the areas around the antidot was demonstrated by combined TEM and electron holography experiments, confirming from a magnetic point of view the formation of an effective hole diameter higher than the nominal one. This is a critical feature of this type of antidot arrays that should be taken into account in the design of antidot arrays for information storage or magnonic applications. The higher effective diameter of non-magnetic antidots will surely affect the critical periodicity for an antidot-to-dot regime transition in the search for individual magnetic bits but will also influence the effective dispersion relation for spin waves for eventual high-frequency applications as spin wave filters or guides [24, 25].
In situ LM experiments in magnetic fields applied along the easy and hard axis of the array
enabled visualization of the reversal magnetization process with high spatial resolution. In the case of antidot arrays with large p, even though the antidots acted as very active pinning centers for domain wall propagation, magnetization switching occurred similarly to the case of a continuous film. In the antidot array with p = 160 nm, magnetization reversal occurred by means of nucleation and propagation of SDWs, with a predominant tendency to form MCs. The reversal process differed depending on the orientation of the applied magnetic field. Magnetic fields applied along the diagonal of the array (the magnetization hard axis) yielded a simultaneous nucleation and propagation of vertical and horizontal SDWs, preferentially forming MCs at the edge of the lattice and then propagating toward the center. Finally, MCs collapsed into small magnetic domains of single-unit-cell size just before magnetic saturation. Horizontal magnetic fields (along the magnetization easy axis) switched the magnetization in two stages, beginning the process by nucleation and propagation of horizontal MCs and then approaching saturation by nucleating vertical MCs. As in the easy axis case, MCs eventually collapsed into single-cell domains before complete saturation. Intersecting MCs with meeting chain ends were shown to be highly stable and remained strongly pinned upon increase of the applied magnetic field until the finally propagated near saturation.
Potential applications for data storage in magnetic media or magnonic crystals for applications in spin wave filters or guides call for further scale reduction of the magnetic structures used. Thus, a careful analysis of the influence of the fabrication methods on the magnetically active material and its influence in the magnetization reversal process is critical to tune device geometry. Both the magnetization switching process in quasi-static magnetic fields for information storage and the high-frequency spin precession for magnonics will surely be
affected by the higher effective diameter of non-magnetic antidots and the onset of the antidot-to-dot regime transition [24, 25]. With this in mind, the comprehensive analysis of the magnetization switching processes in antidot arrays with the short periodicities presented in this work demonstrates that the combination of high-resolution LM, in situ application of magnetic fields, and new data analysis protocols to optimize magnetic contrast open new opportunities for a versatile and straightforward quantitative imaging of magnetization processes in low-periodicity arrays of nanomagnets.
Acknowledgements
This work was partially supported (including FEDER funding) by the Spanish Ministry of Economy and Innovation (MINECO) through projects 28532-C03-02, MAT2011-23791 and MAT2012-38318-CO3;by the Aragón Regional Government through Projects E26 (MAGNA), E34 (IMANA), and CTPP4/11; and by the European Union under the Seventh Framework Program under a contract for an Integrated Infrastructure Initiative, Reference 312483-ESTEEM2. C. Castán-Guerrero acknowledges a JAE-Predoc grant from CSIC.
References
[1] Xiao Z L, Han C Y, Welp U, Wang H H, Willing G A, Vlasko-Vlasov V K, Kwok W K, Miller D J, Hiller J M, Cook R E and Crabtree G W 2003 Nanotechnology 3 357
[2] orre ope - ia and i e 1998 Appl. Phys. Lett. 73 3766 [3] orre pe - a e o and i e 1999 J. Appl. Phys. 85 6208
[4] Torres L, Lopez-Diaz L, Alejos O and Iñiguez J 2000 Phys. B Condens. Matter. 275 59 [5] Adeyeye A O, Bland J A C and Daboo C 1997 Appl. Phys. Lett. 70 3164
[6] García-Sánchez F, Paz E, Pigazo F, Chubykalo-Fesenko O, Palomares F J, González J M, Cebollada F, Bartolomé J and García L M 2008 Eur. Phys. Lett. 84 67002
[7] Jalil A B A, Phoa S L A, Tan S L and Adeyeye A O 2002 IEEE Trans. Magn. 38 2556
[8] Ruiz-Feal I, Lopez-Diaz L, Hirohata A, Rothman J, Guertler C M, Bland J A C, Garcia L M, Torres J M, Bartolome J, Bartolome F, Natali M, Decanini D and Chen Y 2002 J. Magn. Magn. Mater. 242-245 597
[9] Jalil M B A 2003 J. Appl. Phys. 93 7053
[10] Heyderman L J, Nolting F, Backes D, Czekaj S, Lopez-Diaz L, Kläui M, Rüdiger U, Vaz C A F, Bland, J A C, Matelon R J, Volkmann U G and Fischer P 2006 Phys. Rev. B 73 214429
[11] Vázquez M, Pirota K R, Navas D, Asenjo A, Hernández-Vélez M, Prieto P and Sanz J M 2008 J. Magn. Magn. Mater. 320 1978
[12] an de ie e an in an teen i te otta cio pr and e tter 2012 J. Appl. Phys. 111 053915
[13] Castán-Guerrero C, Sesé J, Bartolomé J, Bartolomé F, Herrero-Albillos J, Kronast F, Strichovanec P, Merazzo K J, Vázquez M, Vavassori P and García L M 2012 J. Nanosci. Nanotechnol. 12 7437 [14] Gawroń i P era o K Ch by a o-Fesenko O, Asenjo A, Del Real R P and Vázquez M 2012
Eur. Phys. Lett. 100 17007
[15] Pa Cebo ada Pa omare Gon e , Im M -Y and Fischer P 2012 J. Appl. Phys. 111 073908
[16] Castán-Guerrero C, Herrero-Albillos J, Bartolomé J, Bartolomé F, Rodríguez L A, Magén C, Kronast F, Gawronski P, Chubykalo-Fesenko O, Strichovanec P, Sesé J and García L M 2014 Phys. Rev. B 89 144405
[17] Ca ta o , Nielsch K, Ross C A, Robinson J W A and Krishnan R 2004 Appl. Phys. Lett. 85 2872
[18] Wang C C, Adeyeye A O and Lin C C 2004 J. Magn. Magn. Mater. 272-276 E1299 [19] Wang C C, Adeyeye A O and Singh N 2006 Nanotechnology 17 1629
[20] Tiberto P oarino Ce e ato Co on , De Leo N, Vinai F and Allia P 2010 J. Appl. Phys. 107 09B502
[21] Hu X K, Sievers S, Müller A, Janke V and Schumacher H W 2011 Phys. Rev. B 84 024404 [22] Cowburn R P, Adeyeye A O and Bland J A C 1997 Appl. Phys. Lett. 70 2309
[23] Torres L, Lopez-Diaz L and Alejos O 2000 J. Appl. Phys. 87 5645
[24] Kruglyak V V, Demokritov S O and Grundler D 2010 J. Phys. D: Appl. Phys. 43 264001 [25] Lenk B, Ulrichs H, Garbs F and Münzenberg M 2011 Phys. Rep. 507 107
[26] Haering F, Wiedwald U, Häberle T, Han L, Plettl A, Koslowski B and Ziemann P 2013 Nanotechnology 24 055305
[27] Toporov A Y, Langford R M and Petford-Long A K 2000 Appl. Phys. Lett. 77 3063
[28] Zhu Y 2005 Modern Techniques for Characterizing Magnetic Materials ed Y Zhu (New York: Springer) pp 267-326
[29] Tanji T 2005 Handbook of Microscopy for Nanotechnology ed N Yao and Z L Wang (Boston, MA: Kluwer Academic Publishers) p 683-715
[30] Owen N and Petford-Long A 2002 IEEE Trans. Magn. 38 2553
[31] en otti eyderman o tin Crai Chapman ope - ia ate on o mann G K i di er , Vaz C A F and Bland J A C 2008 J. Appl. Phys. 103 07D509 [32] Völkl E, Allard L F and Joy D C 1999 Introduction to Electron Holography vol 480, ed N Yao and
Z L Wang (Boston, MA: Springer)
[33] Volkov V V and Zhu Y 2004 Ultramicroscopy 98 271
[34] Zweck J and Uhlig T 2007 Handbook of Magnetism and Advanced Magnetic Materials ed H Kronmüller and S Parkin (Chichester: John Wiley & Sons, Ltd) p 1–35
[36] De Graef M 2009 ESOMAT 2009: 8th Eur. Symp. on Martensitic Transformations (Prague) ed P Sittner et al (Paris: EDP Sciences) 01002
[37] Ramberg E G 1949 J. Appl. Phys. 20 441
[38] De Graef M and Zhu Y 2001 J. Appl. Phys. 89 7177 [39] Oepen H P 1991 J. Magn. Magn. Mater. 93 116 [40] Berger A and Oepen H 1992 Phys. Rev. B 45 12596
[41] Li S, Samad A, Lew W, Xu Y and Bland J 2000 Phys. Rev. B 61 6871 [42] Heyderman L J, Nolting F and Quitmann C 2003 Appl. Phys. Lett. 83 1797
[43] Lopez-Diaz L, Aurelio D, Torres L, Martinez E, Hernandez-Lopez M A, Gomez J, Alejos O, Carpentieri M, Finocchio G and Consolo G 2012 J. Phys. D. Appl. Phys. 45 323001
[44] Donahue M J and Porter D G 2014 The Object Orientated MicroMagnetic Framework (OOMMF) project at ITL/NIST available at http://math.nist.gov/oommf/
[44] Rodríguez L A, Magén C, Snoeck E, Gatel C, Marín L, Serrano-Ramón L, Prieto J L, Muñoz M, Algarabel P A, Morellon L, De Teresa J M and Ibarra M R 2013 Ultramicroscopy 134 144 [45] McVitie S and Cushley M 2006 Ultramicroscopy 106 423
Table 1. Center-to-center distances for the antidot arrays measured along x (px) and y (py) direction. Array px [nm] ( 1nm) py [nm] ( 1nm) Array px [nm] ( 1nm) py [nm] ( 1nm) I 524 534 V 116 118 II 327 334 VI 95 97 III 160 162 VII 85 86 IV 138 141
Figure 1. (a) Low magnification TEM image of the cobalt antidot array with px = 160 nm. (b) and (c) High magnification TEM image of the antidot array with px = 116 nm and px = 85 nm, respectively. Four regions, numbered with Roman numberals, are identified inside the arrays.
Figure 2. Electron holography experiments in antidot arrays with (a), (c), (e), p = 160 and (b), (d) and (e) p = 95 nm, respectively. Panels (a) and (c) display the electrostatic phase shift image proportional to the integrated mean inner potential, whereas panels (b) and (d) exhibit the magnetic flux lines as the cosine of the magnetic phase shift image. The effect of Ga irradiation is illustrated in (e), where a line profile of the electrostatic phase shift along the arrows plotted in (a) and (c) shows the comparative effect of Ga irradiation on the areas between the antidots for p = 160 nm and p = 950 nm with respect to the continuous film.
Figure 3. In-focus LM images of antidot arrays with different periodicities: (a) 524 nm, (b) 327 nm, (c) 160 nm, and (d) 116 nm. Panels (e)(h) show their corresponding over-focus LM images, whereas (i) and (j) are further magnetization of small regions of the defocused LM images for px = 327 and 160 nm, respectively.
Figure 4. Focal series LM images of the cobalt antidot array with p = 160 nm: (a) in-focus, (b) over-focus, and (c) under-focus condition. (d) Schematic illustration of the method used to improve the visualization of the magnetic contrast. (e)(g) Filtered focal series of LM images extracted from (a)(c), respectively. The yellow dashed lines delimit the region, displayed in figure 7, used to perform TIE-reconstruction procedures.
Figure 5. (a)(c) Raw and (d)(f) filtered defocused LM images of antidot arrays with (a), (d) p = 138 nm, (b), (e) p = 116 and (c), (f) p = 95 nm array periodicity.
Figure 6. (a) Color map of the remanent magnetic state of the antidot array with p = 524 nm obtained by TIE reconstruction. (b) Vector-color map of the magnetization for the small region of (a) delimited by the yellow dashed square. The arrows and colors indicate the magnetization direction. A magnetization color scale is shown between the two maps. For the sake of clarity, the array of antidots (white circles) has been superimposed with the reconstruction.
Figure 7. Color maps of the remanent magnetization sate of a region of the antidot array with p = 160 nm obtained by TIE reconstruction using (a) raw and (b) filtered focal series LM images. The white arrows indicate the estimated direction of the magnetization for each magnetic domain. (c) Color map of the simulated remanent state of the same structure. The dashed rectangles delimit the regions where vector-color maps have been reconstructed and shown in figure 8. A magnetization color scale is shown on the right side of (c). For the sake of clarity, the array of antidots (white circles) has been superimposed with the reconstruction.
Figure 8. Vector-color maps of the region delimited in figure 7 for the (a) experimental and (b) simulated remanent magnetic state. A magnetization color scale is shown in (b). (c) Schematic illustration of the remanent spin configuration across a magnetic chain. The white arrows indicate the direction of the magnetic induction, whereas the red arrows represent the orientation of the Lorentz force. For the sake of clarity, the array of antidots (white circles) has been superimposed with the reconstruction.
Figure 9. Filtered LM images obtained at different stages of the hysteresis loop upon application of transversal magnetic fields, along the magnetization EA, for the antidot array with p = 160 nm. The yellow arrow indicates the orientation of the in-plane magnetic field.
Figure 10. Filtered LM (left) and micromagnetic simulation (right) images summarizing the relevant stages of the magnetization reversal mechanism along the HA direction of the antidot array with p = 160 nm. The yellow arrow indicates the direction of the in-plane magnetic field. The numbers label each stage of the magnetization switching to compare them with the hysteresis loop plotted below in figure 11. Bx and By are the x and y components of the magnetic induction. The black dashed rectangle in the Bx component at stage 1 delimits the region used to compose the vector-color maps in figure 11.
Figure 11. (a) Simulated vector-color maps different stages of the magnetization reversal process by application of magnetic fields in the HA direction. They have been extracted from the area enclosed by the dashed rectangle in figure 10. The black arrows represent the local magnetization orientation. The white and red dashed rectangles indicate the formation of horizontal and vertical SDWs (HSDW and VSDW), respectively. (b) Hysteresis loop calculated
from the simulations. (b) EA (gray dots) and HA (blue dots) hysteresis loops calculated from the simulations.