HAL Id: hal-01731399
https://hal.archives-ouvertes.fr/hal-01731399
Submitted on 14 Mar 2018
HAL is a multi-disciplinary open access
archive for the deposit and dissemination of sci-entific research documents, whether they are pub-lished or not. The documents may come from teaching and research institutions in France or abroad, or from public or private research centers.
L’archive ouverte pluridisciplinaire HAL, est destinée au dépôt et à la diffusion de documents scientifiques de niveau recherche, publiés ou non, émanant des établissements d’enseignement et de recherche français ou étrangers, des laboratoires publics ou privés.
To cite this version:
M. Honari, A. Ashrafzadeh, M. Khaledian, M. Vazifedoust, J.C. Mailhol. Comparison of HYDRUS-3D soil moisture simulations of subsurface drip irrigation with experimental observations in the South of France. Journal of Irrigation and Drainage Engineering, American Society of Civil Engineers, 2017, 143 (7), 8 p. �10.1061/(ASCE)IR.1943-4774.0001188�. �hal-01731399�
Comparison of HYDRUS-3D soil moisture simulations of subsurface drip
irrigation with experimental observations in the South of France
M. Honari1, A. Ashrafzadeh2, M. Khaledian3,*, M. Vazifedoust4, J.C. Mailhol5
1
Water Engineering Department, University of Guilan, Rasht, Iran
2
Water Engineering Department, University of Guilan, Rasht, Iran
3
Water Engineering Department, University of Guilan, Rasht, Iran and National Research Institute of Science and Technology for Environment and Agriculture, Irstea, BP 5095–34196
Montpellier, Cedex 05, France
4
Water Engineering Department, University of Guilan, Rasht, Iran
5
National Research Institute of Science and Technology for Environment and Agriculture, Irstea, BP 5095–34196 Montpellier, Cedex 05, France
Corresponding author email: khaledian@guilan.ac.ir
Abstract
The purpose of the present research, was evaluating the performance of HYDRUS-3D model for simulating soil moisture under field conditions for corn and durum wheat in a Mediterranean climate. Furthermore, the PILOTE model was also used for accounting root water extraction. Soil moisture at different depths was measured by a neutron probe before irrigation. Observed soil moisture values were compared with simulated data using statistical indices i.e. the root mean square error (RMSE) and the normalized root mean square error (NRMSE). The ranges of water content NRMSE were between 6.3-7.5 percent. The performance of the model based on calculated NRMSE values have been placed in the excellent category for simulation of the soil
water content. Ranges of RMSE were obtained between 0.0174 and 0.0190 cm3 cm-3, though the
values are very low. The results of these two statistical indices indicated the high ability of the model in simulating soil water content.
Keywords: Corn, Durum wheat, Montpellier, Tape drip irrigation. Introduction
Nowadays, because of the population growth, the increasing demands, technological and agricultural development, water requirement has been increased, while the resources are becoming less and less and providing water supplies are getting harder and harder. In near future, due to the problem of physical resources deficiency in the agricultural section (the largest user of water), the social and the economic dimensions in agricultural and rural communities may encounter special bottlenecks (Pazira, 2012). On those areas with few water resources accessing to water is hard, therefore, in these areas increasing water productivity has been considered as an appropriate management via pressurized irrigation systems. Drip irrigation is often preferred over other irrigation methods because of the high water-application efficiency on account of the reduced losses, the surface evaporation and the deep percolation (Rajput and Neelam, 2006). The
water and nutrients should be distributed in the active root zone throughout the farm, in an even manner, besides, the design and the management of the drip irrigation systems require an understanding of water and solute distribution patterns (Cote et al., 2003). Field tests are useful for determining proper management of irrigation, but due to the executive limitations of the field experiments such as high cost and being time-consuming, the use of simulation models of water movement in the soil is recommended. Moreover it leads to saving the costs and the time. The performance of the model should be assessed at different conditions and if the model performance is going to be confirmed, it can be used for designing and managing the irrigation system. Several empirical, analytical and numerical models such as empirical Kandelous model (Kandelous et al., 2008) and analytical Sepaskhah and Chitsaz model (Sepaskhah and Chitsaz, 2004) that can be used for this purpose were introduced (Subbaiah, 2011), but the numerical HYDRUS model (Simunek et al. 1999) is one of the most user-friendly models that can be used in the MS Windows environment. It is a software package for simulating water, heat, and solute movement in 1, 2/3-dimensional in a variably-saturated media. Much progress has been observed in understanding and mathematical description of the water flow in the unsaturated zone (Kandelous and Simunek, 2010a; Skaggs et al., 2004). Simunek et al (2016) described the recent development and the application of the HYDRUS program. The HYDRUS-3D is a well known mechanistic model for modeling variably saturated water movement and root water uptake in soils based on finite element numerical solution of flow equation (Phogat et al., 2013b). Siyal and Skaggs (2009), Liga and Slack (2004), Cote et al. (2003) and Kandalous and Simunek (2010b) verified the performance of the HYDRUS model in simulating wetting front under surface and subsurface drip irrigation. Kandelous and Simunek (2010a) simulated the transport and the distribution of heat, solutes and moisture around the emitter in a clay loam soil by HYDRUS model. The results of the modeling were compared with laboratory and field observations and have been found in good agreement between the observed and the simulated data. Since many investigations have done about the performance of HYDRUS code in simulating water movement and moisture distribution in the soil under surface and subsurface irrigation, there is a little available information at hand about modeling a real field under subsurface drip irrigation.
One of the input parameters of this model is saturated hydraulic conductivity (Ks). The soil samples transferred to the laboratory may not be accurate enough to represent the field conditions; therefore, the field measurement of the hydraulic conductivity is more beneficial than the laboratory methods. One of the methods of the field measurement which could be applied to measure saturated hydraulic conductivity is Beerkan method (Haverkamp et al., 1996) that has been previously applied by researchers such as Khaledian et al. (2012).
Better performance of tape rather than drip line has been confirmed because of creating accrete and tunnel-shape wetting front (Roberts et al. 2008), but few studies have investigated the simulation of the wetting front under tape irrigation in the field conditions. Due to the inherent complexities of heterogeneous soils in the field conditions, most studies have been done on the laboratory scale and on steady conditions; therefore, the specific objective of this study was to evaluate the performance of the HYDRUS-3D code to simulate the soil water content in wetting bulb in a field of maize and durum wheat irrigated with subsurface tape irrigation. This study was designed to find if HYDRUS-3D model would be a pertinent tool for irrigation management or system design in subsurface drip irrigation system.
Materials and methods
An experimental study under subsurface drip irrigation condition has been carried out at Lavalette experimental station of the Irstea Institute (43° 40’ N, 3° 50’ E, altitude 30 m) in
Montpellier in the SE of France. The average annual rainfall is 780 mm year-1 (a 19-year
average, 1991-2009). Evapotranspiration calculated by Penman equation exceeds the rainfall
throughout the year under this Mediterranean climate (870 mm year-1). The climate data has been
recorded at a weather station located at Lavalette.
The soil texture could be classified as loam according to the soil Survey Staff of the United States Department of Agriculture (USDA). The soil is an Inceptisols related to USDA soil taxonomy. The values of some of the physical and the chemical properties of the soil are given in Table 1. The soil has three layers according to several soil profiles, where their hydraulic properties were determined via in-situ infiltration tests. Plough, disc harrow, harrow, and seeder were used with about 4 m working width.
Table 1. Some soil physical and chemical properties at the Lavalette Agricultural Research Station, Montpellier, France.
Soil properties unit value
Clay % 18
Silt % 47
Sand % 35
Bulk density Mg m-3 1.57
Texture (USDA) 0-1.2 m loam
Field capacity % 30
Organic matter % 1.55
Organic carbon % 0.91
N total % 0.07
C/N - 12.3
Besides texture, other soil properties presented here are for 0-30 cm. USDA, US Department of Agriculture.
A corn crop and a durum wheat crop were sown in 2009 and 2010, respectively. The irrigation depths and the nitrogen application amounts are presented in Table 2. According to soil N content in the beginning of crop season (1.2 and 1.5 m for corn and durum wheat, respectively), N application was determined to satisfy plant requirement. The irrigation water was applied according to soil water content which was monitored with a neutron probe to avoid plant drought stress. Pioneer PR35Y65 variety of corn and Dakter variety of durum wheat were sown during the experiment. For corn, sowing and harvesting dates were 20-25 April and 20-25 September 2009, respectively. For durum wheat, planting and harvesting dates were 8 November 2009 and
30 June 2010, respectively. Plant densities for corn and durum wheat were 10 and 400 plants m-2,
respectively. Durum wheat and corn were hand harvested after grain filling for determination of yield and yield components. Grain yields were calculated after grain drying and threshing.
Table 2. Irrigation depth and N application during 2009 season for corn and 2010 season for durum wheat.
Crop seasons Crop Irrigation (mm) N application (kg N ha-1)
2009 Corn (1.2 m) 188 136
2009 Corn (1.6 m) 236 162
2010 Durum wheat 30 140
For corn, rows spacing were 0.6 and 0.8 m (usual row spacing in the region). For every two rows, one row of irrigation tape was installed in 0.35 m deep (to be beneath the soil tillage layer), so the distances between the laterals were 1.2 and 1.6 m, respectively. Emitter spacing on the
tape was of 0.3 m, the flow rates of tape was of 2.98 l hr-1m-1. The drip tape was 16 mm (Jain
Irrigation Systems Inc.), which has a wall thickness of 0.8 mm (mention of trade name and product details are just for the readers’ information). During irrigation a water flow meter measured water consumption in each irrigation event.
The first irrigation was applied on June 19 for a period of approximately 7.5 hour, when maize was at the 12-leaf stage of crop development, about two months after sowing. Irrigation was applied on Monday, Wednesday and Friday for 3 hours. For corn soil, the water contents were
measured at every 0.1 m of 0-1.5 m of soil depth before irrigation on June, the 18th, 2009 as 3,
16, 21 and on July the 30th and 4, 18 and on 25th of August for 1.2 m laterals spacing and on the
same dates for 1.6 m except of 6 June. In 2010 the same measurements were done for durum
wheat on the 31st of March, 6, 14, 21 and the 30th of April and 5, 11, 18 and the 26th of May just
for 1.2 m laterals spacing. The measurements were done by a neutron probe (Troxler 503 DR) which its access tube was placed on the row of the plant and between two plants. A neutron probe can measure through a spherical soil volume with a radius between 0.2 and 0.4 m, depending on the soil water content, i.e. 0.2 and 0.4 m for wet and dry soils, respectively.
Simulated profiles consist of a row of irrigation tape and two rows of plants, as shown in Figure 1. The horizontal dimension of the flow domain was considered 1.2 and 1.6 m, equal to the two lateral spacing and vertical dimension was assumed 1.5 m, which included the depth of soil which was measured by a neutron probe. It was assumed that lateral water flow along the boundaries is zero (zero flux boundary condition) and bottom boundary is defined as free drainage boundary.
Figure 1: A schematic of flow domain and boundary conditions used in the HYDRUS-3D simulation
The root water uptake and actual transpiration were assumed to be equal on a daily basis because most of the root water uptake is consumed by crop transpiration. Crop evapotranspiration which is necessary in HYDRUS-3D was estimated by PILOTE model. PILOTE (Khaledian et al. 2009) is an empirical model that can simulate crop yield and water balance using some input data as the plants, the soil, the irrigation scheduling and the weather data. At first, this model was developed for simulating the evapotranspiration and crop yields for sorghum and sunflower under the assumption of just water as a growth limiting factor (Mailhol et al. 1997). This model was calibrated and validated in the same field for corn and durum wheat (Khaledian et al. 2009; Khaledian et al. 2013).
During irrigation, the drip line boundary in each point has a constant water flux, q. This flux was calculated based on dividing the water application rate (Q) on the modeled drip tape surface area (A), the radius of tape during the irrigation was measured 1 cm:
The root system was well established in April and at the first half of July, it reached its greatest extent. Before irrigation, the root system developed naturally and it is assumed that it is symmetric under the stem of plant.
)
1
)(
01
.
0
(
2
1
.
3
3
10
98
.
2
´
-´
= =p
m
h
A
Q
q
(1)Water infiltration and redistribution were simulated using HYDRUS-3D (Simunek et al., 2006). Assuming a homogeneous and isotropic soil, the governing equation for water movement is the 3D Richards’ equation. Galerkin finite-element method is used by HYDRUS-3D to solve Richards’ equation (Simunek et al., 2006). Just the right side of the presumed symmetric profile was simulated by the model. HYDRUS model needs the soil hydraulic parameters i.e. ѳs, ѳr, Ks, n, α, and l as well as the initial soil water content.
The water extraction is not uniform over the rooting depth of the crop, with the majority of the water being extracted from the top 50% of the root zone (Warrick, 2001), the pattern of water extraction from the root zone was assumed that the upper quarter of deep of root zone extracted 40 percent of water requirement and it reduced to 30, 20 and 10 percent, respectively. Deep and loamy soil includes three layers that their hydraulic properties are being presented in Table 3. The soil hydraulic of the first layer was determined by Mubarak et al. (2009) using the Beerkan infiltration method and its algorithm i.e. BEST (Lassabatere et al., 2006) and the second and the third layers were characterized by a double ring test (Muller, 2001). For the first soil layer, soil hydraulic properties were determined for three consequent periods during crop season. For modeling the soil hydraulic properties HYDRUS-3D code uses either the van Genuchten/Mualem or the Brooks and Corey equations. In the present study, they were
determined by the van Genuchten equation for both q(h) and K(q) with Mualem condition
(Mualem, 1976).
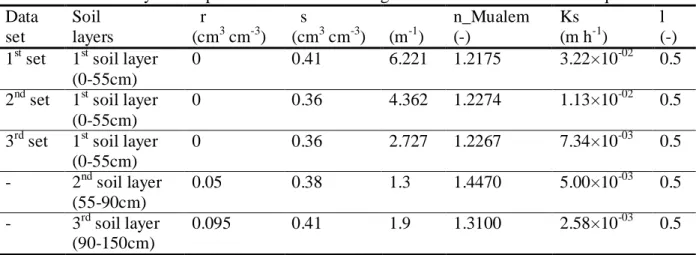
Table 3. Soil hydraulic parameters obtained using the van Genuchten/Mualem equation Data set Soil layers θr (cm3 cm-3) θs (cm3 cm-3) α (m-1) n_Mualem (-) Ks (m h-1) l (-) 1st set 1st soil layer
(0-55cm)
0 0.41 6.221 1.2175 3.22×10-02 0.5
2nd set 1st soil layer (0-55cm)
0 0.36 4.362 1.2274 1.13×10-02 0.5
3rd set 1st soil layer (0-55cm) 0 0.36 2.727 1.2267 7.34×10-03 0.5 - 2nd soil layer (55-90cm) 0.05 0.38 1.3 1.4470 5.00×10-03 0.5 - 3rd soil layer (90-150cm) 0.095 0.41 1.9 1.3100 2.58×10-03 0.5
qr and qs: residual and saturated volumetric water contents respectively. α: alpha parameter of van Genuchten equation.
n_Mualem: shape parameter of q(h) for the van Genuchten equation with Mualem condition. Ks: saturated hydraulic conductivity.
l: shape parameter of K(θ) for the van Genuchten/Mualem equation.
1st set: topsoil hydraulic parameters as determined two weeks before irrigation started.
2nd set: topsoil hydraulic parameters as determined one week after irrigation started.
3rd set: topsoil hydraulic parameters as determined three weeks after irrigation started.
To evaluate the performance of the model, the measured data by a neutron probe were compared with simulated results in days that the water contents were measured according to two statistical
indices, i.e. the root mean square error (RMSE) and the normalized root mean square error (NRMSE). The indices were calculated according to equations 2 and 3.
2 1
(
)
n i i iP
O
RMSE
n
=-=
å
(2)100
RMSE
NRMSE
O
=
´
(3), where Pi and Oi are the model calculated and observed values, respectively, n is the number of samples, and is the mean of the observed data. These statistical indices were calculated on unsorted data, the observed and the predicted values were being compared directly. RMSE should be as close as possible to zero. The simulation is considered excellent with NRMSE less than 10%, as good if NRMSE is greater than 10 and less than 20%, fair if NRMSE is greater than 20 and less than 30%, and poor if NRMSE is greater than 30% (Bannayan and Hoogenboom 2009).
Results and discussion
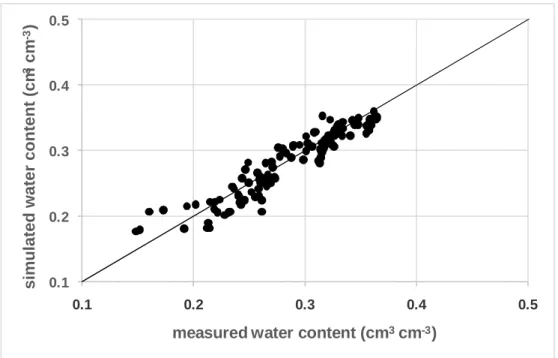
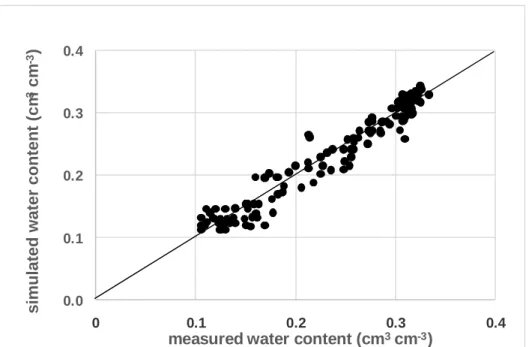
The comparisons of simulated and measured soil moisture values during crop season as well as using 1:1 line are shown in Figure 2 and 3, respectively for corn with 1.2 m lateral spacing in 2009. The model represented the simulated soil water content very well in the soil profile. The distribution of points around the 1:1 line is even and there is not any considerable over/under estimations. So it can be said that the model simulated satisfactorily the soil moisture under corn with 1.2 m lateral spacing. For 1.6 m lateral spacing, the findings go with 1.2 m lateral spacing results (Figure 4 and 5).
0 10 20 30 40 50 60 70 80 90 100 110 120 130 140 150 0.1 0.15 0.2 0.25 0.3 0.35 0.4 Depth (cm) Water content (cm3cm-3) 18 June 0 10 20 30 40 50 60 70 80 90 100 110 120 130 140 150 0.1 0.15 0.2 0.25 0.3 0.35 0.4 Depth (cm ) Water content (cm3cm-3) 3 July 0 10 20 30 40 50 60 70 80 90 100 110 120 130 140 150 0.1 0.15 0.2 0.25 0.3 0.35 0.4 Water content (cm3cm-3) 16 July Depth (cm) 0 10 20 30 40 50 60 70 80 90 100 110 120 130 140 150 0.1 0.15 0.2 0.25 0.3 0.35 0.4 Depth (cm) Water content (cm3cm-3) 21 July 0 10 20 30 40 50 60 70 80 90 100 110 120 130 140 150 0.1 0.15 0.2 0.25 0.3 0.35 0.4 Depth (cm) Water content (cm3cm-3) 30 July 0 10 20 30 40 50 60 70 80 90 100 110 120 130 140 150 0.1 0.15 0.2 0.25 0.3 0.35 0.4 Depth (cm ) Water content (cm3 cm-3) 4 August 0 10 20 30 40 50 60 70 80 90 100 110 120 130 140 150 0.1 0.15 0.2 0.25 0.3 0.35 0.4 Depth (cm) Water content (cm3cm-3) 18 August 0 10 20 30 40 50 60 70 80 90 100 110 120 130 140 150 0.1 0.15 0.2 0.25 0.3 0.35 0.4 Depth (cm ) Water content (cm3cm-3) 25 August
0.1 0.2 0.3 0.4 0.5 0.1 0.2 0.3 0.4 0.5
simulated water content (cm
3cm -3)
measured water content (cm3cm-3)
Figure 3: Comparing the simulated and measured soil moisture under corn with 1.2 m lateral spacing in 2009
The results of the present study accord with those from Kandelous and Simunek (2010a), however they used the HYDRUS-2D model for simulating soil moisture under laboratory and field conditions but without root extraction and for a very short time period. Phogat et al (2013a) used HYDRUS-3D model to simulate soil water content in the soil under an orange tree planted in a field lysimeter. The simulated data matched statistically well with the measured data. Xi et al (2016) evaluated HYDRUS-3D model under subsurface drip irrigation conditions for a mature triploid Populus tomentosa using field data. The average soil water content which was simulated with HYDRUS-3D model agreed well with the measured values. In this study, the model was evaluated in more real conditions and for a complete irrigation season. Low soil moistures were slightly overestimated, which are commonly related to the surface soil being under the influence of different activity such as organic matter decomposition, crust and cracks, etc. and almost all models simulate soil moisture with a little discrepancies for this layer (Khaledian et al., 2009). One possible conclusion is that the input data for HYDRUS model were supplied satisfactorily; because the simulation accuracy of sophisticated models such as HYDRUS depends on the accuracy of input data e.g. soil hydraulic parameters, plant root uptake, etc.
This study takes a step in the direction of introducing proper irrigation management tools to prevent water loss. In addition, it is important to emphasize that the methodological problem in this research limits solute and heat transfers modules evaluations as well as different irrigation levels application.
0 10 20 30 40 50 60 70 80 90 100 110 120 130 140 150 0.1 0.15 0.2 0.25 0.3 0.35 0.4 Depth (cm) Water content (cm3cm-3) 18 June 0 10 20 30 40 50 60 70 80 90 100 110 120 130 140 150 0.1 0.15 0.2 0.25 0.3 0.35 0.4 Depth (cm ) Water content (cm3cm-3) 3 July 0 10 20 30 40 50 60 70 80 90 100 110 120 130 140 150 0.1 0.15 0.2 0.25 0.3 0.35 0.4 Water content (cm3cm-3) 16 July Depth (cm) 0 10 20 30 40 50 60 70 80 90 100 110 120 130 140 150 0.1 0.15 0.2 0.25 0.3 0.35 0.4 Depth (cm) Water content (cm3cm-3) 21 July 0 10 20 30 40 50 60 70 80 90 100 110 120 130 140 150 0.1 0.15 0.2 0.25 0.3 0.35 0.4 Depth (cm) Water content (cm3cm-3) 30 July 0 10 20 30 40 50 60 70 80 90 100 110 120 130 140 150 0.1 0.15 0.2 0.25 0.3 0.35 0.4 Depth (cm ) Water content (cm3 cm-3) 4 August 0 10 20 30 40 50 60 70 80 90 100 110 120 130 140 150 0.1 0.15 0.2 0.25 0.3 0.35 0.4 Depth (cm) Water content (cm3cm-3) 18 August 0 10 20 30 40 50 60 70 80 90 100 110 120 130 140 150 0.1 0.15 0.2 0.25 0.3 0.35 0.4 Depth (cm ) Water content (cm3cm-3) 25 August
Figure 4: Comparing the simulated and measured soil water content under corn with 1.6 m lateral spacing in 2009
0.0 0.1 0.2 0.3 0.4 0 0.1 0.2 0.3 0.4
simulated water content (cm
3cm -3)
measured water content (cm3cm-3)
Figure 5: Comparing the simulated and measured soil moisture under corn with 1.6 m lateral spacing in 2009
Simulated and measured soil water contents in different dates during the crop season were compared in the soil profile (Figure 6). The results showed any considerable discrepancies between the measured and simulated results. Using 1:1 line, the comparisons of simulated and measured soil moisture values were done as shown in Figure 7, for durum wheat with 1.2 m lateral spacing in 2010 crop season. As it can be seen, the model simulated satisfactorily with the soil water content in the active root zone.
The RMSE values for the simulated and observed soil moisture provide a quantitative measure of the goodness of the fit between the measured and the simulated soil moisture. The RMSE values
range from 0.0174 to 0.019 cm3 cm-3 being very low; furthermore NRMSEs were 7.5% in
maximum, showing an excellent simulation according to Bannayan and Hoogenboom (2009) classification. Generally, the accuracy of the HYDRUS-3D simulations has been judged to be excellent and to be accurate enough to justify the use of HYDRUS-3D as an irrigation management tool.
Certainly the accuracy of a simulation with a robust model such as HYDRUS depends on the quality of the hydraulic parameter estimations (Skaggs et al., 2004). Beerkan method (Haverkamp et al., 1996) and its algorithm, BEST (Lassabatere et al., 2006) as well as dividing the crop season in the three periods to take into account the temporal variations of the first soil layer hydraulic parameters were helpful and considering permanent soil hydraulic parameters for deeper layer during the season was relevant. PILOTE model coupling with HYDRUS-3D was successful too, because during the crop season, irrigations and crop evapotranspiration were the main factors in the water balance regarding the fact that the drainage was negligible thanks to the relevant monitoring of soil moisture and soil tension in the root zone during the crop season.
0 10 20 30 40 50 60 70 80 90 100 110 120 130 140 150 0.1 0.15 0.2 0.25 0.3 0.35 0.4 Depth (cm) Water content (cm3cm-3) 31 March 0 10 20 30 40 50 60 70 80 90 100 110 120 130 140 150 0.1 0.15 0.2 0.25 0.3 0.35 0.4 Depth (cm) Water content (cm3cm-3) 6 April 0 10 20 30 40 50 60 70 80 90 100 110 120 130 140 150 0.1 0.15 0.2 0.25 0.3 0.35 0.4 Depth (cm ) Water content (cm3 cm-3) 14 April 0 10 20 30 40 50 60 70 80 90 100 110 120 130 140 150 0.1 0.15 0.2 0.25 0.3 0.35 0.4 Depth (cm ) Water content (cm3 cm-3) 21 April 0 10 20 30 40 50 60 70 80 90 100 110 120 130 140 150 0.1 0.15 0.2 0.25 0.3 0.35 0.4 Depth (cm ) Water content (cm3cm-3) 30 April 0 10 20 30 40 50 60 70 80 90 100 110 120 130 140 150 0.1 0.15 0.2 0.25 0.3 0.35 0.4 Depth (cm ) Water content (cm3cm-3) 5 May 0 10 20 30 40 50 60 70 80 90 100 110 120 130 140 150 0.1 0.15 0.2 0.25 0.3 0.35 0.4 Depth (cm) Water content (cm3cm-3) 11 May 0 10 20 30 40 50 60 70 80 90 100 110 120 130 140 150 0.1 0.15 0.2 0.25 0.3 0.35 0.4 Depth (cm) Water content (cm3cm-3) 18 May 0 10 20 30 40 50 60 70 80 90 100 110 120 130 140 150 0.1 0.15 0.2 0.25 0.3 0.35 0.4 Depth (cm) Water content (cm3cm-3) 26 May
Figure 6: Comparing the simulated and measured soil water content under durum wheat with 1.2 m lateral spacing in 2010
0.1 0.2 0.3 0.4 0.5 0.1 0.2 0.3 0.4 0.5
simulated water content (cm
3
cm
-3)
measured water content (cm3cm-3)
Figure 7: Comparing the simulated and measured soil moisture under durum wheat with 1.2 m lateral spacing in 2010
Table 4 shows statistical indices results to be compared with the measured and the simulated water content; according to this table; NRMSE ranges of soil moisture were between 6.3 and 7.5
percent and ranges of RMSE were between 0.0174 and 0.0190 cm3 cm-3.
Kandelous and Simunek (2010a) simulated water movement in a subsurface drip irrigation system under the field and the laboratory conditions using HYDRUS-2D and had obtained the RMSE at different locations varied between 0.011 and 0.045 for volumetric water contents and had concluded that the correspondence between simulations and observations had been very good. The performance of the model based on calculated NRMSE values was placed as in the excellent category for simulation of soil water content in the present research.
Table 4: Results of RMSE and NRMSE for comparison between measured and simulated soil moisture
Crop Lateral spacing (m) RMSE (cm3 cm-3) NRMSE (%)
Corn 1.2 0.0178 6.6
Corn 1.6 0.0174 7.5
Conclusion
HYDRUS-3D model accuracy in soil moisture simulation during two crop seasons was evaluated in the field conditions under corn and durum wheat irrigated with subsurface drip irrigation in a Mediterranean climate. The soil moisture simulated with HYDRUS-3D was found to be in excellent agreement with the measured values. The results provide support for applying HYDRUS-3D as an irrigation management tool in the studied climate. The Beerkan method and the BEST algorithm as well as considering temporal variations of soil hydraulic parameters in the first soil layer (0-0.55 m) offer a relevant soil hydraulic data set that are necessary for the model predictions. In this study, evapotranspiration values were modeled using PILOTE model and its output was used as HYDRUS-3D model input. HYDRUS-3D could simulate the water intake as well by using evapotranspiration data gotten from PILOTE, and subsequently could simulate the water content as well. This study showed that HYDRUS-3D and PILOTE can be coupled satisfactorily. For further research, it has been recommended that the solution transfer module and the heat transfer module evaluations under field conditions would be investigated.
References
Bannayan, M., and Hoogenboom, G. (2009). “Using pattern recognition for estimating cultivar coefficients of a crop simulation model.” Field Crops Research, 111 (3), 290-302.
Cote, C.M., Birstow, K.L., Charlesworth, P.B., Cook, F.J., and Thorburn, P.J. (2003). “Analysis of soil wetting and solute transport in subsurface trickle irrigation.” Irrigation Science, 22, 143-156.
Haverkamp, R., Arrue, J.L., Vandervaere, J.P., Braud, I., Boulet, G., Laurent, J.P., Taha, A., Ross, P.J., and Angulo-Jaramillo, R. (1996). “Hydrological and thermal behavior of the vadose zone in the area of Barrax and Tomelloso (Spain): experimental study, analysis and modeling.” Project UE, No. EV5C-CT 92 00 90.
Kandelous, M.M., Liaghat, A., and Abbasi, F. (2008). “Estimation of soil moisture pattern in subsurface drip irrigation using dimensional analysis method.” Journal of Agriculture Science, 39(2), 371–378.
Kandelous, M.M., and Simunek, J. (2010a). “Numerical simulations of water movement in a subsurface drip irrigation system under field and laboratory conditions using HYDRUS- 2D.” Agricultural Water Management, 97, 1070-1076.
Kandelous, M. M., and Simunek, J. (2010b). “Comparison of numerical, analytical, and empirical models to estimate wetting patterns for surface and subsurface drip irrigation.” Irrigation Science, 28, 435-444.
Khaledian, M., Mailhol, J.C., Ruelle, P., and Rosique, P. (2009). “Adapting PILOTE model for water and yield management under direct seeding system: the case of corn and durum wheat in a Mediterranean context.” Agriculture Water Management, 96(5), 757-770.
Khaledian, M.R., Mailhol, J.C., and Ruelle, P. (2012). “No-tillage impacts on soil hydraulic properties as compared with conventional tillage.” Journal of Biological and Environmental Sciences, 6(18), 213-218.
Khaledian, M.R., Mailhol, J.C., Ruelle, P., and Dejean, C. (2013). “Effect of cropping strategies on the irrigation water.” Plant, Soil and Environment, 59(1), 29-36.
Lassabatere, L., Angulo-Jaramillo, R., Soria-Ugalde, J.M., Cuenca, R., Braud, I., and Haverkamp R. (2006). “Beerkan estimation of soil transfer parameters through infiltration experiments— BEST.” Soil Science Society of America Journal, 70, 521–532.
Liga, M., and Slack, D. (2004). “A design model for subsurface drip irrigation in Arizona.” Department of Agriculture Biosystem Arizona.
Mailhol, J.C., Olufayo, A.A., and Ruelle, P. (1997). “Sorghum and sunflower evapotranspiration and yield from simulated leaf area index.” Agricultural Water Management, 35, 167–182.
Mualem, Y. (1976). “A new model for predicting the hydraulic conductivity of unsaturated porous media.” Water Resources Research, 12, 513–522.
Mubarak, I., Mailhol, J.C., Angulo-Jaramillo, R., Ruelle, P., Boivin, P., and Khaledian, M. (2009). “Temporal variability in soil hydraulic properties under drip irrigation.” Geoderma, 150, 158-165.
Muller, A. (2001). “Estimation of hydraulic soil parameters of tilled soil using direct and inverse methods.” MSc thesis. Cemagref.
Pazira, A. (2012). “Conservation of physical resources for agriculture production, soil and water.” National Committee of Irrigation and Drainage. 268p. (In Persian)
Phogat, V., Skewes, M.A., Alam, J., Grigson, G. and Simunek, J. (2013a). “Evaluation of water movement and nitrate dynamics in a lysimeter planted with an orange tree”. Agricultural Water Management. 127, 74-84.
Phogat, V., Skewes, M.A., Mahadevan, M. and Cox, J.W. (2013b). “Evaluation of soil plant system response to pulsed drip irrigation of an almond tree under sustained stress conditions”. Agricultural Water Management, 118, 1–11.
Rajput, T.B.S., and Neelam, P. (2006). “Water and nitrate movement in drip-irrigation onion under fertigation and irrigation treatments. Agricultural Water Management, 79, 293-311. Roberts, T.L., White, S.A., Warrick, A.W., and Thompson, T.L. (2008). “Tape depth and germination method influence patterns of salt accumulation with subsurface drip irrigation.” Agricultural Water Management, 95, 669–677.
Sepaskhah, A.R., and Chitsaz, H. (2004). “Validating the Green-Ampt analysis of wetted radius and depth in trickle irrigation.” Biosystems Engineering, 89(2), 231-236.
Simunek, J., Sejna, M. and van Genuchten, M.Th. (1999). “The HYDRUS-2D software package for simulating the two-dimensional movement of water, heat, and multiple solutes in variably-saturated media.” IGWMC-TPS 53, Version 2.0, International Ground Water Modeling Center, Colorado School of Mines, Golden, Colo.
Simunek, J., van Genuchten, M.T. and Sejna, M. (2006). “The HYDRUS Software Package for Simulating the Two- and Three-Dimensional Movement of Water, Heat, and Multiple Solutes in Variably-Saturated Media”, Technical Manual, Version1.0. PC Progress, Prague.
Simunek, J., van Genuchten, M. and Sejna, M. (2016). “Recent developments and applications of the HYDRUS computer software packages. Vadose Zone Journal, Doi:10.2136/vzj2016.04.0033. Siyal, A.A., and Skaggs, T.H. (2009). “Measured and simulated soil wetting patterns under porous clay pipe sub-surface irrigation.” Agricultural Water Management, 96, 669–677.
Skaggs, T.H., Trout, T.J., Simunek, J., and Shouse, P.J. (2004). “Comparison of HYDRUS-2D simulations of drip irrigation with experimental observations.” Journal of Irrigation and Drainage Engineering. 130(4), 304–310.
Subbaiah, R. (2011). “A review of models for predicting soil water dynamics during trickle irrigation”. Irrigation Science, 31(3), 225–258.
Warrick, A.W. (2001). “Soil physics companion”. CRC Press.
Xi, B., Bloomberg, M., Watt, M., Wang, Y., and Jia, L. (2016). “Modeling growth response to soil water availability simulated by HYDRUS for a mature triploid Populus tomentosa plantation located on the North China Plain”. Agricultural Water Management, 176, 243–254.