HAL Id: hal-01981510
https://hal.archives-ouvertes.fr/hal-01981510
Submitted on 31 Jan 2019HAL is a multi-disciplinary open access archive for the deposit and dissemination of sci-entific research documents, whether they are pub-lished or not. The documents may come from teaching and research institutions in France or abroad, or from public or private research centers.
L’archive ouverte pluridisciplinaire HAL, est destinée au dépôt et à la diffusion de documents scientifiques de niveau recherche, publiés ou non, émanant des établissements d’enseignement et de recherche français ou étrangers, des laboratoires publics ou privés.
On the morphologies of oxides particles in optical fibers:
Effect of the drawing tension and composition
M. Vermillac, H. Fneich, J. Turlier, M. Cabié, C. Kucera, D. Borschneck, F.
Peters, P. Vennegues, T. Neisius, S. Chaussedent, et al.
To cite this version:
M. Vermillac, H. Fneich, J. Turlier, M. Cabié, C. Kucera, et al.. On the morphologies of oxides particles in optical fibers: Effect of the drawing tension and composition. Optical Materials, Elsevier, 2019, 87, pp.74-79. �10.1016/j.optmat.2018.05.067�. �hal-01981510�
On the morphologies of oxides particles in optical fibers: Effect of the drawing tension and composition
M. Vermillac1, H. Fneich1,2, J. Turlier3, M. Cabié4, C. Kucera5, D. Borschneck6, F. Peters1, P. Vennéguès7, T. Neisius4, S.
Chaussedent3, D.R. Neuville8, A. Mehdi2, J. Ballato5, W. Blanc1,*
1. Université Côte d'Azur, INPHYNI, CNRS UMR7010, Parc Valrose, 06108 Nice, France
2. Université de Montpellier, Institut Charles Gerhardt, CMOS, CC 1701 Place Eugène Bataillon, 34095 Montpellier Cedex 5, France
3. Université d'Angers, Laboratoire de Photonique d'Angers (LPhiA) — UPRES EA 4464, 2 Bd Lavoisier, 49045 Angers Cedex 01, France
4. Fédération des sciences chimiques de Marseille, Aix-Marseille Université - CP2M, Marseille cedex 20, France
5. Center for Optical Materials Science and Engineering Technologies (COMSET) and the Department of Materials Science and Engineering, Clemson University, Clemson, South Carolina 29634, USA
6. Aix-Marseille Université, CNRS, IRD, Coll. France, CEREGE, Aix-En-Provence, France
7. Centre de Recherche sur l’Hétéro-Hépitaxie et ses Applications, UPR CNRS 10, Valbonne Sophia Antipolis, France 8. Géomateriaux, CNRS-IPGP, Sorbonne Paris-Cité, 1 Rue Jussieu, 75005 Paris, France
corresponding author: Wilfried Blanc, wilfried.blanc@unice.fr, tel. +33 492076799, fax +33 492076754
Abstract
Rare-earth-doped oxide nanoparticles in the core of silica optical fibers are becoming well studied as they yield enhanced and tailorable spectroscopic and optical properties. In this paper, the evolution of particle
morphology, induced by the drawing step, is studied. Indeed, during the fiber draw process, the glass flows and particles can elongate and even break-up into smaller particles through Rayleigh-Plateau instabilities. The shape of elongated particles is related to the composition as it depends on the viscosity ratio between the particle and the matrix. Moreover, a lower drawing temperature enhances the break-up phenomenon. These observations offer new possibilities for the control of the size and the shape of particles, hence performance of active optical fibers.
Keywords
Optical fiber, particles, elongation, Rayleigh-Plateau instability, silica 1. Introduction
Glass is a material of prime importance for many applications because of its transparency, chemical durability, ease of shaping and large diversity of composition. In particular, glasses are a cornerstone in the development of photonic devices and components. The paradigmatic example is the optical fibers, which are used in a considerable number of applications ranging from telecommunications to remote sensors and from medical to materials processing and other applications. For fiber lasers and amplifiers, luminescent properties are generally obtained by doping the glass with rare-earth ions (RE) [1]. Despite a plethora of applications, the compositions of glass used to prepare optical fibers are limited and only silica (SiO2) has found a large scale
commercial interest. All other proposed glasses are limited by fabrication, reliability and scale, even though they would provide good luminescence properties to the RE dopant. Future applications require RE-doped materials that exhibit “augmented” intrinsic optical properties. That is, particular spectroscopic behavior that would not appear in a pure silica glass. In order to address these issues, one effective route is to incorporate nanoparticles into the core of the optical fiber [2,3]. These nanocomposite glasses are constituted of nanoparticles doped with RE embedded in a glassy host. Such materials are of interest as they can combine (i) mechanical, chemical and (vapor phase) manufacturing advantages of silica with (ii) tailored and enhanced spectroscopic properties of the RE ions through the control of the local composition about the RE and the structure of the nanoparticles themselves.
Several processes have been studied to reach a compromise between low light scattering and modification of the luminescence properties. Initially, fibers were heat treated to control nanoparticle nucleation/growth, by accurately tailoring the size of the resultant nanoparticles [4,5]. However, this route tends to lessen the
mechanical robustness of the optical fiber. One of the most promising alternative approaches is based on industry-accepted vapor deposition techniques [6] whereby the nanoparticles, rather than a dissolved salt solution, are solution-doped directly into the silica soot. Since these particles are already present in the preform, heat treatment of the fiber is avoided. However, thermodynamic and rheological effects are known to modify the shape and structure of the particles during fiber formation. Indeed, the Authors have recently reported the evolution of nanoparticles during the fiber draw process and showed that fiber drawing itself can induce particle elongation and break-up through rheological mechanisms, triggered by Rayleigh-Plateau capillary instabilities [7]. In this article, we discuss in more detail the parameters (composition and the drawing temperature) that allow for greater tailorability of the nanoparticle morphology in the fibers.
2. Experimental
2.1 Sample preparation
Fiber preforms, denoted La1, La2, La3, Mg1 and Mg2 as defined in Table 1, were fabricated using a conventional MCVD (Modified Chemical Vapor Deposition) process [6]. A GeO2-doped silica porous core layer (also containing
phosphorus in the specific case of sample Mg2) was immersed by the doping solution. Preform La1 was prepared by injecting 5 mL of the LaF3:Tm3+ nanoparticle doping solution into the rotating tube maintained
horizontally on the MCVD lathe. Two sets of LaF3 nanoparticles were synthesized and doped with 0.1 and 1 at %
of thulium (Tm3+). Information about the recipe can be found elsewhere [8]. These particles are 10 nm in
diameter and were dispersed in a solution of ethanol. Zeta-sizer measurements showed that the particles in solution form 200 nm clusters to few micrometers particles (up to 5-6 µm). The fluoride converts to an oxide during the high temperature lathe and fiber draw processing. For more details on nanoparticle and preform formation, see Ref. 9 and references therein. All the other preforms were doped with chlorides salts dissolved in ethanol; i.e., conventional solution doping, as a comparison. La2, La3 and Mg1 preforms were prepared using the gradual-time doping technique [10]. In this technique, two doping solutions (indicated as solutions A and B in Table 1) are used to obtain a longitudinally varying preform composition. Thanks to this technique, various concentrations of lanthanum (La) or magnesium (Mg) are obtained within the same preform. After the doping step, the porous layer was sintered at 1800°C and tube collapse into the final preform was performed at a temperature above 2200°C. The diameter of the final preform was around 10 mm. For preforms La1, La3, Mg1 and Mg2, fibers were drawn at a temperature of approximately 2000°C and draw tension varying between 0.42 and 0.44 N. Preform La3 was drawn with a tension varying between 0.3 and 2 N, i.e. a draw temperature between 1790 and 1950°C. The fibers were coated with a UV-curable polymer (Desolite 3471-3-14, DSM). The diameter of the uncoated fibers was 125 µm.
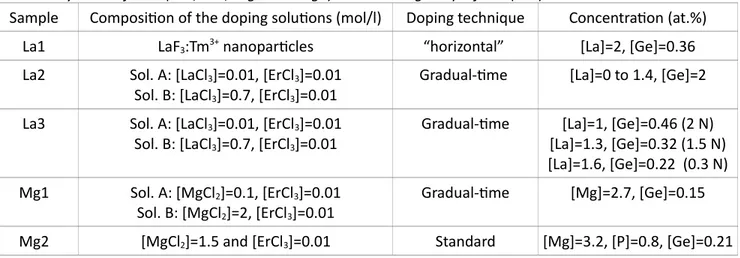
Table 1. Compositions and solution doping techniques used to prepare the preforms. Concentrations were measured by EDX in fibers (La1, La3, Mg1 and Mg2) and all along the preform (La2).
Sample Composition of the doping solutions (mol/l) Doping technique Concentration (at.%)
La1 LaF3:Tm3+ nanoparticles “horizontal” [La]=2, [Ge]=0.36
La2 Sol. A: [LaCl3]=0.01, [ErCl3]=0.01
Sol. B: [LaCl3]=0.7, [ErCl3]=0.01
Gradual-time [La]=0 to 1.4, [Ge]=2 La3 Sol. A: [LaCl3]=0.01, [ErCl3]=0.01
Sol. B: [LaCl3]=0.7, [ErCl3]=0.01
Gradual-time [La]=1, [Ge]=0.46 (2 N) [La]=1.3, [Ge]=0.32 (1.5 N) [La]=1.6, [Ge]=0.22 (0.3 N) Mg1 Sol. A: [MgCl2]=0.1, [ErCl3]=0.01
Sol. B: [MgCl2]=2, [ErCl3]=0.01
Gradual-time [Mg]=2.7, [Ge]=0.15
2.2 X-ray nanotomography
X-ray nanotomography of the optical fiber was performed using a high resolution Zeiss Xradia 3D X-ray microscope (UltraXRM-L200) equipped with a copper rotating anode source at 40 kV and 30 mA. Sample preparation consisted in carefully cutting a length of approximately 5 mm of the fiber and joining with epoxy glue to a metallic needle. The x-ray beam was focused on to the fiber using a glass capillary and the transmitted x-rays were diffracted by a Fresnel zone plate to produce a magnified image on a scintillator crystal. This crystal converts the x-rays into visible light, which traverses an 20x objective lenses that magnifies the image a second time and projects it onto a 1k x 1k CCD detector. This Fresnel zone plate allowed to visualize the fiber with a voxel size of 16.1 nm in a field of view of 16.5x16.5x16.5 µm3. Transmission x-ray radiographs were collected in
absorption contrast mode between -90° and 90° in 0.21° steps at an exposure time of 300 s per view. Random motion of the sample was corrected by placing a gold bead (0.8-1.3 µm) on the fiber and tracking it in every radiograph using Autoalign v2.4 software (Zeiss). The resulting 851 corrected radiographs were reconstructed using XMReconstructed-Parallel beam-9.0.6445 software (Zeiss) and a filter back projection algorithm was employed that led to a stack of virtual slices inside the fiber. Data treatment and image analysis were performed using Avizo v8.1 software (FEI). Particularly, a median filter was firstly applied to the data to remove noise. Then the nanoparticles, due to their high chemical contrast, could be thresholded and labeled for quantification. A filter then was applied to sort and (faux) color the nanoparticles according to their length. 2.3 Electron microscopy characterizations
All of the samples (except SEM imaging of Mg2, see following) were characterized using scanning electron microscopy (SEM) and energy-dispersive x-ray (EDX) analyses using a JEOL 7000F microscope. For SEM imaging and EDX analyses, the accelerating voltage was 20 kV. The samples were coated with carbon. La2 preform was cut at various positions all along the preform in order to study the relation between the La concentration and the particle sizes. These analyses were realized on transverse sections of the preform samples. In order to image the core along the drawing axis, the fibers (La3 and Mg1) were embedded in a polymer with a small angle (typically 3.5°) between the core axis and the horizontal plane and polished to expose the longitudinal sections. EDX measurements were performed at the center of the core. The concentrations (La or Mg), as indicated in Table 1, correspond to the highest value measured in the area imaged by SEM. SEM images were processed to conduct quantitative extraction of particle sizes. Thresholding method was cautiously chosen to take into account the contrast variations imposed by the particle sizes and composition variations.
The Mg2 fiber was prepared by focused ion beam (FIB) sectioning and imaged using SEM. The FIB-SEM experiment was carried out on the FEI Helios Nanolab 450S dual beam instrument. Milling was performed using a 30 kV Ga ion beam followed by acquisition of a SEM micrograph at 5 kV with the secondary electron in-lens detector. Due to the low chemical contrast between particles and matrix fiber this detector was preferred to the backscattered detector. White lines due to charge effects can be observed “below” the most elongated particles in the images.
3. Results
3.1. Elongated particles
One of the main reasons to use x-ray nanotomography to characterize the elongated particles in the fiber core is its ability to combine 2D or 3D visualization of the chemical contrast in a volume larger than the core size with a spatial resolution of a few tens of nanometers, commensurate with the size of the nanoparticles. An example of a 3D-reconstruction is presented in Figure 1, which corresponds to the image of the overall core of the La1 fiber over a length of 16.5 µm. The particles were colored based on their length: 0.05-0.35 µm in yellow, 0.35-10 µm in blue, and 0.35-10-16 µm in red. The blue sphere on the top of the picture corresponds to the gold bead
(see Section 2.2). The glass surrounding the particles is not displayed. It has been removed by carefully choosing the threshold parameter in the grey scale value histogram of the scanned volume. Moreover, to improve the quality of the tomography, the optical fiber was immersed in Buffered Oxide Etch (BOE) (35.06% NH4F + 6.41% HF, Sigma-Aldrich) for 11.5 hours to remove most of the silica cladding that attenuates the
incident x-ray beam and prevents imaging and quantification of the smallest particles. The final diameter of the etched fiber was 14 µm. Following this procedure, it is clearly observed that particles in the fiber center lead to thicker elongated regions while those at the core periphery are thinner and experience greater Rayleigh-Plateau instability, which leads to the break-up of the thread into smaller particles.
Figure 1: X-ray nanotomography characterization of the La1 fiber showing the distribution of the particles as a function of their length. Colors coding is explained in the text. The field of view is 16.5 µm x 16.5 µm x 16.5 µm.
The particles are aligned along the drawing axis.
Figure 2: X-ray nanotomography characterization of the La1 fiber. 9 images (16.5 µm x 16.5 µm area each) are merged. The drawing axis is parallel to the the black lines.
A representative 2D-projection mosaic is presented in Figure 2 in order to investigate the length of the elongated particles. It corresponds to a merger of 9 images (16.5 x 16.5 µm each) collected along the fiber. Actually, the characterization has been extended on 300 µm (18 pictures). The particles appear darker than the glassy matrix, indicating that they have a higher x-ray absorption coefficient. This is consistent with the SEM images. Indeed, in these images, particles are lighter than their surrounding medium, revealing their higher effective atomic number. This is explained by the higher concentration of lanthanum in the particles [9]. All along the scan, a black line crosses the 18 pictures. It shows that the length of elongated particles can be as long as 300 µm.
3.2 Influence of the composition
In order to discuss the influence of composition on the elongation and break-up of the particles during fiber drawing, conventionally solution-doped samples Mg1 and Mg2 have been characterized. Both contain
magnesium, which nucleates particles formation from the otherwise glassy core. Phosphorous is present only in Mg2. SEM images of Mg1 and Mg2 fibers are presented in Figures 3 and 4, respectively. Due to the higher effective atomic number of the nucleated particles, they look lighter (whiter in the image) than the glass matrix. In Figure 3, the black “particles” are attributed to particles which were removed during the polishing step. While the content of magnesium is almost the same in both fibers (see Table 1), the morphology of nanoparticles is different. Indeed, “dumb-bell” shaped nanoparticles (particles elongated between two rounded ends, as already reported in Ref. 7) and break-up were observed only in Mg2 fiber where, in fiber Mg1, all of the elongated particles ends with well-defined points. For the dumb-bell shaped particles, both rounded ends can be slightly different because the surface of the polished sample is not perfectly parallel to the large axis of these particles.
Figure 3: SEM image (back-scattered electrons) of the Mg1 fiber. The drawing axis is vertical.
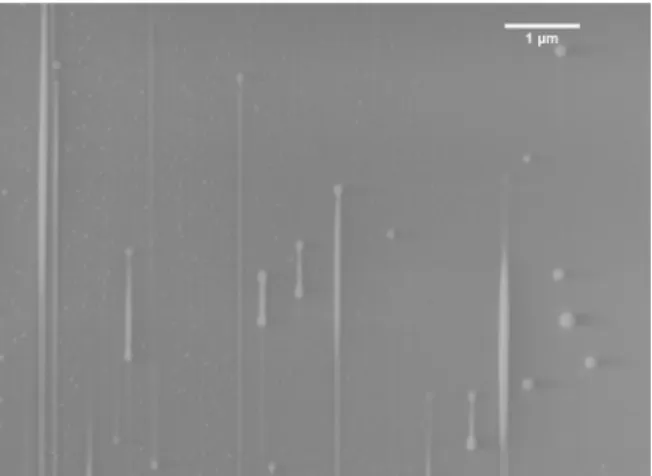
Figure 4: SEM image (secondary electrons) of the Mg2 fiber. The drawing axis is vertical. Scale bar: 1 µm. 3.3. Influence of the drawing temperature
In order to study the effect of drawing temperature, fiber La3 was drawn at three different temperatures: 1950, 1810 and 1795°C, corresponding to three drawing tensions: 0.3, 1.5 and 2 N, respectively. The SEM images are shown in Figure 5. While elongated particles are present in all images, the main difference relates to the fragmented particles. Indeed, in the 0.3, 1.5 and 2 N drawn fibers, the number of fragmentation-induced
nanoparticles was estimated to be around 110, 1200 and 2500, respectively (areas investigated were the same for all the fiber cores). The break-up phenomenon is favored by increasing the drawing tension (decreasing the drawing temperature).
Figure 5: SEM images (back-scattered electrons) of La3 fiber drawn at different drawing temperatures: 1950, 1810 and 1795°C (corresponding to different drawing tensions: 0.3, 1.5 and 2 N, respectively), from left to right.
The drawing axis is horizontal.
The size distribution of the nanoparticles produced by fragmentation were measured using SEM images of the La3 samples drawn at different drawing tensions (0.3 N, 1.5 N and 2 N). For each particle, the size was calculated based on a volume-equivalent sphere radius. Measured mean radii were 43, 40, and 40 nm with standard deviations of 11, 11 and 9 nm for the fibers drawn at 0.3, 1.5 and 2 N, respectively.
Figure 6: Size distribution of nanoparticle radii produced by fragmentation in the La3 fiber drawn at different tensions: 0.3 N (red), 1.5 N (green) and 2 N (blue).
4. Discussion
During the fiber draw step, the preform is heated to a temperature of about 2000 °C, which is well above its 1650°C softening point, such that glass flows. As a consequence, the elongation and shape of the (amorphous) particles is influenced by flow-induced deformation [11]. The morphology of the particles results from a competition between viscous stress (σ) of the host matrix that tends to elongate particles and surface tension (γ) on the particles, which tends to minimize their surface during the flow of the glass and the maintaining of a spherical shape. Effects of glass flow on the nanoparticles can be expressed using the capillary number Ca which is size-dependent [12]:
Ca=
σ×R
NPγ
(1)where RNP is the radius of the particle, γ the surface tension between the particle and the matrix. The viscous
stress (σ) is expressed as [13]:
σ=3×η×ϵ
(2)where η is the viscosity of the matrix and
˙ϵ
is its deformation rate.For a given flow, the higher the capillary number (or the larger the particles), the more they should deform. The long cylinders observed in Figures 1 and 2 are spherical particles from the preform that deforms under the viscous stresses occurring during the fiber drawing. The deformation can be quantified using the Taylor parameter D [12]:
D=
L−B
L+B
(3)where L and B are the major (larger) and minor (small) axes of the (ellipsoidal-like) elongated particle, respectively. In Figure 2, particles longer than 300 µm are observed, leading to a deformation higher than 0.99 (the radius is estimated to be about 250 nm). Considering their high elongation, break-up is not achieved due to quenching of the glass, which ceases any further deformation. The presence of long elongated particles could be of interest to promote light-guiding through the transverse Anderson localization [14,15].
For the elongated particles, which are fully included in the SEM images, dumb-bell shaped nanoparticles were observed only for Mg2 (Figure 4), La1, and La3 (Figure 5) fibers. Such nanoparticles were not observed in Mg1 fiber (Figure 3). For this sample, the elongated particles possessed ends with sharp points. The shape of the elongated particles has been studied extensively for various flows such as simple shear and two dimensional extensional flow [16,17]. These studies showed that the viscosity ratio between the particle and the matrix strongly influences the morphology of the elongated particle. In the case of an elongational flow, it has been reported that elongated particles with pointy extremities are specifically observed for viscosity ratios lower than 0.02, while a higher viscosity ratio induces a dumb-bell shape. Due to the lack of data on the composition of the particles, we cannot discuss the variation of the viscosity ratio in the samples treated herein. However, it has been reported that when the core of the preform is doped with magnesium and phosphorous, both elements partition into the nucleated nanoparticles [18]. Then, the presence or absence of phosphorous would further alter the viscosity of the particles.
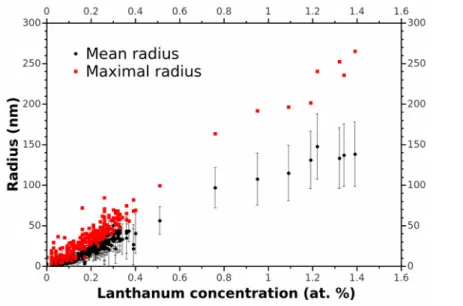
When the capillary number increases (higher than the critical capillary number), particles that elongate enough undergo Rayleigh-Plateau instability during fiber drawing, which can induce break-up. This phenomenon has been observed also when drawing a composite fiber made of chalocogenide glass [19] or metal [20] core embedded in a polymer cladding. The break-up produces chains of homogeneously spaced particles with monodispersed diameters, as observed in Figure 5. In this and the Author’s previous work, it has been observed that increasing drawing tension (decreasing drawing temperature) favors break-up. This can be explained by the increase of the capillary number [11]. Indeed, for a particle of defined radius, the higher the drawing tension, hence viscous stress, then the higher the capillary number (cf Equation 1). As indicated in Table 1, the La concentration changes slightly between the three samples, which should change the capillary number. Indeed, La concentration influences particle sizes. This variation has been investigated through SEM measurements and EDX analyses in the La2 preform and is presented in Figure 7. Both mean maximal particle radii increase with local La content, following the same linear trend. As a consequence, for La3 fibers, as the samples drawn at the higher drawing tension correspond to samples with lower La content (see Table 1), RNP decreases while the
viscous stress increases. However, regarding the La concentration in the three samples (see Table 1), the decrease of La concentration is not expected to decrease the mean size of particles from more than a factor 2. On the other hand, the temperature decreases from 1950 to 1790 °C, leading to an increase of the viscosity of
silica by one order of magnitude. Then, one can assume that the difference observed for the three samples is attributed to the variation of the drawing tension.
Figure 7: Evolution of the size of the particles as a function of La content in La2 preform. Results were obtained by combining SEM and EDX analyses. Each point of the figure is obtained at the maximal or mean radii of all particles from one SEM image. Each point is taken at various locations of the preform (radial and longitudinal),
and thus represent various groups of particles and various lanthanum contents. 5. Conclusion
In conclusion, the influence of draw temperature (tension) and composition on the morphology of oxide
particles embedded in the core of silica optical fibers was studied. During the draw step, spherical particles present in the preform can undergo elongation and even break-up into smaller particles. Elongation is due to flow-induced deformation and Rayleigh-Plateau instabilities. In this work, particles as long as 300 µm have been reported. Moreover, the role of particle composition on subsequent morphology was investigated and discussed. Finally, this work demonstrates that it is possible to favor break-up phenomenon by decreasing draw temperature (increasing draw tension), which offers new opportunities to control and tailor the size and shape of active particles in optical fibers.
Acknowledgements
The authors acknowledge S. Trzesien and M. Ude (INPHYNI, Nice, France) for the fabrication of the samples. This work was supported by ANR project Nice-DREAM (ANR-14-CE07-0016-03) and the French X-ray CT platform Nano-ID funded by the Equipex project (ANR-10-EQPX-39-01) of the “Investissements d’Avenir” French Government program. The Authors (CK and JB) also acknowledge support from the J. E. Sirrine Foundation. References
1 M.J.F. Digonnet, Rare-earth-doped fiber lasers and amplifiers, revised and expanded, CRC press, 2001.
2 W. Blanc, B. Dussardier, Formation and applications of nanoparticles in silica optical fibers, J. Opt. 45 (2016) 247-254. 3 I. Kasik; Kasik, P. Peterka, J. Mrazek, P. Honzatko, Silica optical fibers doped with nanoparticles for fiber lasers and
broadband sources, Curr Nanosci 12 (2016) 277-290.
4 B. Samson, P. Tick, N. Borrelli, Efficient neodymium-doped glass-ceramic fiber laser and amplifier, Opt. Lett. 26 (3) (2001) 145-147.
5 B.N. Samson, L. R. Pinckney, J. Wang, G. H. Beall, and N. F. Borrelli , Nickel-doped nanocrystalline glass-ceramic fiber, Opt. Lett. 27 (2002) 1309-1311.
6 J. MacChesney, P. O'Connor, H. Presby, A new technique for the preparation of low-loss and graded-index optical fibers, Proc. IEEE 62 (9) (1974) 1280-1281.
7 M. Vermillac, J.F. Lupi, F. Peters, M. Cabie, P. Vennegues, C. Kucera, T. Neisius, J. Ballato, W. Blanc, Fiber-draw-induced elongation and break-up of particles inside the core of a silica-based optical fiber, J. Am. Ceram. Soc. 100 (2017) 1814-1819.
8 V. Sudarsan, F.C. Van Veggel, R.A. Herring, M. Raudsepp, Surface Eu3+ ions are different than bulk Eu3+ ions in crystalline
doped LaF3 nanoparticles, J. Mater. Chem. 15 (13) (2005) 1332-1342.
9 M. Vermillac, H. Fneich, J.F. Lupi, J.B. Tissot, C. Kucera, P. Vennéguès, A. Mehdi, D.R. Neuville, J. Ballato, W. Blanc, Use of thulium-doped LaF3 nanoparticles to lower the phonon energy of the thulium's environment in silica-based optical
fibres, Opt. Mater. 68 (2017) 24-28.
10 J.F. Lupi, M. Vermillac, S. Trzesien, M. Ude, W. Blanc, B. Dussardier, Gradual-time solution doping for the fabrication of longitudinally varying optical fibres, J. Ligthwave Technol. 36 (2018) 1786-1791.
11 H.P. Grace, Dispersion phenomena in high viscosity immiscible fluid systems and application of static mixers as dispersion devices in such systems, Chem. Eng. Comm. 14 (1982) 225-277.
12 G. I. Taylor, The formation of emulsions in definable fields of flow, Proc. Roy. Soc. London A 146 (858) (1934) 501-523. 13 U. C. Paek, R. B. Runk, Physical behavior of the neck-down region during furnace drawing of silica fibers, J. Appl. Phys.
49 (8) (1978) 4417-4422.
14 S. Karbasi, R.J. Frazier, K.W. Koch, T. Hawkins, J. Ballato, A. Mafi, Image transport through a disordered optical fibre mediated by transverse Anderson localization, Nat. Commun. 5 (2014) 3362.
15 B. Abaie, E. Mobini, S. Karbasi, T. Hawkins, J. Ballato, A. Mafi, Random lasing in an Anderson localizing optical fiber, Light Sci. Appl. 6 (2017) e17041.
16 H.A. Stone, Dynamics of drop deformation and breakup in viscous fluids, Annu. Rev. Fluid Mech. 26 (1994) 65-102. 17 F.D. Rumscheidt, S.G. Mason, Particle motions in sheared suspensions XII. Deformation and burst of fluid drops in
shear and hyperbolic flow, J. Colloid Sci. 16 (1961) 238-261.
18 W. Blanc, C. Guillermier, B. Dussardier, Composition of nanoparticles in optical fibers by Secondary Ion Mass Spectrometry, Opt. Mat. Express 2 (2012) 1504-1510.
19 J.J. Kaufman, G. Tao, S. Shabahang, E.H. Banaei, D.S. Deng, X. Liang, S.G. Johnson, Y. Fink, A. F. Abouraddy, Structured spheres generated by an in-fibre fluid instability, Nature 487 (2012) 463-467.
20 S. Xue, G.W. Barton, S. Fleming, A. Argyros, Analysis of capillary instability in metamaterials fabrication using fiber drawing technology, J. Ligthwave Technol. 35 (2017) 2167-2174.