HAL Id: hal-01786893
https://hal.archives-ouvertes.fr/hal-01786893
Submitted on 22 Jun 2018
HAL is a multi-disciplinary open access
archive for the deposit and dissemination of
sci-entific research documents, whether they are
pub-lished or not. The documents may come from
teaching and research institutions in France or
abroad, or from public or private research centers.
L’archive ouverte pluridisciplinaire HAL, est
destinée au dépôt et à la diffusion de documents
scientifiques de niveau recherche, publiés ou non,
émanant des établissements d’enseignement et de
recherche français ou étrangers, des laboratoires
publics ou privés.
production in the western tropical South Pacific Ocean:
links with diazotrophic and photosynthetic activity
France van Wambeke, Audrey Gimenez, Solange Duhamel, Cecile Dupouy,
Dominique Lefèvre, Mireille Pujo-Pay, Thierry Moutin
To cite this version:
France van Wambeke, Audrey Gimenez, Solange Duhamel, Cecile Dupouy, Dominique Lefèvre, et al..
Dynamics and controls of heterotrophic prokaryotic production in the western tropical South Pacific
Ocean: links with diazotrophic and photosynthetic activity. Biogeosciences, European Geosciences
Union, 2018, 15 (9), pp.2669-2689. �10.5194/bg-15-2669-2018�. �hal-01786893�
https://doi.org/10.5194/bg-15-2669-2018 © Author(s) 2018. This work is distributed under the Creative Commons Attribution 4.0 License.
Dynamics and controls of heterotrophic prokaryotic production in
the western tropical South Pacific Ocean: links with diazotrophic
and photosynthetic activity
France Van Wambeke1, Audrey Gimenez1, Solange Duhamel2, Cécile Dupouy1,3, Dominique Lefevre1,
Mireille Pujo-Pay4, and Thierry Moutin1
1Aix-Marseille Université, CNRS, Université de Toulon, IRD, Mediterranean Institute of Oceanography (MIO)
UM 110, 13288, Marseille, France
2Lamont-Doherty Earth Observatory, Division of Biology and Paleo Environment, Columbia University,
P.O. Box 1000, 61 Route 9W, Palisades, New York 10964, USA
3Aix-Marseille Université, CNRS, Université de Toulon, IRD, Mediterranean Institute of Oceanography (MIO)
UM 110, 98848, Nouméa, New Caledonia
4CNRS, Sorbonne Université, Laboratoire d’Océanographie Microbienne (LOMIC), UMR 7621,
Observatoire Océanologique, 66650, Banyuls-sur-mer, France
Correspondence: France Van Wambeke (france.van-wambeke@mio.osupytheas.fr) Received: 22 December 2017 – Discussion started: 10 January 2018
Revised: 4 April 2018 – Accepted: 14 April 2018 – Published: 4 May 2018
Abstract. Heterotrophic prokaryotic production (BP) was studied in the western tropical South Pacific (WTSP) using the leucine technique, revealing spatial and temporal vari-ability within the region. Integrated over the euphotic zone,
BP ranged from 58 to 120 mg C m−2d−1within the
Melane-sian Archipelago, and from 31 to 50 mg C m−2d−1 within
the western subtropical gyre. The collapse of a bloom was followed during 6 days in the south of Vanuatu using a La-grangian sampling strategy. During this period, rapid evolu-tion was observed in the three main parameters influencing the metabolic state: BP, primary production (PP) and
bac-terial growth efficiency. With N2 fixation being one of the
most important fluxes fueling new production, we explored
relationships between BP, PP and N2fixation rates over the
WTSP. The contribution of N2fixation rates to bacterial
ni-trogen demand ranged from 3 to 81 %. BP variability was better explained by the variability of N2fixation rates than by that of PP in surface waters of the Melanesian Archipelago, which were characterized by N-depleted layers and low DIP turnover times (TDIP< 100 h). This is consistent with the fact that nitrogen was often one of the main factors controlling BP on short timescales, as shown using enrichment experi-ments, followed by dissolved inorganic phosphate (DIP) near the surface and labile organic carbon deeper in the euphotic
zone. However, BP was more significantly correlated with
PP, but not with N2fixation rates where DIP was more
avail-able (TDIP> 100 h), deeper in the Melanesian Archipelago,
or within the entire euphotic zone in the subtropical gyre. The bacterial carbon demand to gross primary production ra-tio ranged from 0.75 to 3.1. These values are discussed in the framework of various assumptions and conversion fac-tors used to estimate this ratio, including the methodological errors, the daily variability of BP, the bacterial growth ef-ficiency and one bias so far not considered: the ability for
Prochlorococcusto assimilate leucine in the dark.
1 Introduction
Heterotrophic prokaryotes can process, on average, 50 % of the carbon (C) fixed by photosynthesis in many aquatic systems (Cole, 1988). Understanding the controls of het-erotrophic bacterial production and respiration rates is fun-damental for two major aspects of marine C cycling: (i) to explore the possible fate of primary production through the microbial food web, and (ii) to construct a metabolic balance based on C fluxes. To assess these two major features,
bac-terial carbon demand (BCD; i.e., the sum of heterotrophic bacterial production (BP) and bacterial respiration (BR)) is compared to primary production (PP). The metabolic state of the ocean, and in particular the status of net heterotrophy within oligotrophic systems, has been largely debated in the last decade (see for example the review in Duarte et al., 2013; Ducklow and Doney, 2013; Williams et al., 2013).
The South Pacific Gyre (GY) is ultra-oligotrophic, and is characterized by deep UV penetration, by deep chlorophyll maximum (dcm) depth as great as 200 m, and by a 0.1 µM nitrate (NO3) isocline at 160 m (Claustre et al., 2008b; Halm et al., 2012). Our knowledge of the South Pacific Ocean’s metabolic state based on C fluxes is fragmentary, since only few primary production data have previously been reported, and never simultaneously with BP (see references in Ta-ble 1). The exception is the BIOSOPE cruise conducted in the GY and eastern tropical South Pacific (ETSP) in Novem-ber/December 2004, where both PP and BP were estimated simultaneously (Van Wambeke et al., 2008b).
The waters coming from the GY are essentially trans-ported by the South Equatorial Current toward the Melane-sian archipelagos in the western tropical South Pacific (WTSP). Interest in this region has increased due to field and satellite observation showing intermittent phytoplankton blooms in the area associated with Trichodesmium (Dupouy et al., 1988, 2011; Tenorio et al., 2018). The WTSP is a highly dynamic region (Rousselet et al., 2017) where patches of chlorophyll blooms can persist for up to a few weeks (de Verneil et al., 2017). The WTSP is a hotspot for biological nitrogen fixation (N2fix, Bonnet et al., 2017), extending to this whole oceanic region what was already measured locally near New Caledonia (Garcia et al., 2007). Based on nitro-gen budgets, such blooms can sustain significant new pro-duction and export in this area (Caffin et al., 2018). The de-velopment of these blooms is explained by different hypothe-ses, including temperature thresholds (in particular regulat-ing Trichodesmium blooms); increased light providregulat-ing more energy; the stratification of surface waters favoring depletion of nitrate and reducing competition with non-fixing primary producers; and increased availability of iron and phosphate (DIP) due to island mass effects, volcanic activities or atmo-spheric nutrient deposition (Moutin et al., 2005, 2008; Luo et al., 2014; Martino et al., 2014; Shiozaki et al., 2014, Bonnet et al., 2018).
While the dynamics of heterotrophic prokaryotes coupling with primary producers has been explored in many regions of the ocean, these processes have not been studied in the WTSP. Because most oligotrophic oceans are nitrogen
lim-ited, PP and N2fix have already been sampled simultaneously
in diverse studies and their relationships examined. Taking a Redfield ratio of 6.6, the contribution of N2fix rates to PP, in-tegrated over the euphotic zone, has been found to range from 1 to 9 % in diverse provinces of the Atlantic (Fonseca-Batista et al., 2016). The ratio is 15–21 % in the WTSP and 3–4 % in the center of the GY (Raimbault and Garcia, 2008;
Caf-fin et al., 2018). Few studies have attempted to examine how the variability of N2fix can be linked to that of heterotrophic activity, or to identify the contribution of N2fix rates to het-erotrophic prokaryotic N demand. Yet, recent genomic analy-ses exploring the diversity of the nitrogenase reductase (nifH) gene have revealed the importance of non-cyanobacterial ni-trogen fixers (Gradoville et al., 2017, and references therein). Owing to the fact that a great abundance of nifH gene copies does not imply that N2fix is occurring (see for example Turk-Kubo et al., 2014), diverse tests have been conducted to as-sess heterotrophic N2fixation indirectly. For example, in the oligotrophic eastern Mediterranean Sea, aphotic N2fix can account for 37 to 75 % of the total daily integrated N2fix rates (Rahav et al., 2013). In the Red Sea, N2fix rates are correlated with BP but not with PP during the stratified sum-mer season, while during a Trichodesmium bloom in winter, both PP and BP increased with N2fix rates, although the cor-relation was still insignificant with PP (Rahav et al., 2015). In the South Pacific, the presence of non-cyanobacterial ni-trogen fixers has been detected in the dark ocean as well as in the euphotic layer, with detectable levels of nifH gene
ex-pression, as measured by qPCR or N2fix activity determined
in darkness (in the GY: Halm et al., 2012; Moisander et al., 2014; in the eastern tropical South Pacific Ocean: Bonnet et al., 2013; in the Bismarck and Solomon seas: Benavides et al., 2015). The addition of selected organic molecules such as glucose (Dekaezemacker et al., 2013) or natural organic matter such as transparent expolymer particles, can also in-fluence N2fix rates (Benavides et al., 2015). Finally, recent
experiments based on incubation with15N-labeled N2
cou-pled to nano-SIMS analyses also demonstrated that a rapid transfer, at the scale of 24 to 48 h, can occur between N2 fix-ers, non-fixing phytoplankton and heterotrophic prokaryotes (Bonnet et al., 2016).
In this study, we examined the horizontal and vertical distributions of heterotrophic prokaryotic production along-side photosynthetic rates, N2fix rates and phosphate turnover times across the WTSP, in order to relate these fluxes to bottom–up controls (related to nitrogen, phosphorus and la-bile C availability). Particular attention was given to
deter-mine the coupling between BP and PP or N2fix rates, to
ex-amine the variability of bacterial carbon demand (BCD) in comparison to gross primary production (GPP) ratios and to discuss the metabolic state of this region.
2 Materials and methods
2.1 Sampling strategy
The OUTPACE cruise (https://doi.org/10.17600/15000900) was conducted in the WTSP region, from 18 February to 3 April 2015, along a transect extending from the north of New Caledonia to the western part of the South Pacific Gyre (WGY) (25◦S, 115◦E–15◦S, 149◦W, Fig. 1). For details on
T able 1. Re vie w of inte grated primary production rates published in the South P acific, PP flux es in mg C m − 2d − 1. Only open sea data were included. Area Latitude Longitude Number of Period T echnique PP flux es Reference stations mg C m − 2d − 1 Solomon Sea 3–9 ◦S 146–152 ◦E 12 Feb/Mar 2014 13 C, GF/F , deck 204–1116 Ganachaud et al. (2017) Solomon Sea 5–12 ◦S 147–165 ◦E 15 Jun/Aug 2012 13 C, GF/F , deck 480–1200 Eastern Australia of fshore 27–29 ◦S 160–162 ◦E 2 Sep 2004 14 C, GF/F , deck. 260–910 Y oung et al. (2011) Ne w Caledonian 17–23 ◦S 157–170 ◦E 7 Jul–Aug 2011 14 C, 0,4 µm PC, P vs. I 352 ± 160 Menk es et al. (2015) Exclusi v e Econ. Zone 17–23 ◦S 157–170 ◦E 5 No v–Dec 2011 14 C, 0,4 µm PC, P vs. I 231 ± 133 Melanesian Archipelago 18–19 ◦S 159 ◦E–170 ◦W 14 Feb/Mar 2015 14 C, 0.2 µm PC, deck 148–858 Moutin et al. (2018), this study Marquesas archipelago 8–13 ◦S 140–130 ◦W 5 No v–Dec 2004 14 C, 0.2 µm PC, deck 250–680 V an W ambek e et al. (2008a) W estern GY 18 ◦S 169–149 ◦W 4 Feb/Mar 2015 14 C, 0.2 µm PC, deck 55–208 Moutin et al. (2018), this study Center GY 15–30 ◦S 130–100 ◦W 11 No v–Dec 2004 14 C, 0.2 µm PC, deck 76–167 V an W ambek e et al. (2008a) Center GY 25–26 ◦S 104–100 ◦W 2 No v–Dec 2010 14 C, 0.2 µm PC, deck 216–276 Rii et al. (2016) Center GY 23–27 ◦S 165–117 ◦W 7 Dec 2006–Jan 2007 13 C, GF/F , deck 8–33 Halm et al. (2012) Southern rim of the GY 38–41 ◦S 153–133 ◦W 3 Dec 2006–Jan 2007 13 C, GF/F , deck 79–132 Halm et al. (2012) East GY 30–33 ◦S 95–78 ◦W 6 No v–Dec 2004 14 C, 0.2 µm PC, deck 195–359 V an W ambek e et al. (2008a) East GY 23 ◦S 88 ◦W 1 No v–Dec 2010 14 C, 0.2 µm PC, deck 600 Rii et al. (2016)
160˚ 160˚ 170˚ 170˚ 180˚ 180˚ −170˚ −170˚ −160˚ −160˚ −150˚ −150˚ −30˚ −30˚ −25˚ −25˚ −20˚ −20˚ −15˚ −15˚ −10˚ −10˚ 160˚ 160˚ 170˚ 170˚ 180˚ 180˚ −170˚ −170˚ −160˚ −160˚ −150˚ −150˚ −30˚ −30˚ −25˚ −25˚ −20˚ −20˚ −15˚ −15˚ −10˚ −10˚ 160˚ 160˚ 170˚ 170˚ 180˚ 180˚ −170˚ −170˚ −160˚ −160˚ −150˚ −150˚ −30˚ −30˚ −25˚ −25˚ −20˚ −20˚ −15˚ −15˚ −10˚ −10˚ SD 01 SD 02 LD A SD 03 SD 06 SD 09 SD 07 SD 10 SD 14 SD 13 LD C SD 15 SD 04 SD 05 SD 08 SD 11 SD 12 LD B WMA EMA WGY Other −8000 −6000 −4000 −2000 0 m Bathymetry Noumea Papeete
Figure 1. Position of stations during the OUTPACE cruise. The white line shows the vessel route (data from the hull-mounted ADCP positioning system). In dark green WMA (Western Melanesian Archipelago) including SD1, 2, 3 and LDA; in light green, EMA: Eastern Melanesian Archipelago including SD6, 7, 9 and 10 and in blue WGY (Western Subtropical Gyre) including stations SD13, 14, 15 and LDC. Figure courtesy of Thibaut Wagener.
the strategy of the cruise, see Moutin et al. (2017). Stations of short duration (< 8 h, 15 stations named SD1 to SD15, Fig. 1) and long duration (6 days, 3 stations named LDA to LDC) were sampled. Generally, at least three CTD casts go-ing down to 200 m were conducted at each short station, ex-cept at SD5 and SD9 (two casts) and at SD13 (one cast). The LD stations were abbreviated LDA (situated north of New Caledonia), LDB (in the Vanuatu area) and LDC (olig-otrophic reference in the GY area). LD stations were se-lected based on satellite imagery, altimetry and Lagrangian diagnostics (Moutin et al., 2017), and by the abundance of selected diazotrophs nifH gene copies analyzed by quantita-tive polymerase chain reaction (qPCR), in real time on board (Stenegren et al., 2018). At these LD stations, CTD casts were performed every 3 h following the water mass using a Lagrangian sampling strategy during at least 5 days. All sam-ples were collected from a CTD-rosette system fitted with 20 12 L Niskin bottles and a Sea-Bird SBE9 CTD.
At the SD stations, water samples used for measuring in situ simulated primary production (PPdeck), dissolved inor-ganic phosphate turnover times (the ratio of DIP concentra-tion to DIP uptake rate, TDIP)and N2fix rates came from the same rosette cast as water used for measuring BP. At the LD sites, we also conducted biodegradation experiments to de-termine bacterial growth efficiency (BGE), along with en-richment experiments to explore the factors limiting BP.
In addition to the measurements of chlorophyll a, BP, PP,
TDIPand DOC described below, other data presented in this
paper include hydrographic properties, nutrients and N2fix,
for which detailed protocols of analysis and considerations for methodology are available in Moutin et al. (2017, 2018) and Bonnet et al. (2018). Briefly, DIP and nitrate concen-trations were measured using standard colorimetric proce-dures on a AA3 AutoAnalyzer (Seal-Analytical). The
quan-tification limits were 0.05 µM for both nutrients. N2
fixa-tion rates were measured using the 15N2 tracer method in
4.5 L polycarbonate bottles inoculated with 5 mL of15N2gas
(99 atom %15N, Eurisotop). Note that the risk of
underesti-mation by this bubble method was checked by subsampling and fixing 12 mL of each bottle after incubation and to
ana-lyze the dissolved15N2with a Membrane Inlet Mass
Spec-trometer.
2.2 Chlorophyll a
For chlorophyll a (Chl a), a sample of 288 mL of seawater was filtered through 25 mm Whatman GF/F filters immedi-ately after sampling and placed at −80◦C in Nunc tubes until analysis. At the laboratory (3 months after the cruise), after grinding the GF/F filter in 5 mL methanol, pigments (Chl a and phaeophytin) were extracted in darkness over a 2 h
pe-riod at 4◦C and analyzed with a Trilogy Turner 7200-000
fluorometer according to Le Bouteiller et al. (1992). Sam-pling for Chl a analysis started only at site LDA (Dupouy et al., 2018). In vivo fluorescence was performed with an Aqua-Traka III (ChelseaTechnologies Group Ltd) sensor mounted on the CTD.
The overall correlation between in vivo
flu-orescence (Chl iv) and Chl a was very patchy
(Chl a = 1.582 × Chl iv + 0.0241, n = 169, r = 0.61). This is due to the heterogeneity at the time of sampling and the nature of the populations present, i.e., essentially different fluorescence yields over depth and species (Neveux et al., 2010). Thus in vivo fluorescence was used only to track high-frequency variability at the LD sites, the shape of a vertical profile’s distributions and the location of the dcm, as well as longitudinal trends. Fluorometric discrete data (Chl a) were used for calculating and comparing integrated Chl a stocks.
2.3 Bacterial production
Bacterial production (BP, sensus stricto referring to het-erotrophic prokaryotic production) was determined onboard
using the microcentrifuge method with the 3H-leucine (3
H-Leu) incorporation technique to measure protein production (Smith and Azam, 1992). Triplicate 1.5 mL samples and a killed control with trichloracetic acid (TCA) at 5 % final
con-centration were incubated with a mixture of [4,5-3H]leucine
(Amersham, specific activity 112 Ci mmol−1) and
nonra-dioactive leucine at final concentrations of 7 and 13 nM, re-spectively. Samples were incubated in the dark at the respec-tive in situ temperatures for 1–4 h. On nine occasions, we checked that the incorporation of leucine was linear with time. Incubations were ended by the addition of TCA to a final concentration of 5 %, followed by three runs of cen-trifugation at 16 000 g for 10 min. Bovine serum albumin
(BSA, Sigma, 100 mg L−1 final concentration) was added
before the first centrifugation. After discarding the super-natant, 1.5 mL of 5 % TCA was added before the second cen-trifugation. For the last run, after discarding the supernatant, 1.5 mL of 80 % ethanol was added. The ethanol supernatant was then discarded and 1.5 mL of liquid scintillation cock-tail (Packard Ultimagold MV) was added. The radioactiv-ity incorporated into macromolecules was counted using a Packard LS 1600 Liquid Scintillation Counter onboard the
ship. A factor of 1.5 kg C mol leucine−1was used to convert
the incorporation of leucine to carbon equivalents, assuming no isotopic dilution (Kirchman, 1993). Indeed, isotopic dilu-tion ranged from 1.04 to 1.18, as determined in five
experi-ments where we checked the saturating level of3H-leucine.
Standard deviation associated with the variability between triplicate measurements averaged 12 and 8 % for BP values lower and higher than 10 ng C L−1h−1, respectively. At the LD sites, BP was sampled every day at 12:00 local time.
2.4 Primary production and phosphate turnover times
Primary production (PP) and dissolved inorganic phosphate
turnover times (TDIP) were determined using a dual 14
C-33P labelling technique following Duhamel et al. (2006) and
described in Moutin et al. (2018). Briefly, after inoculation
with 10 µCi of 14C sodium bicarbonate and 4 µCi of 33
P-orthophosphoric acid, 150 mL polycarbonate bottles were in-cubated in on-deck incubators equipped with blue screens (75, 54, 36, 19, 10, 2.7, 1, 0.3 and 0.1 % incident light, https://outpace.mio.univ-amu.fr/spip.php?article135, last ac-cess: 27 April 2018) and flushed continuously with surface sea water. Incubation times lasted 4 (western stations) to 24 h (South Pacific Gyre area) and were chosen according to ex-pected TDIP. Samples were then filtered through 0.2 µm poly-carbonate membranes, with radioactivity retained by the fil-ters being assessed by liquid scintillation counting directly on board and after 12 months in the laboratory. Rates of daily primary production were computed using the conversion
fac-tors τ(T i;T ) according to Moutin et al. (1999) to calculate
normalized (dawn-to-dawn) daily rates from the incubation period measured in the on-deck incubators (PPdeck).
Measurements of PP using the JGOFs protocol (in situ moored lines immerged for 24 h from dawn-to-dawn, IPPin situ)were also performed at each long station on days 1, 3 and 5 (see Caffin et al., 2018, for details). Integrated rates within the euphotic zone were estimated by trapezoidal inte-grations, assuming the same rate between 0 m and the shal-lowest sampled depth and considering PP to be zero at 20 m below the deepest sampled depth.
2.5 Bacterial growth efficiency and dark community
respiration
Bacterial growth efficiency (BGE) and DOC lability were es-timated at the three LD sites using dilution experiments with seawater sampled in the mixed layer. The seawater used for these experiments was sampled from Niskin bottles (9 m at LDA, 7 m at LDB and 16 m at LDC) from a CTD cast done at 12:00 local time on the first day of occupation at each LD site. A 1/5 dilution culture was established by mixing a bac-terial inoculum from the same seawater sample (0.4 L of a < 0.8 µm filtrate) with 1.6 L of < 0.2 µm filtrate, in a borosil-icate bottle. Samples were incubated in the dark, for up to 10 days, in a laboratory incubator set at in situ temperature. Periodically, for up to 10 days, subsamples were taken to estimate DOC concentrations and bacterial production. The BGE was estimated from DOC and bacterial production es-timates on a given time interval corresponding to the expo-nential phase of BP following Eq. (1):
BGE = BPint/DOCcons, (1)
where BPint is the trapezoidal integration of BP with time
for the period considered, and DOCconsthe dissolved organic
carbon consumed during that period, corresponding to the difference in DOC concentration between initial (DOCinitial) and minimal DOC (DOCmin). From these experiments, the labile fraction of DOC (LDOC) was determined following Eq. (2):
LDOC = (DOCinitial−DOCmin)/DOCinitial. (2)
Samples for DOC concentration were filtered through two
precombusted (24 h, 450◦C) glass fiber filters (Whatman
GF/F, 25 mm) using a custom-made all-glass/Teflon filtra-tion syringe system. Samples were collected into precom-busted glass ampoules and acidified to pH 2 with
phospho-ric acid (H3PO4). Ampoules were immediately sealed until
analyses by high-temperature catalytic oxidation (HTCO) on a Shimadzu TOC-L analyzer (Cauwet, 1999). Typical ana-lytical precision is ±0.1–0.5 (SD) or 0.2–0.5 % (CV). Con-sensus reference materials (http://www.rsmas.miami.edu/ groups/biogeochem/CRM.html, last access: 27 April 2018) were injected every 12 to 17 samples to ensure stable operat-ing conditions.
Rates of dark community respiration (DCR) were used to estimate bacterial growth efficiency (see the discussion). Briefly, DCR was estimated from changes in the dissolved
oxygen (O2)concentration during dark incubations of
unfil-tered seawater (24 h) carried out at LD stations, in situ on the same mooring lines used for PPin situ. Quadruplicate biologi-cal oxygen demand bottles were incubated in the dark at each sampled depth. The concentration of oxygen was determined by Winkler titration (Williams and Jenkinson, 1982). DCR was calculated as the difference between initial and final O2 concentrations. The mean standard error of volumetric DCR rates was 0.28 µmol O2L−1d−1.
2.6 Enrichment experiment
Enrichment experiments were performed along vertical pro-files at the three LD sites LDA, LDB and LDC. Seawater was sampled at 12:00 local time on day 2 of occupation at each site (CTD cast numbers 33, 117 and 166, respectively). Nu-trients were added in 60 mL transparent polycarbonate
bot-tles at a final concentration of 1 µM NH4Cl + 1µM NaNO3
in “N” amended bottles, 0.25 µM Na2HPO4in “P” amended
bottles and 10 µM C-glucose in “G” amended bottles. The sum of all these elements was added in “NPG” amended bot-tles. Controls “C” were left unamended. Bottles were incu-bated on average for 24 h under simulated in situ conditions
(in the same on-deck incubators as those used for PPdeck).
Selected depths chosen encompassed the euphotic zone. At LDA: 9, 24, 35, 70, and 100 m were incubated under 54, 10, 3, 1, and 0.3 % incident light; at LDB: 7, 12, 27, and 42 m were incubated under 54, 36, 10, and 3 % incident light; and at LDC: 16, 60, 91, and 135 m were incubated under 54, 10, 3, and 1 % incident light, respectively. For depths deeper than the euphotic zone (200 m at LDA, 100 and 200 m at LDB and 200 m at LDC), flasks were incubated in the dark in a labora-tory incubator set at in situ temperature. After 24 h of incuba-tion, subsamples were taken from each flask to perform BP incubations as described for in situ samples (triplicate esti-mates, incubation in the dark), except that incubations lasted only 1 h. Results are presented as an enrichment factor rela-tive to the unamended control.
2.7 Statistics
Relationships between variables were established using model II Tessier linear regressions, from log-transformed data. Multiple regressions were also used to study the
si-multaneous effects of PP and N2fix rates on BP variability.
The effect of enrichments was tested by comparing BP ob-tained in the unamended control with BP obob-tained in the amended samples using a Mann–Whitney non-parametric test. This test was also used to estimate differences between geographic zones described in Table 2. Standard errors (SE) of integrated rates were calculated following the propagation procedures.
1 2 A 3 4 5 6 7 8 9 10 11 12 B 13 C 15 Primary production (mg C m d )-3 -1
Heterotrophic prokaryotic production (ng C l-1 h-1)
14 a (b) 1 (a) 1 2 A 3 4 5 6 7 8 9 10 11 12 B 13 C 14 15 1 Section distance [km]
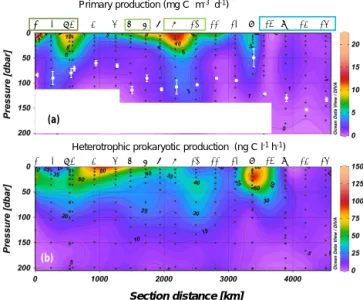
Figure 2. Distribution of primary production (a) and heterotrophic prokaryotic production (b) along the OUTPACE cruise transect; WMA (dark green), EMA (light green) and WGY (blue) stations are noted by colored rectangles. Interpolation between sampling points in contour plots was made with the Ocean Data View software (VG gridding algorithm, Schlitzer, 2004). In order to be homogeneous for the whole transect, for sites LDA, LDB and LDC the data plot-ted for PP were from a single profile, that of PPdeck, while for BP we plotted all profiles. The white dots in (a) correspond to the av-erage ± SD of the dcm depth at each station. The white rectangles mask abnormal extrapolation due to the absence of PP data.
3 Results
3.1 Regional oceanographic settings
The longitudinal transect started northwest of New Caledo-nia, crossed the Vanuatu and Fiji Arcs and finished inside the western part of the ultra-oligotrophic South Pacific Gyre. It covered a vast region of the WTSP and the main gradi-ent of biogeochemical and biological properties between the Melanesian Archipelago (MA) (stations SD1 to SD12 and LDA) and the western part of the South Pacific Gyre (WGY) (SD13 to SD15 and LDC) separated by the Tonga Volcanic
Arc (Fig. 1). Temperature ranged from 19.7 to 30.2◦C within
the 0–200 m layer (see Fig. 3a in Moutin et al., 2017). Den-sity revealed shallow mixed layers, due to the sharp vertical temperature gradients. The transition between these MA and WGY areas is particularly evidenced by an enhanced degree of oligotrophy in the WGY area. The WGY area was char-acterized by dcm depth greater than 115 m (Table 2), a deep nitracline (130 m), nitrite peaks around 150 m and detectable amounts of phosphate at the surface (> 100 nM, Moutin et al., 2018). A detailed analysis of the vertical distribution of nutrients and organic matter made it possible to identify two groups of stations within the MA area, each having common biogeochemical characteristics: one group between 160 and
T able 2. Ph ysical and biological characteristics of main biogeochemical areas and long duration stations sampled during the OUTP A CE cruise. Dept h of the dcm (deep chloroph yll maximum, based on v ertical profiles of in vi v o fluorescence), σ t: sigma-theta at the dcm (kg m − 3), Ichl a (inte grated chloroph yll a from fluorometric discrete analyses on extracted samples), IN 2 fix (inte grated N2 fixation rates), IPP (inte grated primary production), IBP (inte grated bacterial production at the depth of the euphotic zone), DCR (dark community respiration int egrated o v er the euphotic layer). WMA clustered stations SD1, 2, 3 and LD A, EMA clustered SD 6, 7, 9 and 10, WGY clustered SD13, 14, 15 and LDC. In order to encompass only spatial v ariability for WMA, EMA and WGY groups of stations, means and ranges of dcm depths and of σ t at the dcm depth were based on the av erages v alues set indi vidually at each SD or LD stations as more than one cast w as sample d per stat ion. Means ± SD and range v alues gi v en for LD A, LDB and LDC illustrate the temporal v ar iability at LD sites: all ctd casts sampled at each LD site do wn to 200 m were included. WMA EMA WGY LD A LDB LDC dcm depth mean ± SD (n ) 82 ± 10 (4) 105 ± 10 (4) 136 ± 14 (4) 81 ± 9 (46) 50 ± 18 (47) 131 ± 7 (46) m range 72–91 91–115 123–154 63–101 10–77 115–154 σ t at the dcm mean ± SD (n ) 23.8 ± 0.4 (4) 24.2 ± 0.3 (4) 24.53 ± 0.09 (4) 23.55 ± 0.05 (46) 23.1 ± 0.7 (47) 24.62 ± 0.02 (46) kg m − 3 range 23.5–24.3 23.8–24.6 24.4–24.6 23.47–23.64 21.7–23.9 24.59–24.67 Ichl a mean ± SD (n ) nd 28.7 ± 6.2 (4) 18.1 ± 4.5 (4) 26.0 ± 2.6 (5) 38.9 ± 10.4 (5) 16.2 ± 1.3 (7) mg Chl a m − 2 range 23.6–37.8 13.2–23.6 23.7–29.6 23.9–53.2 14.0–17.7 IN 2 fix (deck) mean ± SD (n) 0.65 ± 0.21 (4) a 0.50 ± 0.27 (4) a 0.09 ± 0.08 (3) a ,c nmole N m − 2d − 1 range 0.48–0.96 0.21–0.85 0.02–0.17 0.63 a 0.94 a 0.07 a IN 2 fix (in situ) mean ± SD (n ) 0.59 ± 0.05 (3) a 0.70 ± 0.30 (3) a 0.06 ± 0.01 (3) a nmole N m − 2d − 1 range 0.53–0.63 0.38–0.98 0.05–0.08 IPP deck mean ± SD (n ) 481 ± 147 (4) b 471 ± 276 (4) b 154 ± 55 (3) a ,c mg C m − 2d − 1 range 367–698 192–853 104–213 698 a 383 a 213 a IPP in situ mean ± SD (n ) 267 ± 79 (3) a 436 ± 72 (3) a 155 ± 8 (3) a mg C m − 2d − 1 range 200–354 361–507 149–165 IBP within Ze mean ± SD (n ) 99 ± 15 (4) 95 ± 12 (4) 33 ± 2 (3) c 98 ± 16 (5) 113 ± 15 (6) 45 ± 5 (6) mg C m − 2d − 1 range 82–120 80–110 31–35 81–115 86–133 38– 50 DCR mean ± SD (n) nd nd nd 226 ± 44 (3) 172 ± 18 (3) 147 ± 38 (3) mmol O2 m − 2d − 1 range 182–269 151–185 103–176 aV alues from Bonnet et al. (2018) and Caf fin et al. (2018) also presented in Fig. 3b . bV alues from Moutin et al. (2018) also presented in Figs. 2 and 3a. cAt station SD13, BP and N2 fix rates were not measured; PP obtained w as abnormally lo w (55 mg C m − 2d − 1) and excluded from the mean; nd: not determined.
(a) (b) 0 200 400 600 800 1000 1200 1400 1600 0 20 40 60 80 100 120 140 1 2 3 A 4 5 6 7 8 9 10 11 12 B 13 C 14 15 Pr im a ry p ro d u c ti o n (m g C m -2 d -1) H e te ro tr o p h ic p ro k a ry o ti c p rod u ctio n (m g C m -2 d -1) I-BP I-PP 0 20 40 60 80 100 0,0 0,5 1,0 1,5 2,0 1 2 3 A 4 5 6 7 8 9 10 11 12 B 13 C 14 15 R a ti o N 2 fi x to b a c te ri a l N d e m a n d (%) N2 f ix a tio n r at es (mmo le N m -2 d -1) I N2 fix R atio N2fix/I-BND
Figure 3. (a) Distribution of integrated heterotrophic prokaryotic production (IBP) and primary production (IPPdeck)along the tran-sect, data were integrated over the euphotic zone. WMA (dark green), EMA (light green) and WGY (blue) stations are noted
by colored rectangles. (b) Distribution of integrated N2 fixation
rates and of ratio N2fixation rates to bacterial nitrogen demand (I
N2fix/I-BND, assuming a bacterial C / N ratio of 5 and no
nitro-gen excretion) along the transect. Data were integrated down to the deepest sampled depth for N2fixation rates. Data plotted for sites
LDA, LDB and LDC correspond to BP, PPdeckand N2fix measured
on day 5. Error bars are standard errors (SE) derived from triplicate measurements at each depth (BP, PPdeck, N2fix rates). For BP, error bars also take into account the daily variability, and final SE were calculated after propagation of errors. PP obtained at SD13 was
ab-normally low (55 mg C m−2d−1)and was excluded; BP and N2fix
rates were not measured at this station.
170◦E called WMA for “Western Melanesian Archipelago”
clustered SD1, 2, 3 and LDA and a second group south of Fiji called EMA for “Eastern Melanesian Archipelago” clustered SD6, 7, 9 and 10 (Moutin et al., 2018). Main biogeochemi-cal differences between these two groups of stations were re-lated to shallower depths for the phosphacline (20 m), nitra-cline (76 m), and dcm (82 m) in the WMA group (see Table 2 and Fig. 5b, c in Moutin et al., 2018). The EMA group had depths for these parameters intermediate to those recorded at the WMA and WGY groups (phosphacline 44 m, nitracline 100 m and dcm 105 m). Although geographically included within the MA area, LDB corresponded to a particular bloom condition and is therefore presented and discussed separately.
3.2 Longitudinal distributions
The mixed layers for most of the cruise were ≤ 20 m (Moutin et al., 2018; de Verneil et al., 2018), except at SD13 and LDC, where the mixed layer depths were 27 and 34 m, respectively. The dcm depth ranged between 61 and 115 m in the MA and between 123 and 154 m in the WGY (Table 2; see Fig. 3d in Moutin et al., 2017). Integrated Chl a concentrations ranged
from 13 to 23 mg Chl a m−2in the WGY, and were
signif-icantly lower than those in the MA (20–38 mg Chl a m−2,
Mann–Whitney test, p = 0.013). The mean dcm depth within the EMA was slightly deeper (mean ± SD: 105 ± 10 m, Ta-ble 2) than in the WMA (82 ± 10 m, Mann–Whitney test,
p =0.03).
Maximum primary production rates reached 20.8 mg C m−3d−1(Fig. 2a). PP rates greater than 10 mg C m−3d−1 were obtained in the MA at SD1, SD7, and SD9 and also at sites LDA and LDB (see below), whereas stations in the
WGY showed values less than 1.3 mg C m−3d−1. Bacterial
production ranged from 0.8 to 138 ng C L−1h−1 in the 0–
200 m layer (Fig. 2b). Within the MA area, BP reached
val-ues greater than 100 ng C L−1h−1 at SD1 and SD5 within
the surface (5 m depth, Fig. 2b). High BP values were also found at LDB (see below). Within the WGY, maximum BP rates reached 27 ng C L−1h−1(at site LDC; see below).
Integrated primary production (IPPdeck)ranged from 178
to 853 mg C m−2d−1within the MA and from 104 to 213 mg
C m−2d−1within the WGY (Fig. 3a). Integrated BP (IBP)
over the euphotic zone ranged from 58 to 120 mg C m−2d−1
within the MA and from 31 to 35 mg C m−2d−1within the
WGY (Fig. 3a). Both integrated fluxes over the euphotic zone were statistically lower within WGY (Mann–Whitney test, p = 0.01 for IBP and p = 0.03 for IPPdeck). In contrast, for the WMA and EMA group of stations, integrated fluxes were not statistically different, neither for IBP (99 ± 15
ver-sus 95 ± 12 mg C m−2d−1, Mann–Whitney test, p > 0.05)
nor for IPPdeck (481 ± 47 versus 471 ± 276 mg C m−2d−1,
p >0.05).
DIP turnover times (TDIP)ranged over 4 orders of
magni-tude along the transect (from 2.1 up to 1000 h, Fig. 4). TDIP roughly increased with depth, coincident with the increase
in DIP concentrations below the phosphacline. TDIP also
showed a clear MA–WGY transition zone. Within the WGY
mixed layers, TDIPranged from 469 to 4200 h (Fig. 4a),
co-incident with detectable amounts of DIP (around 100 nM) in
this area (Moutin et al., 2018). TDIP were lower in the MA
than in the WGY. However, TDIP ranged from 2 to 857 h
in the mixed layers of the MA, with lower values associ-ated with stations LDB-d5, LDA-d5, SD3, SD4 and SD6, and with elevated values being measured at SD2, SD5, SD7
and SD12. This TDIPrange, encompassing 2 orders of
mag-nitude, suggests a much higher range of DIP availability than DIP concentration alone would suggest. Below the
phospha-cline, TDIP increased with depth more sharply in the WMA
Dep th (m ) 0 50 100 150 200 1 10 100 1000 10 000 TDIP (h) 13 C-d5 14 15 0 50 100 150 200 1 10 100 1000 10 000 TDIP (h) 1 2 3 A-d5 0 50 100 150 200 1 10 100 1000 10 000 6 7 9 10 0 50 100 150 200 1 10 100 1000 10 000 4 5 8 11 12 B-d5 Dep th (m )
(a)
(b)
(c)
(d)
WGY WMA EMA O thersFigure 4. Vertical distributions of phosphate turnover times (TDIP) in groups of stations WGY (a), WMA (b), and EMA (c) and other
stations (d). At the long-duration sites LDA, LDB and LDC, TDIP
profiles were determined at day 5 (bold lines). The horizontal bar in (b) (WMA) and (c) (EMA) delineates the mean phosphacline depth (mean ± SD: 20 ± 7 m and 44 ± 10 m, respectively) as deter-mined by Moutin et al. (2018). At WGY (a), DIP concentrations were >100 nM at all depths.
3.3 Daily variability at the long occupation sites
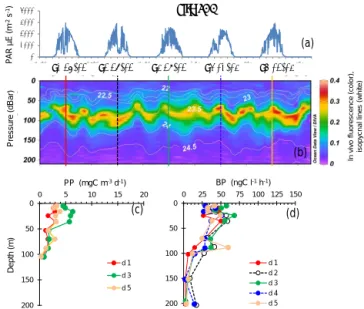
Site LDA showed variable dcm depth during the occupa-tion time, with patches of in vivo fluorescence moving up and down the water column with time over a band of 40 m height (dcm depth varied between 63 and 101 m, Table 2). However, the dcm depth corresponded to a stable density horizon (σ t 23.55 ± 0.04 kg m−3), with its fluctuation cor-responding to internal waves characterized by a periodicity of about 2 per day (Bouruet-Aubertot et al., 2018; Fig. 5). BP and PP peaked in shallower layers, at 10–25 m depth
(range 47–68 ng C L−1h−1 for BP and 3–6 mg C m−3d−1
for PP), and sometimes presented a second, much less in-tense peak close to the dcm depth (Fig. 5). Overall, BP and PP showed parallel trends, increasing slightly on day 3 com-pared to days 1 and 5. Integrated Chl a was on average 26.0 ± 2.6 mg Chl a m−2, IPPin situ 267 ± 79 mg C m−2d−1 0 1000 2000 3000 4000 26/2 d1 26/02 d2 27/02 d3 28/02 d4 01/03 d5 02/03 27/2 28/2 1/3 2/3 3/3 P A R µ E (m -2 s -1) P ressu re (d B a r) I n v iv o f lu o re s c e n c e ( c o lo r) , isop y cna l line s ( w hi te) 0 50 100 150 200 0 25 50 75 100 125 150 BP (ngC l-1 h-1) d 1 d 2 d 3 d 4 d 5 0 50 100 150 200 0 5 10 15 20 PP (mgC m-3 d-1) d 1 d 3 d 5 Dep th (m ) Site LDA (a) (b) (c) (d)
Figure 5. Evolution of surface PAR (a), in vivo fluorescence and pycnoclines (b), PP (c) and BP (d) at site LDA. Time units in local time; day 1 was 26 February 2015. BP samples were taken at the 12:00 ctd cast, while samples for PPin situwere taken at the 03:00 ctd casts (days 1, 3 and 5). In graph (b), in vivo fluorescence is in color, isopycnes (kg m−3)are the white lines and vertical bars show the 12:00 ctd cast sampled for BP each day (1 to 5), with corresponding colors used for plotting BP vertical profiles in (d).
and IBP 98 ± 16 mg C m−2d−1 (Table 2). DCR means
(±SD) were 226 ± 43 mmole O2m−2d−1(Table 2).
Site LDB, sampled inside a high chlorophyll patch, showed maxima of in vivo fluorescence between 10 and 77 m, the chlorophyll maximum depth showing a signifi-cant linear deepening with time (10.4 ± 0.8 m d−1, r = 0.89,
n =45, p < 0.001). Contrarily to site LDA, the dcm depth
did not correspond to a stable pycnocline horizon, as den-sity associated with the dcm depth varied between 21.8 and
23.9 kg m−3, and reached a plateau after day 4 (data not
shown). Chl was distributed over a larger layer (between the surface and 80 m) during the first three days, and then pre-sented a narrower and deeper zone of accumulation, with in-tensities increasing (Fig. 6). Integrated Chl a decreased from
53.2 to 23.9 mg Chl a m−2between days 1 and 5, which
cor-responded to a chlorophyll biomass net loss of about 7.3 mg Chl a m−2d−1. The shape of BP and PP vertical profiles was particularly modified at day 5, showing a small decrease in
subsurface values for BP (125 down to 100 ng C L−1h−1)
and a larger one for PP (15 down to 9 mg C m−3d−1). In
contrast, BP increased within the dcm depth at day 5.
Inte-grated PP decreased by approximatively 145 mg C m−2d−1
between days 3 and 5. PP was not measured at day 4, but a de-crease of BP rates in sub-surface layers was already visible. Six profiles were available for BP from which we estimated a
0 1000 2000 3000 15/3/15 0:00 16/3/15 0:00 17/3/15 0:00 18/3/15 0:00 19/3/15 0:00 20/3/15 0:00 d1 15/03 d2 16/03 d3 17/03 d4 18/03 d5 19/03 0 50 100 150 200 0 25 50 75 100 125 150 BP (ngC l-1 h-1) d 1 d 2 d 3 d 4 d 5 0 50 100 150 200 0 5 10 15 20 PP (mgC m-3 d-1) d 1 d 3 d 5 Site LDB P A R (µE m -2 s -1) P ressu re d B a r P ressu re (d B a r) Dep th (m ) I n v iv o f lu o re s c e n c e ( c o lo r) , isop y cna l line s ( w hi te) (a) (b) (c) (d)
Figure 6. Evolution of surface PAR (a), in vivo fluorescence and pycnoclines (b), PP (c) and BP (d) at site LDB. Time units in local time; day 1 was 15 March 2015. BP samples were taken at the 12:00 ctd cast, while samples for PPin situwere taken at the 03:00 ctd casts (days 1, 3 and 5). In graph (b) in vivo fluorescence is in color, isopy-cnes (kg m−3)are the white lines and vertical bars show the 12:00 ctd cast sampled for BP each day (1 to 5), with corresponding colors used for plotting BP vertical profiles in (d).
r =0.78). DCR decreased with time from 185 to 151 mmole
O2m−2d−1, from day 1 to day 5, respectively.
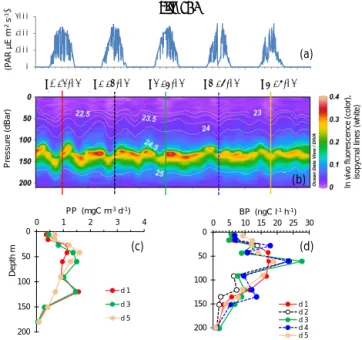
Site LDC, typical of the ultra-oligotrophic WGY area, presented a deeper dcm depth, ranging from 115 to 154 m, due to internal waves (Fig. 7). Similarly to site LDA, the dcm depth corresponded to a stable density horizon
(σ t 24.59 ± 0.02 kg m−3, n = 46). PP exhibited two peaks
around 40–60 and 120 m, but they remained very low
(max. 2.3 mg C m−3d−1)compared to the other sites LDA
and LDB. BP profiles paralleled those of PP, also reach-ing small maxima at 60 m and occasionally a second one
at 120 m. The maximum BP rate was 27.7 ng C L−1h−1.
IPPin situ ranged from 149 to 165 mg C m−2d−1, and IDCR
ranged from 103 to 173 mmole O2m−2d−1. IBP values were
also low (44 ± 5 mg C m−2d−1) and the three integrated
rates exhibited no trend with time.
3.4 Relationships between BP, PP, N2fix and TDIP
There are several limitations when comparing PPdeck and
PPin situ. Incubation on mooring lines for 24 h dawn to dawn is considered to be a good compromise by JGOFS recom-mendations (JGOFS, 1988), as conditions of temperature and light are close to in situ (except UV). Incubation on deck un-der simulated in situ conditions suffers from biases related to the use of artificial screens to mimic light attenuation with
0 1000 2000 3000 23/3/15 0:00 24/3/15 0:00 25/3/15 0:00 26/3/15 0:00 27/3/15 0:00 28/3/15 0:00 d1 23/03 d2 24/03 d3 25/03 d4 26/03 d5 27/03 0 50 100 150 200 0 5 10 15 20 25 30 BP (ngC l-1 h-1) d 1 d 2 d 3 d 4 d 5 0 50 100 150 200 0 1 2 3 4 PP (mgC m-3 d-1) d 1 d 3 d 5 Site LDC (P A R µ E m -2 s -1) P ressu re (d B a r) Dep th m I n v iv o f lu o re s c e n c e ( c o lo r) , isop y cna l line s ( w hi te) (a) (b) (c) (d)
Figure 7. Evolution of surface PAR (a), in vivo fluorescence and pycnoclines (b), PP (c) and BP (d) at site LDC. Time units in local time; day 1 was 23 March 2015. BP samples were taken at the 12:00 ctd cast, while samples for PPin situwere taken at the 03:00 ctd casts (days 1, 3 and 5). In graph (b) in vivo fluorescence is in color, isopy-cnes (kg m−3)are the white lines and vertical bars show the 12:00 ctd cast sampled for BP each day (1 to 5), with corresponding colors used for plotting BP vertical profiles in (d).
depth and also from biases related to temperature differences for deeper samples, as they are incubated at sea-surface tem-perature. During our cruise, at each LD site on day 5, we used both incubation methods, but unfortunately did not sample the same ctd cast: PPin situwas sampled at 03:00, while PPdeck was sampled at 09:00. At site LDA, differences between the
mean IPPin situand IPPdeck were particularly high. Besides
artifacts related to screens and temperature described above, this difference could also be due partly to internal waves. For instance, at site LDA on day 5, the dcm depth changed from 69 to 87 m between the 03:00 ctd cast and the 09:00 ctd cast. At site LDB, the bloom collapsed rapidly and a trend with time was clearly detected, making the comparison between both methods impossible, even with a time lag of only 6 h. For this reason, and to keep relative comparisons consistent,
we used only PPdeck data when exploring relationships
be-tween BP, PP, N2fix and TDIP.
Log–log relationships between BP and PPdeck presented
similar trends for all samples with TDIP values below or
above 100 h (Fig. 8a). Values below 50–100 h are representa-tive of a restricted access to DIP by microorganisms (Moutin et al., 2008). TDIPbelow 2 days was shown to be critical for
Trichodesmiumspp. growth (Moutin et al., 2005). The depth
at which this threshold was reached varied from surface to
Table 3. Results of multiple regressions log BP = f (log PP, log N2fix). The BP unit before log transformation is ng C L−1h−1. Y int is the intercept with the Y axis. Partial coefficient of regression (part coeff), t value (t ) and probability of the regression to be significant (p).
Units before log transformation mgC m−3d−1 nmole N L−1d−1
independent variables PP N2fix Yint n r
TDIP≤100 h part coeff ± SD 0.23 ± 0.11 0.38 ± 0.10 −0.56 36 0.589
t 2.04 3.82
(p) (0.02) (0.0002)
TDIP> 100 h part coeff ± SD 0.43 ± 0.08 0.09 ± 0.05 −0.47 51 0.66
t 4.91 1.82 (p) (< 0.0001) (ns) ns: not significant. -2,0 -1,5 -1,0 -0,5 0,0 0,5 1,0 -1,5 -0,5 0,5 1,5 2,5 log B P (m g C m -3 d -1) log PPdeck (mg C m-3 d-1) TDIP > 100 h TDIP < 100 h
(a)
(b)
-2,0 -1,5 -1,0 -0,5 0,0 0,5 1,0 -3 -2 -1 0 1 2 3 log B P (m g C m -3 d -1)log N2fix (nmole N l-1 d-1)
TDIP > 100 h TDIP < 100 h 1.0 0.5 0 -0.5 -1.0 -1.5 -2.0 1.0 0.5 0 -0.5 -1.0 -1.5 -2.0 -1.5 -0.5 0.5 1.5 2.5
Figure 8. Log–log relationships between volumetric rates of het-erotrophic prokaryotic production (BP) and primary production (PP, a) and between BP and nitrogen fixation rates (N2fix, b). Red and black dots show samples where TDIPwere < and > than 100 h, re-spectively. Lines are fitted Tessier model II regressions for data
clus-tering samples where TDIP values were greater (black lines) and
lower (red lines) than 100 h.
in the WGY. For samples where TDIPwas ≤ 100 and > 100 h,
log–log relationships were, respectively,
log BP = 0.842 log PP−0.57, n = 47, r = 0.26, p = 0.04 (3)
and
log BP = 0.808 log PP − 0.53, n = 90,
r =0.67, p < 0.001. (4)
In contrast, log–log relationships linking BP and N2fix pre-sented different trends for samples corresponding to depths
where TDIPwas below or above 100 h (Fig. 8b). For samples
where TDIPwas ≤ 100 h and > 100 h, relationships were, re-spectively,
log BP = 0.752 log N2fix − 0.78, n = 39, r = 0.52, p < 0.001 (5) and
log BP = 0.438 log N2fix − 0.31, n = 55, r = 0.43, p < 0.001. (6) This shows that BP was more correlated with N2fix than
with PPdeck in the P -depleted surface waters of the MA.
However, as PPdeck and N2fix could co-vary, a multiple
re-gression BP = f (PPdeck, N2fix) was tested (Table 3). The
partial coefficient was not significant for N2fix for samples with TDIP> 100 h. The partial coefficients were both
sig-nificant for N2fix and for PP for samples characterized by
TDIP≤100 h, but N2fix better explained the distribution of BP in the multiple regression analysis compared to PP (t -test, p = 0.024 for PP and p < 0.0001 for N2fix).
Integrated N2fix accounted for 3.3 to 81 % of the
bac-terial nitrogen demand along the transect, assuming a stoi-chiometric molar C / N ratio of 5 for heterotrophic prokary-otic biomass (Fig. 3b). Among the three LD sites, the vari-ability of this ratio was lower at sites LDA and LDC, with no particular temporal trend at any of these sites. The ratio ranged from 28 to 46 % at LDA, with a mean of 37 % ± 9 %, greater than that obtained at LDC (range 6– 10 %, mean ± SD 8 % ± 2 %). The ratio exhibited no partic-ular temporal trend, whereas a decrease was clearly observed at LDB, (68, 37 and 19 % on days 1, 3 and 5, respectively). This was due to a simultaneous decrease of N2fix rates (from
0.98 ± 0.058 mmole N m−2d−1 on day 1 to 0.758 ± 0.058
and 0.38 ± 0.019 mmole N m−2d−1on days 3 and 5,
mean contribution was 40 ± 20 % over all the transect, and including data from LD sites (n = 26 profiles).
We also examined relationships between TDIPand other
bi-ological fluxes using multiple regressions [logTDIP=f(log
PP, log N2fix, log BP)], incorporating 91 samples for which
the three rates were measured simultaneously (Table 4).
The partial coefficients were significant for both N2fix
(p < 0.0001) and BP (p = 0.003) but not for PP (p = 0.23). As all biological rates decreased with depth, we also exam-ined this correlation using data within the mixed layer to avoid the depth effect. With this restricted dataset (47 sam-ples) the partial coefficients were significant only for BP (p = 0.0024), just under the significance threshold for N2fix (p = 0.056) and still non-significant for PP.
3.5 DOC lability and BGE
In the three biodegradation experiments starting on day 1 at each LD site using sub-surface waters, BP increased sig-nificantly, with growth rates (determined from exponential
phase of BP increase) ranging from 0.08 to 0.14 h−1. DOC
was slightly consumed, with DOC concentrations decreasing only 2 to 5 % over 10 days, and with the lowest percentage of labile fraction being measured at site LDC (Table 5). Bacte-rial growth efficiencies were 13, 6.3 and 6.7 % at sites LDA, LDB and LDC, respectively (Table 5).
3.6 Enrichment experiments
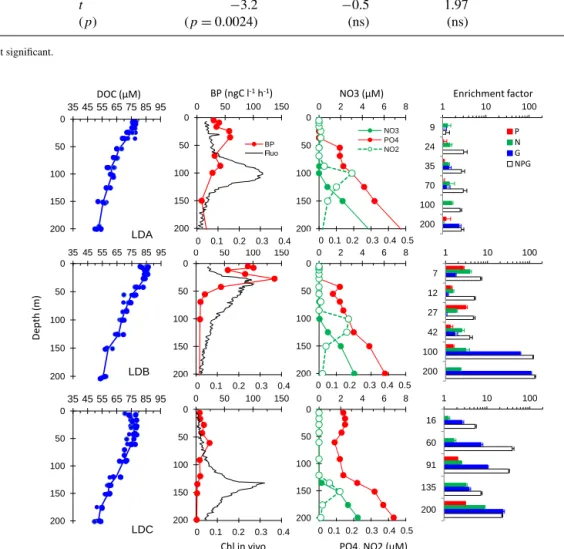
Conditions prevailing before enrichments are presented to-gether with enrichment factors obtained at the different depths tested as vertical distributions of in vivo fluorescence, nutrients and BP sampled from a CTD cast starting at 12:00 on day 2 of each LD site (Fig. 9). Nitrate concentrations were below the detection limits of standard methods in upper lay-ers. The depth of the nitracline varied with the dcm depth at LDA and LDC (100 m at LDA, 135 m at LDC), but not at LDB (a large peak of chlorophyll was observed within 20– 70 m with a nitracline at 100 m). Slight peaks of nitrite also occurred in the vicinity of the nitracline. Phosphate concen-trations exhibited more contrasted vertical profiles than did nitrate: DIP concentrations were greater than 100 nM in the surface layers of LDC, but presented a phosphacline shal-lower than the nitracline at LDA and LDB, with DIP reach-ing concentrations below the analytical detection limits in the mixed layer (i.e., < 50 nM; see Moutin et al., 2018, for more details on nutrient distribution). As DOC was not sampled on day 2, DOC data are presented for the whole site instead. DOC peaked near the surface at site LDA (77 ± 1 µM) and was more variable but higher near the surface at site LDB, with maximum values covering a larger surface layer down to 27 m, with average DOC of 84 ± 1 µM. Site LDC pre-sented a large sub-surface maximum within 28–42 m, reach-ing 77 ± 2 µM.
At site LDA, nitrogen was the first factor stimulating BP down to 100 m depth, which corresponded to the dcm depth and a nitrite regeneration layer. Although significant at 9, 24, 35 and 100 m in depth (Mann–Whitney test, p< 0.05), the re-sponse to N amendments was small, at best an enhancement factor of ×1.6. Glucose alone stimulated BP at 35 m, but only by a factor of ×1.4. However, below the euphotic zone, glu-cose was the first factor stimulating BP (enhancement factor
×2.4 at 200 m). NPG additions produced the largest increase
in BP (×2.5–×3.0) along the profile, except at 9 m were NPG amendments did not significantly affect BP compared to the control.
At site LDB, between the surface and 42 m, both nitro-gen alone and phosphate alone stimulated BP to a larger extent than at site LDA, but only by a factor ×1.5–3 for P, and ×1.8–3.7 for N. At 100 and 200 m, nitrogen contin-ued to stimulate BP to a small extent (×3.0 and ×2.2, re-spectively), but the maximum enhancement was obtained af-ter glucose addition alone (×59 and ×107, respectively). At these depths, the BP response after addition of NPG was also largely amplified compared to shallower layers (×120–132 compared to ×3.7–6.8, respectively).
At site LDC, BP reacted mostly to glucose alone, with en-hancement factors increasing from ×2.6 at 16 m to ×24 at 200 m. Nitrogen alone also stimulated BP, but to a smaller extent than glucose, even within surface layers (×1.2 to ×9). In comparison to single amendments, the NPG addition par-ticularly stimulated BP at 60 and 90 m depth.
4 Discussion
4.1 An overview of BP and PP fluxes in the WTSP
Here, we provide a unique, coherent dataset with
simultane-ous estimates of PP, BP, TDIP and N2fix rates in the WTSP.
Although recent interest has increased in describing fluxes and planktonic communities responsible for N2fix rates in di-verse environments, particularly in oligotrophic open oceans, measurements in the tropical area of the South Pacific Ocean are rare (summarized in Gruber et al., 2016, and more re-cently in Bonnet et al., 2017). Moreover, few studies have attempted to simultaneously study the consequences of such activities on the functioning of the microbial food webs.
Stations in the western part of the transect along the Melanesian Archipelago (MA) generally displayed greater fluxes of PP, BP and N2fix rates than those in the WGY area, with a large degree of longitudinal variability. This was
mir-rored by TDIP variability spanning 2 orders of magnitude in
the upper 40 m layers within MA (2 to 700 h, Fig. 4). The role of the submesoscale activity largely explained such vari-abilities in biogeochemical parameters and fluxes (Rousselet et al., 2018).
Previous in situ measurements of primary production in the tropical South Pacific, not directly focusing on coastal
ar-Table 4. Results of multiple regressions log TDIP=f (log BP, log PP, log N2fix). The unit of TDIPbefore log transformation is h. Y int is the intercept with the Y axis. Partial coefficient of regression (part coeff), t value (t ) and probability of the regression to be significant (p).
Units before log transformation ngC L−1h−1 nmol N L−1d−1 mgC m−3d−1
independent variables BP N2fix PP Y int n r
All data part coeff ± SD −1.06 ± 0.2 −0.23 ± 0.07 −0.18 ± 0.15 3.82 91 0.81
t −5.2 −3.1 −1.2
(p) (p< 0.0001) (p = 0.0027) (ns)
Depth ≤ 20 m part coeff ± SD −1.11 ± 0.34 −0.07 ± 0.13 0.54 ± 0.27 3.88 47 0.76
t −3.2 −0.5 1.97 (p) (p = 0.0024) (ns) (ns) ns: not significant. 0,0 0,1 0,2 0,3 0,4 0,5 0 50 100 150 200 0 2 4 6 8 0,0 0,1 0,2 0,3 0,4 0,5 0 50 100 150 200 0 2 4 6 8 0,0 0,1 0,2 0,3 0,4 0,5 0 50 100 150 200 0 2 4 6 8 NO3 PO4 NO2 0,0 0,1 0,2 0,3 0,4 0 50 100 150 200 0 50 100 150 0,0 0,1 0,2 0,3 0,4 0 50 100 150 200 0 50 100 150 1 10 100 9 24 35 70 100 200 P N G NPG 1 10 100 7 12 27 42 100 200 1 10 100 16 60 91 135 200 0,0 0,1 0,2 0,3 0,4 0 50 100 150 200 0 50 100 150 BP Fl luo 0 50 100 150 200 35 45 55 65 75 85 95 LDA 0 50 100 150 200 35 45 55 65 75 85 95 LDB 0 50 100 150 200 35 45 55 65 75 85 95 LDC
DOC (µM) BP (ngC l-1 h-1) NO3 (µM) Enrichment factor
Chl in vivo PO4, NO2 (µM)
De p th (m ) 0 0.1 0.2 0.3 0.4 0 0.1 0.2 0.3 0.4 0 0.1 0.2 0.3 0.4 0 0.1 0.2 0.3 0.4 0.5 0 0.1 0.2 0.3 0.4 0.5 0 0.1 0.2 0.3 0.4 0.5
Figure 9. Enrichment experiments. Initial conditions illustrated by vertical profiles (0–200 m) of in vivo fluorescence, BP, nutrients (nitrate (NO3), nitrite (NO2), and phosphate (DIP)) and enrichment factors sampled from the 12:00 ctd cast on day 2 of occupation at each LD site. As DOC was not sampled on this cast, we showed the data from all the other casts at the corresponding LD site (circles) and the average profile (line). Enrichment factors are the ratio of BP after a given enrichment (DIP: P in red; nitrate + ammonium: N in green; glucose: G in blue; and all components: NPG in black) compared to the unamended control, both measured after 24 h incubations. The error bar is standard deviation within triplicates, and a bar is shown only if BP is significantly greater than in the control (Mann–Whitney test, p < 0.05).
eas or within upwelling areas in the east, are scarce (Table 1). These daily particulate primary production rates, based on the14C or13C technique, confirm the trend that we observed in the WTSP, i.e., extremely low values in the central GY
area ranging from 8 to 167 mg C m−2d−1. PP increased in
the periphery of the GY, but rates remained typical of
olig-otrophic to mesolig-otrophic conditions, in the eastern region of the GY, in the south of the GY, and in the western part of the WTSP around New Caledonia and between New Caledonia and Australia (Table 1). Further northwest, in the Solomon Sea, PP increased to much greater values in an area of
Table 5. Results of biodegradation experiments. Growth rates determined from BP data, degradation rates computed from DOC data and BGE computed from Eq. (1).
LDA LDB LDC
growth rates ± SE (h−1) 0.33 ± 0.05 0.08 ± 0.02 0.14 ± 0.02
degradation rates ± SE (d−1) 0.039 ± 0.002 0.07 ± 0.007 0.012 ± 0.003
initial DOC stock (µM) 83 83 75
% labile DOC 5.3 5 2.4
BGE (%) 12.9 6.3 6.7
However, although an increasing number of PP and N2fix values are available in the WTSP and within the GY, the only other BP data available in these regions, to our knowledge, are those estimated during the BIOSOPE cruise (Novem-ber/December 2004), along a longitudinal transect further east between Tahiti and Chile (Van Wambeke et al., 2008b). The authors measured BP integrated across the euphotic zone
ranging from 86 to 144 mg C m−2d−1within the Marquesas
Archipelago area, from 43 to 114 mg C m−2d−1 within the
center of the GY and from 57 to 93 mg C m−2d−1within the
eastern part of the GY. Therefore, in the WTSP we encoun-tered the same range of BP values as in the GY area east of 140◦W.
4.2 BGE and metabolic state
Although the metabolic state of oligotrophic oceans is still controversial (Duarte et al., 2013; Ducklow and Donney, 2013; Williams et al., 2013; Serret et al., 2015; Letscher et al., 2017), a consensus emerges that in vitro estimates (involving O2 derived rates or labelling with18O2,13C, or
14C isotopes) tend to show net heterotrophy in oligotrophic
environments. This is indeed what we obtained here, with negative Net Community Production (NCP) values at the three sites LDA, LDB and LDC (−97 to −198, −73 to
−134, and −61 to −141 mmole O2m−2d−1, respectively,
Dominique Lefevre, personal communication, 2018). In the WTSP, negative NCP were also obtained in the oligotrophic waters offshore of New Caledonia (Pringault et al., 2007). However, in vitro technique estimates suffer from many bi-ases related to reproducibility, bottle effects, type of flasks used (selecting light wavelengths), condition of incubations and handling artifacts, and a lack of high-frequency mea-surements (Aranguren-Gassis et al., 2012a, b). For exam-ple, following the same water mass during 5 days, a sub-stantial temporal variation in NCP by nearly 2-fold was ob-served at the LDA, LDB and LDC sites. In contrast, in situ based estimates, based on observations of mixed-layer net
oxygen exchanges (O2/Ar technique), tend to favor slight
net autotrophy (Williams et al., 2013). However, these re-sults also suffer from biases related to the estimate of the mixed layer depth considered and the diffusive coefficients used for gases. Another approach based on the use of oxy-gen sensors in Argo floats recently showed annual NCP close
to zero in the South Pacific Ocean (Yang et al., 2017). Re-cent models encompassing all seasons and a large areal basis find the global ocean to be net autotrophic, including all five oligotrophic subtropical gyres (Letscher et al., 2017). Esti-mating the metabolic balance by comparing different meth-ods is thus of great interest but rare, especially in the South Pacific. For instance, in the center of the GY, between the Polynesian Archipelago and Easter Island, net heterotrophy was also obtained (although not statistically different from
zero) using the in vitro O2technique (Van Wambeke et al.,
2008b), whereas a non-intrusive bio-optical method showed metabolic balance (Claustre et al., 2008a).
Simultaneous estimates of PP, BP and N2fix rates are al-most absent in oligotrophic waters and to date, BP has not been measured in the WTSP. Here we analyse the contribu-tion of primary produccontribu-tion to bacterial carbon demand by comparing separate estimates from the WTSP using our C-based discrete biological fluxes. The ratio of bacterial car-bon demand (BCD) to gross primary production (GPP) is presented as an index of the coupling between primary pro-ducers and heterotrophic bacteria and of metabolic balance (Hoppe et al 2002; Fouilland and Mostajir, 2010): to sustain heterotrophy when BCD exceeds GPP, populations can be temporally non-synchronous and/or allochthonous sources of DOM may be required.
It is known that the in vitro14C method measures an
in-termediate state between net PP and GPP. However, Moutin et al. (1999) showed that GPP could be reasonably esti-mated from daily net PP determined from dawn-to-dawn as GPP = 1.72 × PP. On the other hand, dealing with the assumptions made to convert hourly leucine incorporation rates to daily BCD, there are many biases that have been largely debated, primarily those resulting from daily variabil-ity, assumptions about BGE or BR (Alonzo-Saez et al., 2007; Aranguren-Gassis et al., 2012b), carbon to leucine conver-sion factors (Alonso-Saez et al., 2010), and light conditions of incubations including UV (Ruiz-Gonzales et al., 2013). In this study, we provide direct and indirect estimation of BGE to discuss its variability. Daily variability will also be taken into account using results from previous experiments in the South Pacific Gyre (BIOSOPE cruise, Van Wambeke et al., 2008). Finally, we will also discuss one largely unexplored
bias, related to the ability of Prochlorococcus to assimilate leucine in the dark.
Bacterial growth efficiencies (BGE) obtained from biodegradation experiments ranged from 6 to 12 %, with a small labile fraction of DOC (only 2–5 % of biodegradable DOC in 10 days). Thus, the bulk DOC was mainly refrac-tory, although DOC concentration was high in the surface (Moutin et al., 2018). Large stocks of DOC, with C / N ra-tios ranging from 16 to 23, have also been reported in the surface waters of the SPG (Raimbault et al., 2008). Both high C / N ratios and a small labile fraction suggests that this sur-face bulk pool of DOC is probably largely recalcitrant due to UV photodegradation or photooxidation (Keil and Kirch-man, 1994; Tranvik and Stephan, 1998; Carlson and Hansel, 2015) or by action of the microbial carbon pump (Jiao et al., 2010). Small BGE and small labile fraction could also be due to strong resource dependence as low nutrient concentrations cause low primary production rates and low transfer across food webs. Indeed, Letscher et al. (2015) also observed sur-face DOC recalcitrant to remineralization in the oligotrophic part of the eastern tropical South Pacific. But as shown by these authors, incubation with microbial communities from the twilight zone, provided by addition of an inoculum con-centrated in a small volume, allowed DOC remineralization. This was explained by relief from micronutrient limitation or by the co-metabolism of relatively labile DOC provided by the inoculum with more recalcitrant DOC. Results from our enrichment experiments effectively suggest nutrient limita-tion, although the second hypothesis cannot be excluded.
In order to better explain the variability of BGE mea-surements, we also estimated this parameter indirectly, us-ing simultaneously measured dark community respiration (DCR) and BP data. We converted DCR to carbon units assuming a respiratory quotient RQ = 0.9, and computed BGE from Ze-integrated BP and DCR assuming either bac-terial respiration (BR) to be within a range of 30 % of DCR (BGE = BP / (BP + DCR × 0.9 × 30 %), Rivkin and Legen-dre, 2001; del Giorgio and Duarte, 2002) or 80 % of DCR (BGE = BP / (BP + DCR × 0.9 × 80 %), Lemée et al., 2002; Aranguren-Gassis et al., 2012b). These indirect estimates of BGE ranges were similar to those obtained from the biodegradation experiments: 3–12 % at site LDA, 4–17 % at site LDB and 2–7 % at site LDC. Note, however, an increas-ing trend from day 1 to day 5 at site LDB: on average 8 % on day 1, 10 % on day 3 and 12 % on day 5. Including all direct and indirect estimates, the mean (±SD) BGE was 8 ± 4 % (n = 21).
Although bias introduced when converting hourly to daily BP rates was not studied here, we used a dataset obtained in the South Pacific Gyre (Van Wambeke et al., 2008) to esti-mate conversion errors. During the BIOSOPE cruise, verti-cal profiles of BP were acquired every 3 up to 72 h, using the leucine technique within the euphotic zone at three selected sites using a Lagrangian sampling strategy. For the three se-ries of profiles, standard deviations of BPI with time were
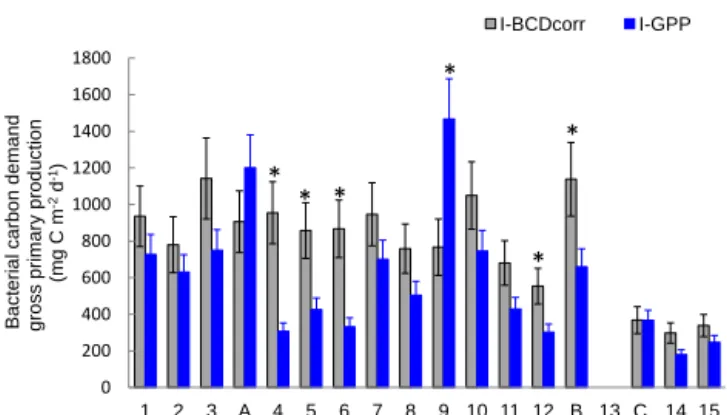
0 200 400 600 800 1000 1200 1400 1600 1800 1 2 3 A 4 5 6 7 8 9 10 11 12 B 13 C 14 15 Ba c te ri a l c a rb o n d e m a n d gr o s s p ri m a ry p ro d u c ti o n (m g C m -2 d -1) I-BCDcorr I-GPP * * * * * *
Figure 10. Distribution of integrated bacterial carbon demand
cor-rected for Prochlorococcus assimilation (I-BCDcorr, grey bars)
gross primary production derived from IPPdeck(I-GPP, blue bars),
along the transect. Error bars are standard errors (SE), calculated using propagation of errors. We included analytical SE (triplicate measurement at each depth for PP and BP), SE due to daily BP variability, SE from BGE, and SE due to leucine assimilation by
Prochlorococcus. ∗Shows stations in which BCDcorr minus
I-GPP was statistically different from zero.
13 % (n = 13), 16 % (n = 16) and 19 % (n = 9). Thus, stan-dard errors represented 3.6, 4.2 and 6.1 % of the mean BPI, respectively. We used the average value of this percentage (5 %) to estimate the bias introduced by the conversion from hourly to daily BPI estimates of the OUPACE cruise.
Finally, we considered the ability of Prochlorococcus to assimilate leucine in the dark. Using flow cytometry
cell sorting of samples labelled with3H-leucine during the
OUTPACE cruise, Duhamel et al. (2018) demonstrated the mixotrophic capacity of Prochloroccoccus, as this phyto-plankton group was able to incorporate leucine, even un-der dark conditions, albeit at lower rates than unun-der light conditions. This group was found to be able to assimilate ATP, leucine, methionine and glucose, a single C-containing molecule (Duhamel et al., 2018, and references therein). To date, few organic molecules have been tested, and those mainly include N, P or S sources. As leucine assimilation by Prochloroccoccus was significantly detected in dark in-cubations in all examined samples, it will affect BP
mea-surements. We thus corrected BP (BPcorr)to represent the
assimilation of leucine in the dark by heterotrophic bacte-ria alone. Based on Duhamel et al. (2018), leucine assimi-lation by HNA + LNA bacteria in the dark corresponded on average (±SD) to 76 ± 21 % (n = 5, range 44–100 %) of the activity determined for the community including
Prochloro-coccus(HNA + LNA + Proc). I-BCDcorrwas then calculated
and its distribution presented with I-GPP (Fig. 10), assuming a mean 8 % for BGE in all our integrated data. Among 14
stations over the 17 presented the mean integrated I-BCDcorr
is greater than I-GPP. We tested whether the confidence
in-terval 95 % of the difference I-BCDcorr minus I-GPP is