HAL Id: hal-03000314
https://hal.archives-ouvertes.fr/hal-03000314
Submitted on 11 Nov 2020HAL is a multi-disciplinary open access
archive for the deposit and dissemination of sci-entific research documents, whether they are pub-lished or not. The documents may come from teaching and research institutions in France or abroad, or from public or private research centers.
L’archive ouverte pluridisciplinaire HAL, est destinée au dépôt et à la diffusion de documents scientifiques de niveau recherche, publiés ou non, émanant des établissements d’enseignement et de recherche français ou étrangers, des laboratoires publics ou privés.
across space
Isabelle Gounand, Eric Harvey, Pravin Ganesanandamoorthy, Florian
Altermatt
To cite this version:
Isabelle Gounand, Eric Harvey, Pravin Ganesanandamoorthy, Florian Altermatt. Subsidies medi-ate interactions between communities across space. Oikos, Nordic Ecological Society, 2017, 126 (7), pp.972-979. �10.1111/oik.03922�. �hal-03000314�
Title: Subsidies mediate interactions between communities across space. 1
Authors: Isabelle Gounand*1,2, Eric Harvey1,2, Pravin Ganesanandamoorthy2, Florian
2
Altermatt1,2
3 4
Type of Article: Research paper 5
6
*Corresponding author: 7
Isabelle Gounand: [email protected]; ORCID: 0000-0002-0675-3973 8 9 E-mails: 10 EH [email protected]; ORCID: 0000-0002-8601-7326 11 PG [email protected]; 12 FA [email protected]; ORCID: 0000-0002-4831-6958 13 14 Affiliations 15
1Department of Evolutionary Biology and Environmental Studies, University of Zurich,
16
Winterthurerstrasse 190, CH-8057 Zürich, Switzerland. 17
2Eawag, Swiss Federal Institute of Aquatic Science and Technology, Department of
18
Aquatic Ecology, Überlandstrasse 133, CH-8600 Dübendorf, Switzerland. 19
Abstract
21Most spatial ecology focuses on how species dispersal affects community 22
dynamics and coexistence. Ecosystems, however, are also commonly connected by 23
flows of resources. We experimentally tested how neighbouring communities indirectly 24
influence each other in absence of dispersal, via resource exchanges. Using two-patch 25
microcosm meta-ecosystems, we manipulated community composition and dynamics, 26
by varying separately species key functional traits (autotroph versus heterotroph species 27
and size of consumer species) and trophic structure of aquatic communities (species 28
growing alone, or in presence of competitors or predators). We then analysed the effects 29
of species functional traits and trophic structure on communities connected through 30
spatial subsidies in the absence of actual dispersal. Both functional traits and trophic 31
structure strongly affected dynamics across neighbouring communities. Heterotroph 32
communities connected to autotroph neighbours developed better than with heterotroph 33
neighbours, such that coexistence of competitors was determined by the functional traits 34
of the neighbouring community. Densities in autotroph communities were also strikingly 35
higher when receiving subsidies from heterotroph communities compared to their own 36
subsidies when grown in isolated ecosystems. In contrast, communities connected to 37
predator-dominated ecosystems collapsed, without any direct contact with the predators. 38
Our results demonstrate that because community composition and structure modify the 39
distribution of biomass within a community, they may also affect communities connected 40
through subsidies through quantitative and qualitative changes of detritus flows. This 41
stresses that ecosystem management should account for such interdependencies 42
mediated by spatial subsidies, given that local community alterations cascade across 43
space onto other ecosystems even if species dispersal is completely absent. 44
Introduction
46Spatial flows between ecosystems are ubiquitous in nature. Research on spatial 47
ecology and meta-community dynamics demonstrated the fundamental role of dispersal 48
for species coexistence and biodiversity at local and regional scales (Mouquet and 49
Loreau 2002, Leibold et al. 2004, Holyoak et al. 2005, Seymour et al. 2015). In parallel, 50
ecosystem ecology and ecosystem-level studies have shown that spatial flows of 51
resources are also fundamental drivers of community dynamics (Polis et al. 1997, 2004, 52
Harvey et al. 2016). In natural ecosystems, many communities have a net heterotrophic 53
functioning and productivity relies on subsidies coming from neighbouring ecosystems. 54
For instance benthic marine- or freshwater-systems rely on detritus inputs sinking from 55
pelagic waters (Fitzgerald and Gardner 1993, Schindler and Scheuerell 2002), and at 56
aquatic-terrestrial boundaries, ecosystems experience strong bi-directional resource-57
exchanges, with riverine vegetation subsidizing river or lake communities with dead-58
organic matter (Hall et al. 2000, Cole and Caraco 2001, Richardson et al. 2010), while 59
riparian systems benefit from nitrogen-rich inputs of emergent aquatic insects (Baxter et 60
al. 2005, Gratton and Vander Zanden 2009, Dreyer et al. 2015), or fish carcasses 61
(Hocking and Reimchen 2009). The quantification of these resource spatial flows 62
(thereafter called subsidies), and the recognition of their importance for local community 63
dynamics by meta-community ecology, eventually led to a formal integration of 64
community and ecosystem perspectives on spatial flows within the meta-ecosystem 65
framework, accounting for both organism dispersal and resource exchanges between 66
ecosystems (Loreau et al. 2003, Massol et al. 2011, Massol et al. in review). 67
Previous studies on allochthonous subsidies generally investigated subsidy 68
effects on recipient communities from a donor-controlled perspective, thus without 69
consideration of the reciprocal effects on both connected ecosystems (e.g. Cole et al. 70
2006). Reframed into a spatial perspective, however, subsidies could be considered as 71
a vector of indirect interactions between community dynamics, with donor community 72
dynamics modulating the quantity and quality of exported resources. Both composition 73
(species traits) and structure (trophic interactions) of communities control the quantity 74
and quality of detritus locally produced, and potentially exported to other ecosystems as 75
subsidies. On the one hand, the population dynamics and life cycles of the species 76
composing a community determine the amount of detritus produced locally (e.g. subsidy 77
pulses triggered by 17-year emergence cycles of cicadas reported by Menninger et al. 78
2008). On the other hand, species functional traits determine detritus quality via their 79
stoichiometry (Sitters et al. 2015). Indeed, key species functional traits such as 80
autotrophy translate into carbon-nutrient ratios biased toward high values due to their 81
carbon-fixing photosynthesis activities, compared to the content of heterotrophic species 82
(see Sterner and Elser 2002, Sterner 2009 for cross-taxon comparisons). Through a 83
direct effect on the stoichiometric balance and the degradability of building block 84
molecules, community composition modulates not only detritus composition, but also the 85
rate at which detritus is made available as a new resource for subsidized communities 86
(Enriquez et al. 1993, Scott and Binkley 1997, Allison 2012), such as plant litter 87
composition driving decomposition rates in forest and stream ecosystems worldwide 88
(Cornwell et al. 2008, García-Palacios et al. 2015). 89
Community structure and the strength of species interactions within a community 90
should also affect the quantity and quality of detritus by modulating the biomass 91
distribution across trophic levels (Shurin et al. 2006). Empirical studies, for instance, 92
showed that in a wide range of ecosystems, changes in one trophic level induce trophic 93
cascades over an entire food web, which leads to drastic changes in biomass 94
distributions (Schmitz et al. 2000, Carpenter et al. 2001, Jackson et al. 2001, Frank et al. 95
2005). Beyond the traditional focus on species loss and local productivity change, the 96
spatial consequences for subsidy-connected ecosystems of these structural changes 97
and the subsequent modified detritus production have still to be investigated. 98
Overall the tight link between community composition and dynamics, and local 99
detritus production triggers an indirect connection between communities connected by 100
subsidy exchanges: the recipient community fed by subsidies becomes indirectly linked 101
to the donor community dynamics through the qualitative and quantitative characteristics 102
of the exported resources. Such subsidy linkages between ecosystems imply that local 103
community composition and structure may matter for the functioning of neighbouring 104
communities even in the absence of species’ dispersal. This hypothesis has 105
fundamental implications for the functioning of connected ecosystems and for their 106
response to anthropogenic pressure, since it postulates the spatial spread of local 107
perturbations. Any event that would modify local community composition and dynamics, 108
such as biological invasions, is susceptible to pass on neighbouring community 109
dynamics through subsidy disruption even if species dispersal cannot occur (e.g. Baxter 110
et al. 2004). 111
Here we propose a test of such indirect “neighbour effects” with experimental 112
microcosm meta-ecosystems. We used aquatic microbial communities consisting of 113
bacteria feeding on organic resources, various autotroph and bacterivorous protists, and 114
a top predator. The microcosms were mimicking a wide range of natural ecosystems, 115
from heterotrophic, such as in stream or benthic waters, to autotrophic, such as forests 116
or pelagic phytoplankton-based ecosystems, and from resource to predator dominated. 117
We built two-patch meta-ecosystems connecting ecosystems only by spatial subsidies 118
(spatial flows of detritus and inorganic resources, and no organisms dispersing). In one 119
ecosystem we manipulated species traits (autotroph versus heterotroph species and 120
consumer body size), while in the other ecosystem we manipulated community structure 121
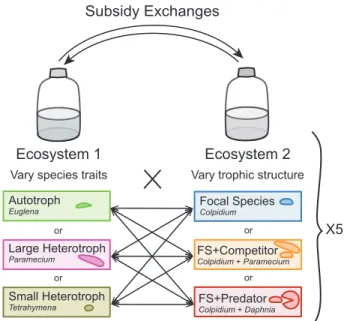
by adding a competitor or a predator (see Fig. 1). We followed temporal changes in 122
community dynamics (i.e., species density and biomass) in each ecosystem, and then 123
compared the dynamics between connected and isolated ecosystems to test if 124
communities with different structure and composition could affect each other only 125
through subsidy exchanges. Specifically we asked whether autotroph versus 126
heterotroph community dynamics could have differential impacts on neighbours, and 127
whether the addition of a species inducing novel trophic interactions (e.g. competition or 128
predation) could affect neighbour dynamics in the absence of organism dispersal. 129
Methods
131Experimental design
132
To test the indirect influence of community composition on one another via cross-133
ecosystem subsidies, we performed a two-patch meta-ecosystem experiment with 134
protists growing in microcosm ecosystems solely connected by subsidies (spatial flows 135
of detritus). We varied species traits in Ecosystem 1 and trophic structure in Ecosystem 136
2 according to a factorial design (Fig. 1). In Ecosystem 1 we grew one of these three 137
species with contrasting traits alone (monocultures): the autotroph flagellate Euglena 138
gracilis (∼35 µm), a large bacterivorous ciliate (Paramecium aurelia, ∼96 µm), or a small 139
bacterivorous ciliate (Tetrahymena pyriformis, ∼30 µm). In Ecosystem 2, our focal 140
species, Colpidium striatum, a small bacterivorous ciliate (∼45 µm) was grown alone, or 141
either with Paramecium aurelia as a competitor, or was submitted to predation by the 142
generalist filter feeding waterflea Daphnia magna (∼0.5 to 2 mm). Treatments are 143
hereafter called “Autotroph”, “Large heterotroph” and “Small heterotroph” in Ecosystem 144
1 and “Focal Species” (FS), “FS+Competitor”, “FS+Predator” in Ecosystem 2. We 145
connected Ecosystem 1 and Ecosystem 2 only by subsidy exchanges (detritus, 146
including inorganic resources present in the growing medium), and prohibited any type 147
of species dispersal. We had a five-fold replication of the nine meta-ecosystem types (all 148
possible combinations of Ecosystems 1 and 2), as well as the control ecosystems 149
without diffusion, resulting in an experiment consisting of 45 independent 2-patch meta-150
ecosystems and 30 isolated 1-patch ecosystems (120 microcosms). 151
Experiment setup
153
Ecosystems were assembled in microcosms of 250 mL Schott bottles filled with 100 mL 154
culture medium. All organisms (bacteria, protists, and waterfleas) used in the experiment 155
were grown in pre-autoclaved protist pellet suspension filtered through Whatman filters 156
(0.31 g protist pellets 1 L–1 tap water; Protist pellets from Carolina Biological Supply,
157
Burlington NC, USA). Microcosms were assembled with 75 ml protist medium, 5 mL of 158
bacterial culture (Serratia fonticola, Bacillus subtilis and Brevibacillus brevis; added one 159
day prior to protist addition), and completed with 20 mL of protist culture at carrying 160
capacity (10 mL per species in the competition treatment). For the predation treatment, 161
we added four equal-sized juvenile Daphnia magna to each microcosm. More details on 162
protist culture and experimental procedures are found in Altermatt et al. (2015). 163
Microcosms were randomized within the 5 replicate blocks, and the experiment took 164
place at 20 °C and constant lighting. We replaced all Daphnia that died within the first 165
six days due to initial conditions (i.e., insufficient oxygen-levels in the freshly autoclaved 166 medium). 167 168
Diffusion
169Ecosystem 1 and 2 were connected by bi-weekly reciprocal subsidy exchanges. 170
These spatial flow events consisted in sampling 30 mL from each ecosystem, 171
microwaving these samples for 100 seconds, until they reached a full boil, to turn all 172
living biomass into detritus, and then adding it into the respective connected ecosystem 173
after a cooling period of two hours at ambient temperature (20 °C). This diffusion 174
method mimics detritus flows associated with recurrent perturbation-induced mortality. 175
Isolated controls were also submitted to the same perturbations, but the microwaved 176
samples were added back in the microcosm of origin to isolate the diffusion effects from 177
perturbation-induced mortality. 178
179
Samplings and measurements
180
In parallel, we tracked changes in community dynamics in each microcosm during 181
one month. We measured population densities every Tuesday and Friday (i.e., twice a 182
week), leaving as much time as possible for protist growth after each diffusion event 183
(occurring on Wednesdays and Saturdays). At each measurement point we took two 0.5 184
mL samples per microcosm, one to measure protist density by video analysis, the other 185
to measure bacterial dynamics by flow cytometry. The volumes sampled were 186
considered sufficiently small to not affect local dynamics (Altermatt et al. 2011) and thus 187
did not need to be replaced by fresh medium. We recorded one 5 s-video per sample 188
following a standardized video procedure (Pennekamp and Schtickzelle 2013, Altermatt 189
et al. 2015). From each video we extracted densities of moving individuals along with 190
morphometric and movement information, such as cell size and speed. This was 191
achieved using the R-package bemovi (Pennekamp et al. 2015) coupled to the image 192
analysis free-ware ImageJ (ImageJ, National Institute of Health, USA). The additional 193
traits measured served to discriminate species identity in mixtures (competition 194
treatment), provided as inputs to trait distance analysis with the svm algorithm (e1071 R-195
package Meyer et al. 2014), and to calculate bio-areas as a proxy for biomass. Since 196
automated particle detection relies on movement, the method systematically 197
underestimated densities of Euglena gracilis, which is much less mobile than the other 198
species. Therefore, we complemented density estimates of this species with visual 199
counts from the videos. To exclude false positives, we also performed a visual check of 200
all videos where a protist species had less than 3 individuals per frame. We counted 201
Daphnia individuals visually. Finally, we measured the total abundance of the 3-species 202
bacterial community on a flow cytometer (BD AccuriTM C6 cell counter) on SYBR green
203
fixed samples (dilution x1000), following a standard protocol (Altermatt et al. 2015). 204
205
Analyses
206
We characterized the indirect effects of neighbouring communities on each other 207
through subsidy flows using log response-ratios of protist densities at each time point, 208
for the different neighbour treatments (either species traits or trophic structure) in the 209
connected ecosystem, with 95% confidence intervals (CI). The responses were tested 210
relative to controls without diffusion, such that CIs not comprising zero reveal significant 211
effects of diffusion, while none overlapping CIs between neighbour treatments reveal a 212
significant neighbour effect. We tested the effects of trophic structure on neighbour 213
community dynamics by comparing the density of species in Ecosystem 1 (each 214
monoculture) when connected to different communities driven by specific interactions in 215
Ecosystem 2 (i.e. FS, FS+Competitor, FS+Predator). Conversely, we tested the effects 216
of functional traits on neighbour community dynamics by comparing the density of our 217
focal species, Colpidium striatum, in Ecosystem 2 when connected to different species 218
population with specific functional traits in Ecosystem 1 (i.e. Autotroph, Large 219
heterotroph, Small heterotroph). We studied the potential interaction with time by 220
running generalized linear models (GLM) on log response-ratios with species traits or 221
trophic interaction in the connected ecosystem and time as explanatory variables. We 222
used Gaussian distributions as link functions to avoid overestimation of positive effects 223
due to the ratio (Berlow et al. 1999). The effect of species traits in Ecosystem 1 on 224
competitive outcome in Ecosystem 2 was also tested with a GLM on the density of 225
Colpidium relative to Paramecium (using the relative proportion), with species traits in 226
the connected ecosystem and time as explanatory variables. For each GLM, the level of 227
significance and the effect size of each factor, and their interactions, were assessed 228
using a standard F test (Type II analysis of deviance). For each significant term of 229
interest we ran post-hoc pairwise comparisons (with Tukey adjusted p-values) to 230
evaluate specific contrast among variables. When time was not significantly affecting the 231
terms of interest we performed the post-hoc analysis on simplified GLM sub-models 232
(without the effect of time) in order to avoid unnecessary inflations of time II error 233
(Nakagawa 2004). 234
Lastly, because neighbour effects can originate from changes in both subsidy 235
quantity and quality, we examined approximated biomass (bio-areas) at the different 236
trophic levels (bacteria, protist, predator) according to community characteristics 237
(species traits or trophic structure) to bring an element of interpretation, assuming that 238
the different trophic levels produce different qualities of detritus. For bacteria we took a 239
constant mean individual area of 1 µm², assuming no significant change of size over the 240
experiment (bio area = 1 µm² * cell counts). For protists, we measured mean individual’s 241
area directly from the video analysis, and extrapolated it to the total population 242
(Pennekamp et al. 2015). Bio-area of Daphnia was estimated visually based on four size 243
classes. To test protist and bacteria bio-area differences among communities along time 244
we ran four different GLM with either species traits (Ecosystem 1) or trophic structure 245
(Ecosystem 2) and time as explanatory variables. We studied residual distributions to 246
select the most appropriate link function (Gamma or Gaussian). All analyses were 247
conducted with R 3.1.2 (R Development Core team, 2014), using the ‘car’ package (Fox 248
and Weisberg 2011) for type II analysis of deviance, and the ‘lsmeans’ package for post 249
hoc pairwise comparisons (Lenth 2013). 250
Results
251Subsidy-mediated effects on population density
252
Both local community functional traits (autotrophy versus heterotrophy) and 253
trophic structure induced strong significant effects on connected communities via 254
subsidy exchanges and in the absence of dispersal (see Supplementary material 255
Appendix 1 Table A1 and Appendix 2 Table A2). At the end of the experiment, 256
population densities of our focal species in Ecosystem 2 were significantly higher when 257
connected to autotroph compared to heterotroph communities (F2,60 = 39.40, p<0.0001
258
in Focal Species and FS+Competitor treatments (see Supplementary material Appendix 259
1 Table A1, and Appendix 5 Table A5 for post-hoc multiple comparisons) or compared 260
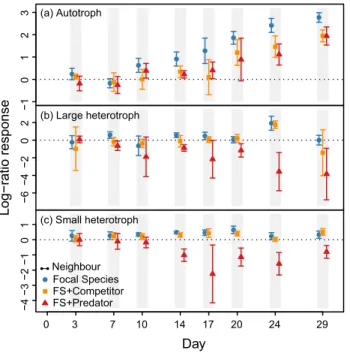
to isolated communities (Fig. 2, panels a and b). The only exception was in the 261
FS+Predator treatment where predation resulted in the extinction of the focal species 262
irrespective of functional traits in the connected community (Fig. 2c). Predators drove 263
protist to extinction and concentrated all the biomass in their body, which cascaded on 264
detritus quality and negatively affected population density in subsidy-connected 265
communities in Ecosystem 1 compared to the focal species grown alone (FS) (Fig. 3, 266
p<0.0001 for the factor “trophic structure” on each community; see Supplementary 267
material Appendix 1 Table A2 for the GLM and Appendix 5 Tables A5 for post-hoc 268
multiple comparisons). Moreover, the benefit (or not) of being a connected versus an 269
isolated community depended on species functional traits. Some species were relatively 270
insensitive to spatial subsidies when connected to FS or FS+Competitor communities 271
(e.g. Large heterotroph, Fig. 3b). In contrast, the autotroph did always far better when 272
connected to heterotroph communities, regardless of the trophic structure, compared to 273
isolated autotroph communities, which received only their own autotroph detritus (Fig. 274
3a: confidence intervals above the zero line). At last, consumer size (Large versus Small 275
heterotroph) did not impact significantly species density in the connected ecosystem. 276
277
Subsidy-mediated effect on competition
278
While trophic structure in one ecosystem significantly impacted community 279
dynamics in the connected ecosystem, the reverse was also true: we found that the 280
competition outcome (in Ecosystem 2) strongly depended on species functional traits in 281
the connected ecosystem (Fig. 4, F3,144 = 8.56, p<0.0001; see Supplementary material
282
Appendix 3 Tables A3 for full results of the GLM). At the end of the experiment, 283
coexistence between the two competitors (Colpidium and Paramecium) was only 284
observed in the meta-ecosystems with the autotroph as a neighbour (Fig. 4a). In the 285
presence of heterotrophic neighbours, we systematically observed competitive exclusion 286
of our focal species (Colpidium) by its competitor (Fig. 4b-d, with an exception in one 287
isolated replicate ecosystem), while it persisted over the course of the experiment when 288
connected to the autotroph community (Fig. 4a). 289
290
Changes in biomass distribution
291
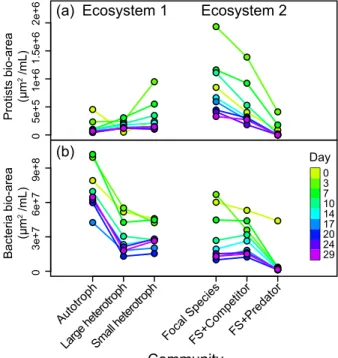
We observed that the biomass distribution among trophic compartments (bacteria 292
/ protists / predator) varies among community types, as inferred from bio-areas (Fig. 5; 293
Supplementary material Appendix 4 Tables A4). In the ecosystems where the predator 294
was present, both bacteria and protist biomass decreased dramatically within a few days 295
(Fig. 5, right side), and almost all biomass was concentrated at the predator level 296
(99.97% of the estimated bio-area at the end of the experiment). Protist and bacteria 297
biomasses did not differ between FS and FS+Competitor communities, but were 298
significantly lower in the FS+Predator community (adjusted p-value <0.0001 for every 299
pairwise comparison; see Supplementary material Appendix 5 Tables A5). Interestingly, 300
positive neighbour effects of the autotroph species on neighbour ecosystems occurred 301
despite the fact that autotroph protist biomass was generally lower or did not differ from 302
other neighbours (Fig. 5a, left side), but were associated with significantly higher 303
bacterial biomass (Fig. 5b, left side, see Supplementary material Appendix 5 Tables A5 304
for all multiple comparisons). 305
Discussion
306Community ecology usually assumes that species dispersal and local interaction 307
dynamics are the main processes driving regional biodiversity and species coexistence 308
(Leibold et al. 2004, Holyoak et al. 2005). With our experiment, we show that exchange 309
of subsidies among ecosystems also shapes community dynamics by mediating indirect 310
interactions between communities. By integrating resource dynamics in meta-311
communities, the meta-ecosystem concept offers an operational framework to envision 312
spatial feedbacks between resource and community dynamics at a large spatial scale 313
(Loreau et al. 2003). Here, we demonstrate in experimental meta-ecosystems that the 314
integration of feedbacks between community dynamics and spatial subsidies is needed 315
to understand ecosystem dynamics, and are essential to forecast the spatial spread of 316
local perturbations. 317
Our experiment reveals three striking subsidy-mediated effects among 318
communities solely connected by detritus spatial flows. First, autotroph communities 319
positively affected densities in the connected communities, such that the persistence of 320
our focal species in the presence of a competitor was tributary to these autotroph 321
subsidies. Second, population densities in the autotroph community heavily depended 322
on subsidies from heterotroph communities. Third, by contrast to these positive effects, 323
local predation negatively affected connected communities, even though the predator 324
was not allowed to disperse, but was only indirectly affecting them through the alteration 325
of subsidy flows. These three effects demonstrate that local community composition and 326
structure can strongly affect community dynamics in neighbouring ecosystems, even in 327
the absence of dispersal. 328
We explain the observed effects in terms of subsidy changes in quantity and 329
quality. The specific functioning of autotroph, heterotroph, and predation-pressured 330
communities impacted subsidies in contrasting ways. Photosynthetic activity by 331
autotrophs introduced new resources in the system otherwise closed, by fixing 332
atmospheric carbon, stored as carbohydrates (labile forms of carbon) or dissolved in the 333
medium by release activity (Baines and Pace 1991, Biersmith and Benner 1998, Guenet 334
et al. 2010). The greater bacteria densities in autotroph compared to heterotroph 335
communities likely profited from the exploitation of photosynthesis-derived dissolved 336
carbon (Børsheim et al. 2005). In addition, the small size of bacteria and their higher 337
surface/volume ratio may have enhanced recycling rates due to a greater proportion of 338
dead material exposed to decomposition (Berg 1984). Overall, even if not directly 339
measured, subsidies flowing from autotroph communities were undoubtedly more 340
abundant and more readily available than the ones flowing from heterotroph 341
communities. These rich subsidies subsequently triggered a bottom-up effect in the 342
neighbouring community resulting in higher densities of bacterivorous consumers. 343
Interestingly in the reverse direction also, subsidies from heterotroph communities 344
positively impacted autotroph community dynamics. This result stresses that neighbour 345
effects may not only happen via changes in subsidy abundance but also through 346
alterations to detritus stoichiometric balance. While not directly measured, the generally 347
greater ratio of nitrogen to carbon in heterotroph organisms (Elser et al. 2000, Sterner 348
2009) is a straightforward explanation for the higher densities of autotroph communities 349
when exchanging detritus with heterotroph communities compared to isolated controls, 350
along with likely ammonium release activity of the bacterivorous protists (Probyn 1987). 351
Overall, in our autotroph-heterotroph coupled ecosystems, heterotroph subsidies likely 352
relaxed autotroph nitrogen limitation, while autotroph subsidies fuelled heterotroph 353
growth with abundant labile carbon. Ecosystem couplings resulting in such resource 354
spatial complementarity are common between freshwater and riparian systems, with 355
riparian ecosystems exchanging abundant leaf litter against nitrogen-rich aquatic insects 356
(Baxter et al. 2005, Bartels et al. 2012), and thus highlight the general significance of our 357
findings. 358
By contrast, subsidies from communities with predators had negative effects on 359
neighbour community dynamics. We used a generalist predator species, capable of 360
consuming almost all protists and bacteria. Consequently, most of the biomass in these 361
ecosystems was concentrated at the highest trophic level, in the chitinous exoskeleton 362
of Daphnia. The molecular robustness of chitin as well as the low proportion of organic 363
material exposed to decomposition of larger organisms likely slowed down the recycling 364
process of predator detritus compared to other detritus (Berg 1984, Hamre et al. 2014). 365
The delay between slow recycling process and community dynamics triggered a spatial 366
cascade, leading to the accumulation of subsidies into recalcitrant form and to the 367
progressive starvation of neighbouring communities. It is noteworthy that in our closed 368
meta-ecosystems and in the absence of autotrophic species, the amount of subsidy 369
transferred is always the same (30% of total volume), therefore ruling out any local 370
collapse of subsidy to explain the negative effect of the predation. Therefore, the 371
observed indirect negative impact of predation on neighbour density likely comes from a 372
lower quality of subsidies. Beyond the specific effect of this particular predator, this 373
result stresses that changes in biomass distribution within a community may affect 374
neighbours by modifying subsidy characteristics. 375
Overall, our experiment shows general mechanisms by which natural 376
communities can indirectly but strongly influence each other’s functioning, via the 377
abundance, stoichiometry and decomposability of detritus locally produced and 378
subsidizing other ecosystems. Measuring directly the stoichiometric changes in 379
subsidies produced by contrasted communities could be a natural extension of this 380
experiment to investigate these mechanisms further. We demonstrate that, next to 381
species dispersal (for example tested by Staddon et al. (2010)), spatial dynamics of 382
detritus are essential by themselves to understand the fundamental functioning of 383
connected ecosystems, as well as their response to perturbations. The importance of 384
subsidies is often studied only from the recipient ecosystem’s local perspective (see 385
Marcarelli et al. 2011, Sitters et al. 2015 for reviews), and ecosystem managers usually 386
consider the threat of direct alterations to resource flows (e.g. nutrient pollution), but 387
rarely threats potentially induced by alterations of community structure or composition in 388
connected ecosystems (but see the crash of forest spider communities, induced by 389
prey-subsidy disruption following the invasion of a stream by an exotic fish in Baxter et 390
al. 2004). Our results suggest that any kind of perturbation (e.g. land-use change, over-391
harvesting) can have wider repercussions in space than those observed on local 392
communities because of subsidy disruption (e.g. cascades across aquatic–terrestrial 393
boundaries: Greig et al. 2012, Fey et al. 2015, Schulz et al. 2015). The extent to which 394
local perturbations spatially cascade to other communities will depend on the strength of 395
the subsidy coupling between ecosystems, an essential piece of information on which 396
more research is needed. Our findings call for the adoption of a spatial perspective in 397
ecosystem management and restoration ecology that integrates fine-tuned knowledge of 398
resource spatial exchanges between ecosystems. 399
Acknowledgements
400We thank the EMERGe research group, Tom Battin and Anita Narwani for discussions, 401
Björn C. Rall for a previous review of our manuscript, Esther Keller and Elvira Mächler 402
for technical support and Esther Keller and Piet Spaak for providing the Daphnia magna. 403
Statement of authorship
405IG, EH and FA designed the research; IG, EH and PG conducted the research and 406
processed the data; IG analysed the data and wrote the first draft of the manuscript. All 407
authors contributed to the final version of the manuscript. 408
Funding
410This work was supported by the Swiss National Science Foundation Grant 411
PP00P3_150698, University of Zurich and Eawag. 412
413 414
References
415416
Allison, S. D. 2012. A trait-based approach for modelling microbial litter decomposition. - 417
Ecol. Lett. 15: 1058–70. 418
Altermatt, F., Schreiber, S. and Holyoak, M. 2011. Interactive effects of disturbance and 419
dispersal directionality on species richness and composition in metacommunities. - 420
Ecology 92: 859-870. 421
Altermatt, F. et al. 2015. Big answers from small worlds: A user’s guide for protist 422
microcosms as a model system in ecology and evolution. - Methods Ecol. Evol. 6: 423
218–231. 424
Baines, S. B. and Pace, M. L. 1991. The production of dissolved organic matter by 425
phytoplankton and its importance to bacteria: Patterns across marine and 426
freshwater systems. - Limnol. Oceanogr. 36: 1078–1090. 427
Bartels, P. et al. 2012. Reciprocal subsidies between freshwater and terrestrial 428
ecosystems structure consumer resource dynamics. - Ecology 93: 1173–1182. 429
Baxter, C. V. et al. 2004. Fish Invasion Restructures Stream and Forest Food Webs By. 430
- Ecology 85: 2656–2663. 431
Baxter, C. V. et al. 2005. Tangled webs: Reciprocal flows of invertebrate prey link 432
streams and riparian zones. - Freshw. Biol. 50: 201–220. 433
Berg, B. 1984. Decomposition of root litter and some factors regulating the process: 434
Long-term root litter decomposition in a scots pine forest. - Soil Biol. Biochem. 16: 435
609–617. 436
Berlow, E. L. et al. 1999. Quantifying variation in the strengths of species interactions. - 437
Ecology 80: 2206–2224. 438
Biersmith, A. and Benner, R. 1998. Carbohydrates in phytoplankton and freshly 439
produced dissolved organic matter. - Mar. Chem. 63: 131–144. 440
Børsheim, K. Y. et al. 2005. Photosynthetic algal production, accumulation and release 441
of phytoplankton storage carbohydrates and bacterial production in a gradient in 442
daily nutrient supply. - J. Plankton Res. 27: 743–755. 443
Carpenter, S. R. et al. 2001. Trophic cascades, nutrients, and lake productivity: Whole-444
lake experiments. - Ecol. Monogr. 71: 163–186. 445
Cole, J. J. and Caraco, N. F. 2001. Carbon in catchments: Connecting terrestrial carbon 446
losses with aquatic metabolism. - Mar. Freshw. Res. 52: 101–110. 447
Cole, J. J. et al. 2006. Differential support of lake food webs by three types of terrestrial 448
organic carbon. - Ecol. Lett. 9: 558–568. 449
Cornwell, W. K. et al. 2008. Plant species traits are the predominant control on litter 450
decomposition rates within biomes worldwide. - Ecol. Lett. 11: 1065–1071. 451
Dreyer, J. et al. 2015. Quantifying aquatic insect deposition from lake to land. - Ecology 452
96: 499–509. 453
Elser, J. J. et al. 2000. Nutritional constraints in terrestrial and freshwater food webs. - 454
Nature 408: 578–580. 455
Enriquez, S. et al. 1993. Patterns in decomposition rates among photosynthetic 456
organisms: the importance of detritus C:N:P content. - Oecologia 94: 457–471. 457
Fey, S. B. et al. 2015. Recognizing cross-ecosystem responses to changing 458
temperatures: soil warming impacts pelagic food webs. - Oikos 124: 1473–81. 459
Fitzgerald, S. A. and Gardner, W. S. 1993. An algal carbon budget for pelagic-benthic 460
coupling in Lake Michigan. - Limnol. Oceanogr. 38: 547–560. 461
Fox, J. and Weisberg, S. 2011. An {R} Companion to Applied Regression. - Sage. 462
Frank, K. T. et al. 2005. Trophic cascades in a formerly cod-dominated ecosystem. - 463
Science. 308: 1621–3. 464
García-Palacios, P. et al. 2015. The importance of litter traits and decomposers for litter 465
decomposition: a comparison of aquatic and terrestrial ecosystems within and 466
across biomes. - Funct. Ecol. in press. 467
Gratton, C. and Vander Zanden, M. J. 2009. Flux of aquatic insect productivity to land: 468
Comparison of lentic and lotic ecosystems. - Ecology 90: 2689–2699. 469
Greig, H. S. et al. 2012. Warming, eutrophication, and predator loss amplify subsidies 470
between aquatic and terrestrial ecosystems. - Glob. Chang. Biol. 18: 504–514. 471
Guenet, B. et al. 2010. Priming effect: bridging the gap between terrestrial and aquatic 472
ecology. - Ecology 91: 2850–2861. 473
Hall, R. O. et al. 2000. Organic Matter Flow in Stream Food Webs With Reduced Detrital 474
Resource Base. - Ecology 81: 3445–3463. 475
Hamre, A. G. et al. 2014. Enzyme processivity changes with the extent of recalcitrant 476
polysaccharide degradation. - FEBS Lett. 588: 4620–4624. 477
Harvey, E., Gounand, I., Ganesanandamoorthy, P. and Altermatt, F. 2016. Spatially 478
cascading effect of perturbations in experimental meta-ecosystems. - Proceeding of 479
the Royal Society B-Biological Sciences 283: 20161496. 480
Hocking, M. D. and Reimchen, T. E. 2009. Salmon species, density and watershed size 481
predict magnitude of marine enrichment in riparian food webs. - Oikos 118: 1307– 482
1318. 483
Holyoak, M. et al. 2005. Metacommunities: spatial dynamics and ecological communities 484
(M Holyoak, MA Leibold, and RD Holt, Eds.). - University of Chicago Press. 485
Jackson, J. B. et al. 2001. Historical overfishing and the recent collapse of coastal 486
ecosystems. - Science. 293: 629–37. 487
Leibold, M. A. et al. 2004. The metacommunity concept: a framework for multi-scale 488
community ecology. - Ecol. Lett. 7: 601–613. 489
Lenth, R. V. 2013. lsmeans: Least-squares means. R package version 1.06-05. in press. 490
Loreau, M. et al. 2003. Meta-ecosystems: a theoretical framework for a spatial 491
ecosystem ecology. - Ecol. Lett. 6: 673–679. 492
Marcarelli, A. M. et al. 2011. Quantity and quality: unifying food web and ecosystem 493
perspectives on the role of resource subsidies in freshwaters. - Ecology 92: 1215– 494
1225. 495
Massol, F. et al. 2011. Linking community and ecosystem dynamics through spatial 496
ecology. - Ecol. Lett. 14: 313–23. 497
Massol, F. et al. (in review) How life-history traits affect ecosystem properties: Effects of 498
dispersal in metaecosystems. - Oikos. 499
Menninger, H. L. et al. 2008. Periodical cicada detritus impacts stream ecosystem 500
metabolism. - Ecosystems 11: 1306–1317. 501
Meyer, D. et al. 2014. e1071: Misc Functions of the Department of Statistics (e1071), TU 502
Wien. R package version 1.6-3. http://CRAN.R-project.org/package=e1071. in 503
press. 504
Mouquet, N. and Loreau, M. 2002. Coexistence in Metacommunities: The Regional 505
Similarity Hypothesis. - Am. Nat. 159: 420–426. 506
Nakagawa, S. 2004. A farewell to Bonferroni: The problems of low statistical power and 507
publication bias. - Behav. Ecol. 15: 1044–1045. 508
Pennekamp, F. and Schtickzelle, N. 2013. Implementing image analysis in laboratory-509
based experimental systems for ecology and evolution: A hands-on guide. - 510
Methods Ecol. Evol. 4: 483–492. 511
Pennekamp, F. et al. 2015. BEMOVI, software for extracting behavior and morphology 512
from videos, illustrated with analyses of microbes. - Ecol. Evol. 5: 2584–2595. 513
Polis, G. A. et al. 1997. Toward an integration of landscape and food web ecology: the 514
dynamics of spatially subsidized food webs. - Annu. Rev. Ecol. Syst. 28: 289–316. 515
Polis, G. A. et al. 2004. Food Webs at the landscape level (GA Polis, ME Power, and 516
GR Huxel, Eds.). - The University of Chicago press. 517
Probyn, T. A. 1987. Ammonium regeneration by microplankton in an upwelling 518
environment. - Mar. Ecol. Prog. Ser. 37: 53–64. 519
Richardson, J. S. et al. 2010. Resource subsidies across the land-freshwater interface 520
and responses in recipient communities. - River Res. Appl. 26: 55–66. 521
Schindler, D. E. and Scheuerell, M. D. 2002. Habitat coupling in lake ecosystems. - 522
Oikos 98: 177–189. 523
Schmitz, O. J. et al. 2000. Trophic Cascades in Terrestrial Systems: A Review of the 524
Effects of Carnivore Removals on Plants. - Am. Nat. 155: 141–153. 525
Schulz, R. et al. 2015. Review on environmental alterations propagating from aquatic to 526
terrestrial ecosystems. - Sci. Total Environ. 538: 246–261. 527
Scott, N. A. and Binkley, D. 1997. Foliage litter quality and annual net N mineralization: 528
comparison across North American forest sites. - Oecologia 111: 151:159. 529
Seymour, M., Fronhofer, E.A. & Altermatt, F. 2015. Dendritic network structure and 530
dispersal affect temporal dynamics of diversity and species persistence. - Oikos 531
124: 908-916. 532
Shurin, J. B. et al. 2006. All wet or dried up? Real differences between aquatic and 533
terrestrial food webs. - Proc. Biol. Sci. 273: 1–9. 534
Sitters, J. et al. 2015. Spatial stoichiometry: cross-ecosystem material flows and their 535
impact on recipient ecosystems and organisms. - Oikos 124: 920–930. 536
Staddon, P. et al. 2010. Connectivity, non-random extinction and ecosystem function in 537
experimental metacommunities. - Ecol. Lett. 13: 543–552. 538
Sterner, R. W. 2009. Nutrient Stoichiometry in Aquatic Ecosystems. - In: Encyclopedia of 539
Inland waters. pp. 820–831. 540
Sterner, R. W. and Elser, J. J. 2002. Ecological Stoichiometry. The Biology of Elements 541
from Molecules to the Biosphere. - Princeton University Press. 542
Supplementary material (available online as Appendix oik- 03922 544
at <www.oikosjournal.org/readers/appendix/oik-03922>). Appendix 1 545
Data available from the Dryad Digital Repository: <http:// 546
dx.doi.org/10.5061/dryad.93hd6 > 547
549
550
Figure 1. The experimental design consists of two-patch meta-ecosystems linked by 551
reciprocal exchanges of detritus and resources (subsidies). In Ecosystem 1, we varied 552
the dominant functional trait of the species present (either Euglena gracilis, Paramecium 553
aurelia, or Tetrahymena pyriformis). In Ecosystem 2, we varied the trophic structure, by 554
growing either a single species (Colpidium striatum; Focal Species (FS)), this same 555
species with an additional competitor (FS + Competitor: Colpidium striatum with 556
Paramecium aurelia), or in presence of a predator (FS + Predator: Colpidium striatum 557
with Daphnia magna). The combination of these two variation levels gives nine different 558
meta-ecosystems, each replicated five times. All ecosystems were inoculated with the 559
respective above named species, a bacterial community and organic resources. 560
Ecosystem 1 Ecosystem 2
Subsidy Exchanges
Vary species traits
Focal Species
Colpidium
Vary trophic structure
FS+Predator Colpidium + Daphnia FS+Competitor Colpidium + Paramecium or or or or X5 Autotroph Euglena Large Heterotroph Paramecium Small Heterotroph Tetrahymena
561
Figure 2. Effect of the species traits in Ecosystem 1 on the density of focal species in 562
Ecosystem 2 (Colpidium striatum) over time, expressed as the log response-ratio (RR) 563
of Colpidium density to detritus diffusion compared to the control without diffusion: Log 564
RR = ln##N!"#$%&&'+ min() #N* !"#$%&&)+ min()), with N the density and min( the minimal
565
density detectable by our video analysis. Shapes and colours refer to the neighbour 566
species. Bars give the 95% confidence interval (CI). Densities with CI not crossing the 567
zero dotted lines differ significantly from the control. None overlapping CIs reveal protist 568
densities significantly differing from each other. Each panel gives the results for a 569
different trophic structure involving our focal species: (a) Focal Species, (b) 570
FS+Competitor, (c) FS+Predator. 571
Day
ratio response
(a) Focal Species
(b) FS+Competitor (c) FS+Predator 3 7 17 Neighbour Autotroph Large heterotroph Small heterotroph
572
Figure 3. Effect of trophic structure in Ecosystem 2 on the density of different species in 573
Ecosystem 1 via the diffusion of detritus over time, expressed as the log-ratio of density 574
response to detritus diffusion compared to the control without diffusion: log response-575
ratio = ln##N$%&&'+ min
() #N* $%&&)+ min()), with N the density and min( the minimal
576
density detectable by our video analysis. Shapes and colours refer to the neighbour 577
trophic structure. Bars give the 95% confidence interval (CI). Densities with CI not 578
crossing the zero dotted lines differ significantly from the control. None overlapping CIs 579
reveal protist densities significantly differing from each other. Each panel gives the 580
results for a different species with specific traits in Ecosystem 1: (a) Autotroph (Euglena 581
gracilis), (b) Large heterotroph (Paramecium aurelia), (c) Small heterotroph 582 (Tetrahymena pyriformis). 583 0 2 3 0 2 0 0 3 7 20 29 Neighbour Focal Species FS+Competitor FS+Predator Day ratio response (a) Autotroph (b) Large heterotroph (c) Small heterotroph
584
Figure 4. Effect of species trait in Ecosystem 1 on the competition hierarchy between 585
Colpidium (orange area) and Paramecium (pink area) in Ecosystem 2 over time 586
(FS+Competitor treatment). The effect is expressed as the relative proportion of 587
Colpidium versus Paramecium individuals (the two competitors). Neighbour communities 588
are either the Autotroph (Euglena gracilis), or the Large heterotroph (Paramecium 589
aurelia) or the Small heterotroph (Tetrahymena pyriformis), in panel (a), (b), and (c) 590
respectively. Barbells refer to subsidy connection. Panel (d) shows the control without 591
diffusion. Dotted lines give the standard deviation. 592
593
Day
Proportion of individuals (+Competitor)
Paramecium Colpidium 0 0.5 1 Paramecium Colpidium 0 0.5 1 Paramecium Colpidium 0 0.5 1 Paramecium Colpidium 0 3 7 10 14 17 20 24 29 0 0.5 1 (a) Autotroph (b) Large heterotroph (c) Small heterotroph (d) No neighbor
594
595
Figure 5. Bio-area of (a) protists and (b) bacteria over time (colours) for the different 596
communities in each ecosystem. Points give the mean averaged over five replicates at a 597
specific day (colours). 598 599 0 5e+5 1e+6 2e+6 0 3e+7 6e+7 9e+8 Protists bio-area (µ m 2 /mL) Bacteria bio-area (µ m 2 /mL) 1.5e+6
Focal SpeciesFS+CompetitorFS+Predator Large heterotroph Autotroph Community Small heterotroph Ecosystem 1 Ecosystem 2 (a) (b) 29 24 20 17 14 10 7 3 0 Day