HAL Id: hal-02045700
https://hal.sorbonne-universite.fr/hal-02045700
Submitted on 22 Feb 2019
HAL is a multi-disciplinary open access
archive for the deposit and dissemination of
sci-entific research documents, whether they are
pub-lished or not. The documents may come from
teaching and research institutions in France or
abroad, or from public or private research centers.
L’archive ouverte pluridisciplinaire HAL, est
destinée au dépôt et à la diffusion de documents
scientifiques de niveau recherche, publiés ou non,
émanant des établissements d’enseignement et de
recherche français ou étrangers, des laboratoires
publics ou privés.
A biophysical model explains the spontaneous bursting
behavior in the developing retina
Dora Matzakos-Karvouniari, Lionel Gil, Elaine Orendorff, Olivier Marre,
Serge Picaud, Bruno Cessac
To cite this version:
Dora Matzakos-Karvouniari, Lionel Gil, Elaine Orendorff, Olivier Marre, Serge Picaud, et al.. A
biophysical model explains the spontaneous bursting behavior in the developing retina. Scientific
Reports, Nature Publishing Group, 2019, 9 (1), pp.1-23. �10.1038/s41598-018-38299-4�. �hal-02045700�
www.nature.com/scientificreports
A biophysical model explains the
spontaneous bursting behavior in
the developing retina
Dora Matzakos-Karvouniari
1, Lionel Gil
2, elaine Orendorff
3, olivier Marre
3, serge picaud
3&
Bruno Cessac
1During early development, waves of activity propagate across the retina and play a key role in the proper wiring of the early visual system. During a particular phase of the retina development (stage II) these waves are triggered by a transient network of neurons, called starburst Amacrine Cells (sACs), showing a bursting activity which disappears upon further maturation. the underlying mechanisms of the spontaneous bursting and the transient excitability of immature sACs are not completely clear yet. While several models have attempted to reproduce retinal waves, none of them is able to mimic the rhythmic autonomous bursting of individual sACs and reveal how these cells change their intrinsic properties during development. Here, we introduce a mathematical model, grounded on biophysics, which enables us to reproduce the bursting activity of sACs and to propose a plausible, generic and robust, mechanism that generates it. The core parameters controlling repetitive firing are fast depolarizing V-gated calcium channels and hyperpolarizing V-gated potassium channels. the quiescent phase of bursting is controlled by a slow after hyperpolarization (sAHp), mediated by calcium-dependent potassium channels. Based on a bifurcation analysis we show how biophysical parameters, regulating calcium and potassium activity, control the spontaneously occurring fast oscillatory activity followed by long refractory periods in individual sACs. We make a testable experimental prediction on the role of voltage-dependent potassium channels on the excitability properties of sACs and on the evolution of this excitability along development. We also propose an explanation on how sACs can exhibit a large variability in their bursting periods, as observed experimentally within a sACs network as well as across different species, yet based on a simple, unique, mechanism. As we discuss, these observations at the cellular level have a deep impact on the retinal waves description.
Retinal waves, observed in many vertebrate species - chicks1, ferrets2, mice3, turtles4, macaques5 etc. are sponta-neous bursts of activity propagating in the developing retina and playing a fundamental role in shaping the visual system and retinal circuitry. They emerge due to the conjunction of intrinsic single-cell properties (excitability and long refractoriness) and network interactions6. In the developing retina, waves evolve during three consecu-tive stages, mainly characterized by different types of synaptic transmission; gap junctions (stage I), acetylcholine (stage II) and glutamate (stage III)7 and are mediated by transient networks of specific cell types. An important type of such cells are the Starburst Amacrine Cells (SACs), which are involved in direction selectivity in the mature retina8,9 thanks to their special asymmetric synaptic distribution of excitatory and inhibitory synapses. However, during early development, these cells have a different role; they are responsible for eliciting stage II retinal waves via their spontaneous bursting behavior induced by autonomous intrinsic cellular mechanisms6. This activity disappears completely upon maturation6. During stage II, SACs constitute a transient network of autonomous bursters which, through cholinergic coupling, achieve opportunistic local synchrony. Under con-ditions yet to be identified, this local area of synchronized bursters can give rise to propagating waves. Although stage II retinal waves are quite thoroughly studied experimentally1–3 as well as theoretically by several modeling approaches10–13 (see Methods for a short review of these models and a comparison to ours) there are still impor-tant questions not yet addressed by existing studies. So far, previous models do not allow to understand how bio-physical parameters, like conductances, impact the activity of SACs during this stage. This question is important
1Biovision team, Université côte d’Azur, inria, france. 2inPHYni, Université côte d’Azur, cnRS, Sophia Antipolis, france. 3institut de la Vision, Paris, france. correspondence and requests for materials should be addressed to B.c. (email: [email protected])
Received: 24 November 2017 Accepted: 21 December 2018 Published: xx xx xxxx
www.nature.com/scientificreports/
as some of these parameters evolve during development, or can be controlled pharmacologically, with drastic effects on individual SACs bursting6,14. Finally, and although stage II retinal waves are ubiquitous, experiments reveal a vast variability in the bursting period of SACs across species. Are SACs fundamentally different from one species to another, or is there a common mechanism of bursting under which the period is quite sensitive to physiological parameters variations?
In the spirit of previous works15–17 using dynamical systems and bifurcation theory to characterize neural systems, we develop a thorough modeling of the SACs bursting which accurately reproduces the experimental observations made in the seminal papers by Zheng et al.6,14, several of them for the first time. In addition to new theoretical predictions, we also propose a simple scenario for the SACs bursting mechanism and its evolution during development, that could be tested experimentally. Bursting is thoroughly studied in the neuronal mod-eling literature18, as well as the possible bifurcations scenarios generating it. Through our analysis, we identify which parameters are essential to control the transient bursting of immature SACs occurring naturally along development or pharmacologically. As parameters variation is restricted to small ranges by biophysical con-straints, our hypothesis is that, during development, SACs are close to a bifurcation point, consequently making them sensitive to small physiological parameters variations.
More precisely, we propose to describe and explain the experimental observations of Zheng et al.6,14 on indi-vidual immature SACs dynamics, in the following theoretical framework: SACs burst because, during stage II, they are close to a (saddle-node) bifurcation, driving the cell from a rest state to fast oscillations. The bifurcation is triggered by small variations of the membrane potential, due to noise or other cellular effect. After this bifur-cation, SACs stay in the regime of fast repetitive firing, triggering the activation of slow calcium-gated potassium channels generating a slow hyperpolarization current (sAHP). This current eventually drives the cell to a homo-clinic bifurcation. As a consequence, cells return back to the quiescent state allowing a long after hyperpolariza-tion phase. This bifurcahyperpolariza-tion analysis reveals a mechanism for SACs rhythmic bursting, interpretable with respect to biophysics and the experiments of Zheng et al.6,14 on individual immature SACs dynamics. In addition, we identify the fast voltage-gated potassium channels as a possible candidate for the fast hyperpolarizing channels involved in bursting (to our best knowledge not yet been experimentally determined). Based on19,20 we propose they could be of Kv3 type. This leads us to a conjecture on the role of the Kv3 potassium conductance variation
which may act on the transient intrinsic properties of SACs excitability during development. Furthermore, the closeness to a bifurcation has strong consequences on the interburst intervals of SACs. It is naturally associated with a high variability which can explain the wide range of interburst periods observed within a network21, as well as across species10. As we show, a small external current (~5 pA) strongly impacts the interburst intervals of SACs. This implies, that, in a network of cholinergically coupled SACs, the bursting period has a wide intrinsic variability, resulting from simple bifurcation arguments, without requiring exogenous mechanisms. In the discus-sion section, we briefly argue how a set of such inhomogeneous bursters may achieve synchrony and wave gen-erations without any additional mechanism than the existing cholinergic interaction. The general discussion on how cholinergic interaction between nearby autonomous bursters generates wave-like, population-level behavior propagating in a similar way as is observed experimentally will be addressed in a forthcoming paper (see22–24).
The paper is organized as follows. The section ‘Results’ introduces the model definition, the bifurcation anal-ysis, and the main conclusions resulting from this analanal-ysis, including experimental predictions. The section ‘Discussion’ is mainly dedicated to the biological interpretation of our theoretical results, as well as their impact on the description of retinal waves. Finally, in Methods, we provide the technical aspects of our work including the biophysical derivation of the model’s equations, as well as mathematical computations used in the paper. We also include in this section a short review on the comparison of existing models.
Results
During retinal development, Starburst Amacrine Cells (SACs), which are cells forming a lattice right above the ganglion cells layer, are found to exhibit spontaneous intrinsic rhythmic bursting activity, which disappears upon maturation6. In the following, we derive a biophysical set of equations, describing the bursting activity of imma-ture SACs, following experimental observations regarding the ionic currents involved in their bursting6. We cali-brate the equations parameters in order to reproduce the bursting characteristics found in6,14. The analysis of our model leads to our central hypothesis, that the rest state of SACs lies near a bifurcation point, which means that small variations of parameters could lead to abrupt changes in the dynamics of the cell. This hypothesis, which is novel for immature SACs, jointly explains A) the biophysical mechanism of bursting in the developing SACs, B) accounts for the vast variability of bursting characteristics of SACs across species and C) predicts a possible mechanism on how SACs lose their excitability upon maturation.
Let us now start by deriving our model along with the biological justifications for our equations.
A biophysical model for bursting immature sACs.
In order to address the mechanism of bursting and how the physiological parameters of SACs change during development we need to model their underlying cellular mechanisms. In the case of immature SACs, the two key biophysical mechanisms associated with the emergence of spontaneous bursting during early development are6:• fast repetitive bursts of spikes mainly controlled by fast voltage-gated channels;
• prolonged After HyperPolarizations (AHPs) modulating fast oscillations, controlled by Ca2+-gated K+
channels.
In order to account for (i) and (ii), we model immature SACs activity with a conductance based model of the Morris-Lecar type25, an electronic-circuit-equivalent equation for the local membrane potential, with addi-tional non-linear currents. Our model involves 5 variables, whose evolution is controlled by a set of non-linear
www.nature.com/scientificreports/
differential equations with 3 timescales: (1) fast variables (~10 ms) V(t), the local membrane potential, and, N(t), the gating variable for fast voltage-gated K+ channels; (2) medium variable (~2 s) C(t), the intracellular Ca2+
concentration; (3) slow variables (~10 s) R(t) and S(t), the gating variables for slow Ca2+-gated K+ channels. All
parameters values and the auxiliary functions involved are found in Methods. The membrane voltage V(t) obeys:
σξ = + + + + + C dV dt I V( ) I V( ) I V N( , ) I ( , )V R I , (1) m L C K sAHP ext Itot t
where Cm is the membrane capacitance, IL = −gL(V − VL) is the leak current, with gL, leak conductance and VL,
leak reversal potential.
The fast repetitive firing (see (i)) during the active phase of bursting generally results from the competition between a depolarizing and a hyperpolarizing current. Experiments in6 have specified voltage-gated Ca2+
chan-nels as the depolarizing component of bursting in SACs. However, the ionic chanchan-nels related to the fast hyperpo-larizing component of SACs bursting have not yet been identified experimentally. In this work, we propose that fast voltage-gated K+ channels play this role (see also Discussion for further justification). Therefore, the terms
IC and IK, respectively corresponding to Ca2+ and K+ currents, are generating the fast oscillations in our model.
Figure 1. Schematic representation of the modeling of the gating mechanism of Ca2+-gated K+ channels. The
correspondence between the channel’s activation steps and the modeling state variables R, S, C is also indicated.
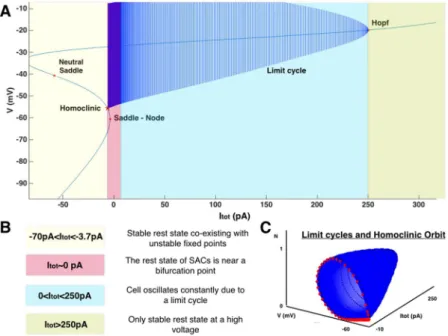
Figure 2. (A) Bifurcation diagram of the fast dynamics (N, V) (Eq. (19) in Methods) when the constant current Itot is varied in a wide range. Each deep blue curve corresponds to the projection of a trajectory of the fast
subsystem onto the V axis, for a fixed value of Itot. (B) Interpretation of all the different dynamical regimes of the
bifurcation diagram. (C) Same as in A, except that the various trajectories are now drawn in the (N, V) plane and not only projected onto the V axis. Blue. Evolution of the limit cycles when Itot varies. Red. Homoclinic orbit.
www.nature.com/scientificreports/
Note that6 have shown that voltage-gated Na+ channels do not participate in the bursting mechanism of
immature SACs (bursting activity of SACs was not altered upon tetrodoxin -TTX- application), thus, dynamics of Na+ channels will not be considered in our modeling (see also Discussion).
The voltage-gated Ca2+ current is described by a Morris-Lecar model25 where:
= − ∞ − .
I VC( ) g M V VC ( )( VC) (2)
∞
g M VC ( ) is the voltage dependent conductance of the Ca2+ channel (see Eq. (21) in Methods).
The fast voltage-gated K+ channel is modeled as:
= − − .
I V NK( , ) g N VK ( VK) (3)
where the evolution of the fast voltage-gated K+ channel gating variable N(t) is given by:
τ dN = Λ ∞ −
dt ( )( ( )V N V N), (4)
N
Λ(V) and N V∞( ) are given by Eqs (21) and (22) in Methods.
The form of equations (3) and (4) is based on25. However, the timescale of the variable N is much faster (~ms) in our model that in the original Morris-Lecar model (~s), calibrated in order to capture the frequency of the fast repetitive firing of SACs, which is around 20 Hz6 (see also Bifurcation Analysis).
The long refractoriness in-between consecutive bursts is controlled by a slow After Hyper-Polarization (sAHP) K+ current, I
sAHP. It was observed by6 that IsAHP is mediated by Ca2+ -gated K+ channels, and that it resembles the
sAHP observed by Abel et al.26, generated by specific channels called SK. Following these tracks we propose a modeling of “SK”-like channel (as named in6) based on12 for the structure of the equations and27 for the calcium Figure 3. The two scenarios of triggering bursting. (a) Dynamically driven bursting, Iext = 0. The plot shows a
representation of bursting in the plane (Itot, V) (zoom of the bifurcation diagram of Fig. 2, near ISN). Red lines
correspond to stable fixed points, gray and pink lines to unstable fixed points, green lines are the extremal values of voltage fast oscillations. Upon this bifurcation diagram, obtained from the reduced model (Morris-Lecar with IsAHP = Itot = constant), we superimpose the trajectory of the full system in the plane (IsAHP, V) (deep blue). The
blue arrow indicates the direction of the flow. In the fast oscillations regime V is varying periodically, with a fast period, inducing a fast variation of the term V − VK in the sAHP current, explaining the diagonal motion.
Despite these fast oscillations one sees that the bifurcation is driven by the slow motion on the branches obtained from the bifurcation analysis assuming a constant current. The conductance gsAHPR4 is varying slowly,
with the time scale of R, explaining the slow left-wise shift of the trajectory until the homoclinic bifurcation point is reached. The cyan vertical line corresponds to the value of Iext = 0. (b) Noise driven bursting. The
dynamics has now a stable fixed point (purple circle). An additional current, Iext = −4 pA (vertical cyan line) is
now present. Bursting cannot occur without an exogenous excitation, here noise. The amount of noise (controlled by σ) necessary to induce bursting depends on the distance between the fixed point (controlled by Iext) and the bifurcation point ISN1.
www.nature.com/scientificreports/
dynamics. The mechanism of the opening of Ca2+ -gated ionic channels channels is analyzed in detail in the
“Methods” section. In order to simplify the cascade of chemical reactions taking place while opening the sAHP channels, we approximate the channel dynamics by reducing the process into two discrete steps: a) Four ions of Ca2+ bind to a second messenger protein called calmodulin, forming a saturated calmodulin complex, CaM; b)
CaM binds to each of the four intracellular subunits of the channel to open it (see Fig. 1). This process is mapped to our model through three variables: 1) the variable C which models the intracellular calcium concentration and mainly controls the gating variables of the sAHP channels, 2) the variable S which models the fraction of the sat-urated calmodulin and 3) the variable R which models the fraction of bounded terminals. This gating mechanism is sketched in Fig. 1.
The sAHP current takes the form:
= − −
IsAHP( , )V R gsAHPR V4( VK), (5)
where gsAHP is the maximum sAHP conductance. Indeed, 4 bound terminals are needed to open a Ca2+-gated K+
channel, thus the corresponding conductance is gsAHPR4, involving a fourth order nonlinearity.
We model the gating mechanism of the Ca2+ gated K+ channels as follows. The gating variable R(t) obeys:
τ dR =α − −
dt S(1 R) R, (6)
R R
the fraction of saturated calmodulin concentration S(t) obeys:
τdS =α − −
dt C (1 S) S, (7)
S S 4
and the intracellular calcium concentration C(t) obeys:
τdC = −α + +δ .
dt H C C I V( ) (8)
C C
X 0 C C
The derivation of the equations (6), (7) and (8) is fully justified in Methods.
Finally, ξt is a white noise whose amplitude is constant with time and controlled by σ and Iext is an external
current. For subsequent analysis we introduce the current Itot = IsAHP + Iext.
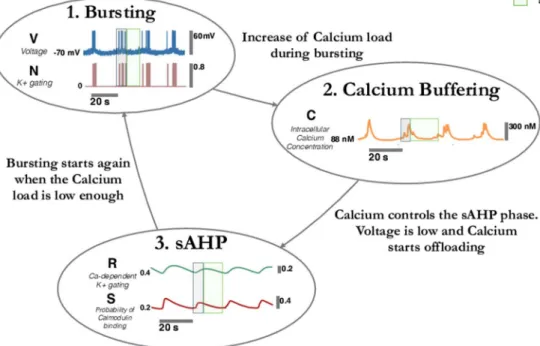
Figure 4. Biophysical mechanism for bursting in immature SACs. (1) Fast spiking occurs due to the competition between voltage gated Ca2+ (excitatory current) and K+ channels (inhibitory current). (2)
Calcium load increases during the rapid firing phase while the voltage is in a high voltage state. This leads to a slow increase of sAHP. When sAHP is large enough there is a sharp decay of the voltage (bifurcation) and the hyperpolarisation phase of the cell starts. As voltage is low, the calcium load starts to slowly decrease. (3) During the slow offloading calcium stage we observe a refractory phase. The decrease of calcium concentration induces a slow decay of the sAHP. When calcium is small enough rapid firing starts again via a new bifurcation.
www.nature.com/scientificreports/
Dynamical changes with respect to parameters variations. In our model, the variable V, N evolve with a fast time scale of the order of a few milliseconds under the influence of the current IsAHP whose conductance is slow, being
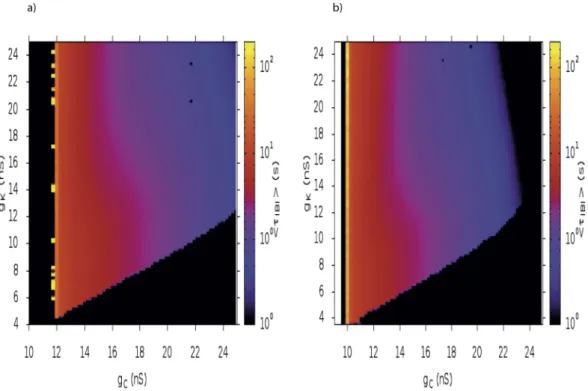
driven by slow variables C, S, R (time scale - several seconds). As a consequence, the main material of this paper relies on a thorough analysis of the bifurcation structure in the fast Morris-Lecar dynamics. There already exist remarkable numerical bifurcation analyses of the Morris-Lecar model (see for example the very detailed work of28) which has however many parameters: changing their range of variations can dramatically impact the dynam-ics. Our study on SACs bursting considers quite different range of parameters than the studies we know about (more related to the original paper investigating the barnacle giant muscle25). For example28, investigates the effect of a positive external current whereas we consider a negative external current, with quite different effects on Figure 5. Heat map of the interburst period as a function of gC and gK. We sample gC, gK on a grid with
resolution 0.25 nS. For each point, we generate 20 trajectories of duration 2000 s and count the number of bursts in each trajectory. A period of high calcium activity has to last at least 1 second to be considered as a burst. The heat map show the average value of τIBI in color log scale for a fixed amount of noise σ = 4 pA ms1/2. (a)
Iext = −4 pA (noise driven bursting); (b) Iext = 0 pA (dynamically driven bursting).
Figure 6. The behavior of the bursting period near a saddle-node bifurcation could explain interburst variability. Red: Computing the dependence of τIBI upon the variation of Iext with our model. Blue: A 2
parameters fit of the simulated data with the curve −
K I I
2 ext c for
∈ −
Iext [ 20, 40] pA. Note that this fit does not hold true away from the asymptote. (see Methods). Red: Values of experimentally measured interburst intervals for different species mapped to our results (see text).
www.nature.com/scientificreports/
dynamics. Other parameters such as V1, V2, V3, V4, VL, gK, gCa have very different ranges in our case (e.g.
V3 = −1 mV in25, ∈V3 [0, 25] mV in28, V3 = −25 mV in our case). Finally, the characteristic rate for opening
potassium channels (variable N) is of order 1
15 s−1 in Morris-Lecar’s paper, and of order 0.1 s−1 in28. That is the variable N is slow. In contrast, our variable N, mimicking fast potassium channels is very fast
(
τ1 =200s−1)
N . This
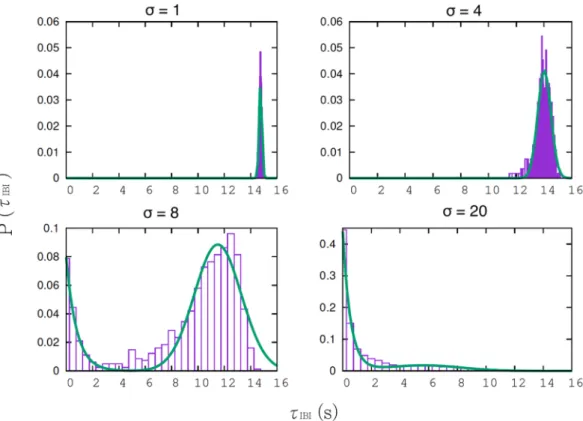
results in a very fast contraction in the N direction near the rest state visible e.g. in the shape of stable and unstable manifolds (see Figs 9A,B, 11c,d, 12B,C and 13B,E,G). As a consequence, our bifurcations study is new and, in addition to explain bursting in SACs, brings original results in the analysis of the Morris-Lecar model dynamics. Figure 7. Histogram of bursting periods for different noise levels. We show the distribution of interburst interval distribution τIBI with different levels of noise. Top left: σ = 1 pA ms1/2. Top right: σ = 4 pA ms1/2. Bottom
left: σ = 8 pA ms1/2. Bottom right: σ = 20 pA ms1/2. Green curves correspond to fit either by a Gaussian (top), or a
linear combination of a Gaussian and a decaying exponential (bottom).
Figure 8. Modeling the cellular mechanisms generating bursting activity in immature SACs. (A) Experimental investigation of the cellular mechanisms involved in bursting activity by6. Gray: Fast sub-threshold oscillations and subsequent AHP generated by a short pulse of current of amplitude 150 pA and duration 60 ms. Black: Blocking of all Ca2+ related channels by Cd2+. No oscillations are exhibited. (B) Simulating the experimental
conditions of 6 Gray: Reproducing fast sub-threshold oscillations and subsequent AHP emulating the
experiment of 6. Application of a current step pulse of 150 pA for 60 ms. Black: Oscillations disappear when Ca2+
www.nature.com/scientificreports/
We distinguished two classes of parameters. The first one consists of modeling parameters constraining the Morris-Lecar dynamics, namely V1, V2, V3, V4 (see Methods for the corresponding equations). We verified the
robustness of the scenario described in the paper when varying these parameters. Especially, V3 is the half
acti-vation potential of the fast potassium channels, playing a central role in SACs excitability as shown later in the text. The second class is the set of parameters constrained by biophysics such as conductances, reversal poten-tials, capacitance,... Most of them have been fixed based on the biophysical literature and are not considered to vary. Here, we choose to study the variation of 4 of these parameters: Itot, because it controls bursting, and gK, gC
and V3 because, as we show later, their variations allows us to reproduce experimental facts, that have not been
reproduced before by any model. The most striking consequence is a conjecture on the role of the potassium conductance during development.
Bifurcation analysis.
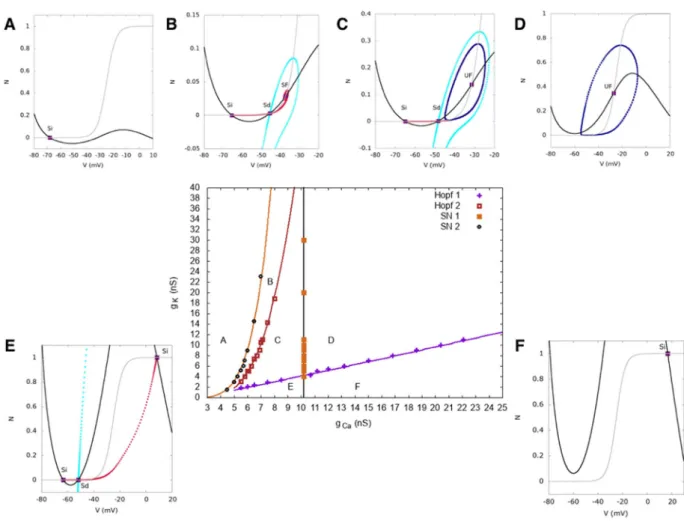
Bursting is an alternation between a rest state and repetitive firing, often modulated by slow voltage or Ca2+ dependent processes18. In order to address which are the biophysical mechanisms for a) triggering, and, b) sustaining bursting in immature SACs, we will perform bifurcations analysis. This is a pow-erful mathematical tool providing a compact, geometric representation, of dynamical systems behavior when Figure 9. Bifurcation diagram as a function of Itot, gK. At the bottom center, the bifurcation map is plotted.Points are sampling points obtained by a direct inspection of the phase portrait whereas continuous lines correspond to fit. “Hc” means “homoclinic bifurcation” and “SN” stands for “saddle-node”. The capital letters (A–E) inside correspond to the typical phase portraits surrounding the bifurcation map. In these phase portraits, continuous lines correspond to nullclines (NV, in black, is the V-nullcline whereas NN, in gray, is the
N-nullcline). ‘Si’ stands for ‘Sink’, ‘Sd’ for ‘Saddle’, ‘SF’ for ‘Stable Focus’ and ‘UF’ for ‘Unstable Focus’. Sink and stable focus correspond to stable rest state: a small perturbation about this state decay exponentially fast. On the opposite, saddle and unstable focus are unstable. For saddles we show the stable and unstable directions (black lines) as well as the stable (cyan) and unstable (red) manifolds Ws, Wu. ‘SPo’ means ‘Stable Periodic Orbit’. It
corresponds to fast oscillations, plotted in dark blue. In region (A), there is a low voltage stable state. In region (B), a stable state with low voltage coexists with a limit cycle (fast oscillations) separated by an unstable state. When the cell is in the low voltage state, a large enough perturbation (e.g. noise or other cells action) leads it to fast oscillations. In region (C), two stable states, one with low voltage and one with high voltage, coexist separated by an unstable point. In region (D), the cell only exhibits a fast oscillations regime, reached whatever the initial condition. Finally, in region (E), there is a stable state with high voltage. When varying parameters, continuous change occurs in the interior of a region (e.g. the period of oscillations continuously varies), whereas crossing the bifurcation lines leads to abrupt changes.
www.nature.com/scientificreports/
parameters are modified. While, in general, a continuous variation of a parameter induces a continuous variation of the dynamical system’s solutions, the variation of parameters around bifurcation points induces, in contrast, strong and abrupt changes in the dynamics.
We first perform a bifurcation analysis of the fast V, N dynamics in the presence of the current Itot, constant
in time, and used as a bifurcation parameter. The bifurcation diagram is represented in Fig. 2A (drawn using MATCONT29), where we have explored a wide range of variation of I
tot (−70 to +310 pA). For the analysis, we
consider an example with the potassium gK = 10 nS, and calcium conductance gC = 12 nS (see Robustness with
respect to parameters variations). We reveal a rich dynamical profile upon the variation of an external current where for Itot < −3.7 pA, stable rest state co-exists with unstable fixed points, for −3.7 < Itot < 250 pA, cell oscillates
constantly due to a limit cycle and for Itot > 250 pA only a stable rest state at a high voltage exists (see Fig. 2B). We
refer the reader to e.g.30 for the dynamical systems terminology used in the next paragraphs.
In more detail, when Itot⪅− .5 8 pA, there is a stable rest state with a membrane potential
∈ − −
Vrest [ 70, 60] mV, coexisting with two unstable fixed points, a saddle and an unstable focus (see Fig. 9A for the phase portrait of this case). When Itot− .5 8pA=IHc, there is an homoclinic bifurcation giving rise to a
stable limit cycle. In the range Itot∈[ ,I IHc SN1], where ISN1− .3 7 pA, the stable rest state coexists then with a stable limit cycle, corresponding to fast oscillations, and an unstable fixed point. When Itot=ISN1− .3 7 pA the stable rest state coalesces with the middle unstable branch and both disappear with a saddle-node bifurcation (SN1). For Itot>ISN1 the dynamics has only one attractor, the limit cycle, corresponding to fast oscillations. This
cycle eventually disappears by a Hopf bifurcation at Itot = 250 pA (Fig. 2). However, this value of external current
is quite beyond the range of plausible values during the bursting activity of SACs.
We observe that the rest state of SACs, corresponding to Itot = 0 pA, lies near a saddle-node bifurcation point
within a narrow region of a few pA, which is our main emerging hypothesis. This leads to important consequences for SACs described in the following.
Bifurcations analysis reveals two possible drives for triggering bursting. The bifurcations analysis for the fast sub-system shown in Fig. 2, reveals all possible dynamical regimes upon the variation of a constant external current within a wide interval of our choice. Thanks to the timescales separation in our model (fast, medium, slow), we make the approximation that the bifurcation diagram in Fig. 2A, does not change significantly when we consider the full model case. However, in the full model Itot is not constant, but time-dependent, driven by sAHP. By
superimposing the solution of the full model and the bifurcation diagram of the fast subsystem, we reveal how the trajectory driven by the slow variations of IsAHP matches the bifurcation diagram, in the plane (Itot, V). See Fig. 3
showing a zoom of the bifurcation diagram shown in Fig. 2A, to our regime of interest (stable branch: red, neutral Figure 10. (A) Pharmacological manipulations made by6 in order to restore bursting activity in rabbit
SACs at different ages. (B) Varying the potassium conductance gK and the half-activation potential V3
changes the excitability of SACs in our model. Blue: Modeling the bursting activity of isolated P4 SAC, gK = 8 nS, V3 = −16 mV. Green top: Modeling P8 isolated SACs where we see no bursting activity, gK = 10 nS,
V3 = −34 mV. Green bottom: Decreasing gK = 8 nS, V3 = −34 mV we restore oscillations. Red top: Modeling P22
coupled SAC where there is no bursting activity upon treatment with TEA. An inhibitory current Iext = −10 pA
is applied to coarsely mimic the inhibitory input to SAC at this stage of development. To account for the TEA application we take decrease the conductance gK = 4.5 nS (V3 = −35 mV). Red bottom: Restoration of bursting
at P22 by removing all inhibitory synaptic connections, Iext = 0 pA. Removing inhibition from mature amacrine
circuitry, along with blocking a subfamily of K+ channels with TEA, is enough to re-initiate bursting activity.
The values proposed here for V3, gK are only indicative, as the same behavior is observed in a wide range of
www.nature.com/scientificreports/
saddles: gray, unstable branch: pink, green traces showing the maximum and minimum of V along the limit cycle), with the superimposed trajectories of the full system (blue curves).
Analyzing how the slow variations of IsAHP generate bursting, we actually exhibit two possible drives of
trig-gering bursting:
(i) Dynamical drive, induced by the mere dynamics of neurons, without external influence. In our model, the joint fast dynamics of Ca2+ and K+ channels generates fast oscillations while the slow AHP, mediated by
Ca2+ gated K+ channels, modulates slow oscillations6. The conjunction of these two mechanisms generates bursting. Note that in this case, Iext = 0 in Eq. (1), meaning there is no external current (Fig. 3 left). In this
sce-nario, cells burst periodically, with a frequency controlled by the characteristic times τR, τS of variables R and
S respectively. From a dynamical systems perspective, there are two important bifurcations associated with bursting: a) bifurcation of the rest state that leads repetitive firing and b) bifurcation of a spiking attractor that Figure 11. Bifurcation diagram and heat map of τIBI in the plane V3 − gK. (a) In region A, there is a stable fixed
point with low voltage. In B, 2 stable fixed points coexist with a saddle-point. In C a stable fixed point with low voltage coincides with a stable periodic orbit giving rise to fast oscillations. In region D there are 4 fixed points (2 stable, 2 unstable) and a limit cycle. In region E there is a stable fixed point with low voltage and a stable fixed point whose position depends on gK and V3. In region F there are five fixed points, 2 stables. Region G contains 2
stable fixed point (a sink and a focus) separated by an unstable fixed point. Bursting takes place in regions C and D. (b) Heat map of the interburst interval τIBI. Same representation as Fig. 5. We sampled the plane gK, V3 with a
step of 0.25 nS on the gK axis and 1 mV on the V3 axis, explaining the irregular shape of the border. (c,d) There is
a discrepancy between the heat map and the bifurcation diagram: (i) The bifurcation map does not predict bursting for ∈gK [4, 5] nS, ∈ ∼ −V3 [ 40, 25]− mV whereas the heat map shows calcium peaks lasting more than 1 s in this region. This is due to the particular structure of the phase portrait of the Morris-Lecar model in this region and the effect of noise, as shown in (c). This phase portrait has two saddles (Sd) down (Sdd) and up
(Sdu), and two sinks (Si), down (Sid) and up (Siu). The unstable manifold (Wu, in red) of Sdd connects to Siu, on
the right, and to Sid, on the left; The unstable manifold of Sdu connects to Siu, on the right, and to Sid, on the left.
Thanks to noise, dynamics can leave Sid and reach Siu where it stays until sAHP rising drive it back to Siu. This is
illustrated by the blue trajectory (complete system with noise) which follows the unstable manifolds of the Morris Lecar model. The inset shows the trajectory of the voltage for the complete system in the presence of noise. (ii) (d) While the bifurcation diagram predicts bursting for V3 ~ −28 mV, gK ~ 12 nS, the heat map does
not show bursting in this region (black). This is again due to noise. When the cell is on low rest state (Si) noise drives it to the limit cycle, but after a few oscillations, noise drive the cell back to the rest state Sd (see inset for the voltage trajectory). This effect depends on the distance between the two fixed points Si, Sd, fixed by the model parameters, and on the noise intensity σ (here 4 pA ms12).
www.nature.com/scientificreports/
leads to a rest state18. There are two possible types of bifurcations linked to such type of behavior (1) Homo-clinic saddle-node bifurcation and (2) Hopf bifurcation. We have therefore shown that (1) holds in our case. The first bifurcation associated with the breaking of the rest state is the saddle-node bifurcation. The “spiking attractor”, here the limit cycle, is created by an homoclinisation. According to the classification of bursting made by Izhikevich in18, this corresponds to a “square-wave” point-cycle planar burster.
(ii) Noise-drive, induced by an external excitation, typically noise. In order to move to this regime, it suffices to add an external constant current Iext<ISN1= − .3 7pA to Eq. (1). Then, the deterministic dynamics converges towards a stable fixed point, the cell ends up in a steady rest state and cannot switch to rapid firing. In this case, the bifurcation diagram (Fig. 3 right) has now two fixed points: Vrest, which is stable
(purple point), and Vu which is unstable (intersection of the gray branch and the vertical blue line).
However, in the presence of noise, sufficiently close to the bifurcation point (depending on the noise amplitude), the random fluctuations around the rest state leads eventually the cell into the rapid firing regime (Fig. 3 right). Note that when Iext is sufficiently large in absolute value the total current Itot is smaller
than ISN1 whatever the (negative) value of IsAHP.
Taken together, since noise is always present in neurons, distinguishing those two scenarios for triggering bursting is not easy experimentally but still possible (see Discussion). Maybe both scenarios are possible in the same network of SACs, since it would correspond to a slight variability in the intrinsic parameters which control the rest state of each SAC, placing it on the right or left of the bifurcation within a narrow region (~10 pA accord-ing to our model). We are actually able to capture both the dynamically and the noise driven burstaccord-ing regimes in a single, unifying model. In the presence of noise the dynamically driven bursting regime still exists but the period has now random fluctuations. In fact, the noise smooths the transition between those 2 regimes. Also, what our analysis reveals is that, in the noise driven regime, bursting will occur only if the noise has a sufficiently large amplitude compared to the distance between the rest state and the bifurcation point. On the other hand, in the dynamically driven regime, bursting will occur only if the rest state is sufficiently close to the bifurcation in order for the amplitude of the negative sAHP current to be sufficient to compensate the depolarizing current (IC) and
enter the hyperpolarization phase. Otherwise, if the rest state is further on right from the bifurcation, SACs would exhibit only a repetitive firing regime without hyperpolarization. In other words, in both regimes, the cell has to be close enough to the bifurcation point to observe bursting.
Figure 12. Bifurcation diagram as a function of gC, gK in the dynamically driven bursting regime. Same
www.nature.com/scientificreports/
Bifurcations analysis reveals a biophysical mechanism for SACs sustained bursting. Our analysis reveals also a possible biophysical mechanism to explain how bursting activity is sustained periodically in immature SACs. Once fast repetitive firing is elicited in SACs, either through i) dynamical, or ii) noise drive, the biophysical cyclic mechanism which produces bursting is the same. From the bifurcation analysis we see that once the cell crosses the saddle-node SN1, it is firing rapidly (limit cycle). Being in a high voltage state, Ca2+ loads, leading to a slow
rise of sAHP conductance. This corresponds, in the bifurcation diagram, to a motion towards negative current values, with a slow variation due to the sAHP conductance driven by the slow variable R, and fast oscillations due the fast variable V − VK appearing in the sAHP current IsAHP = −gsAHPR4(V − VK). As revealed by a bifurcation
analysis where the sAHP conductance is the bifurcation parameter (not shown), and as shown in Fig. 3, these fast oscillations have no effect on the bifurcation, what matters is the slow variation. The increase of sAHP conduct-ance continues until the cell reaches the homoclinic bifurcation where rapid firing stop. Itot = IsAHP is very negative
now, leading to the hyperpolarization phase. Then, because voltage is low, [Ca2+] decreases and I
sAHP drops down.
Eventually, SAC crosses the SN1 bifurcation point and starts firing again either due to dynamics in one case or
noise. This is illustrated in Fig. 3. The deep blue traces are the trajectory of a burst in the plane (Itot = IsAHP, V), for
the full system. One sees in particular the fast oscillations coming from the fast variable V − VK.
Nevertheless, for both proposed scenarios the biophysical mechanism for sustaining bursting is the same. Although the conclusion drawn on the model is entirely based on a mathematical analysis via bifurcation theory, we have sketched the main mechanism of SACs bursting in Fig. 4, for readers not familiar with bifurcation theory. Note that Fig. 4 is only qualitative. In contrast, bifurcation analysis gives us more insights on bursting mechanism, where actually two regimes are possible, and quantitative results, especially on the parameters determining the transitions inducing bursting and the range of these parameters. To our best knowledge this is the first model able to provide a mechanism to account for the repetitive firing of SACs, which is the condition under which calcium controls the after-hyperpolarization phase.
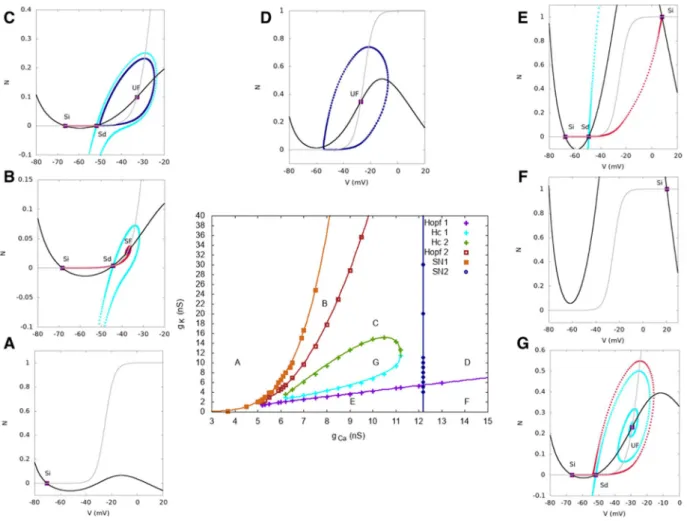
Figure 13. Bifurcation diagram as a function of gC, gK in the noise driven bursting regime. Same representation
as Fig. 9. In region (A), there is a unique stable rest states with low voltage. In region (B) two stable rest state with low voltage coexist separated by an unstable point; hence dynamics is bistable. In region (C), a stable rest state with low voltage coexists with a limit cycle (fast oscillations) separated by an unstable state. When the cell is in the low voltage rest state, a large enough perturbation leads it to fast oscillations. In region (D) the cell only exhibits a fast oscillations regime, reached whatever the initial condition. In region (E) two stable rest states, one with low voltage and one with high voltage, coexist separated by an unstable point. Region (F) has only one high voltage stable rest state. Finally, in region (G), there is a low voltage rest stable state.
www.nature.com/scientificreports/
explaining the wide range of interburst intervals (IBI) across species by a unique mechanism.
Spontaneous bursting activity in immature SACs has been consistently observed across various species i.e. mice, rabbits, chicks, turtles, macaques etc., although, the measured mean interburst interval (τIBI) strongly varies1–4.This experimental observation raises the question whether there exist several bursting mechanisms changing from species, explaining these variations in interburst. Bifurcations theory provides another explanation though. As we showed, in our model, bursting involves a saddle-node bifurcation. It is also known from31, that interburst is known to be sensitive to parameters variations near this type of bifurcation. In Fig. 5, we illustrate this effect by numerically computing the heat map of the mean interburst intervals of SACs, while varying the parameters gK
and gC, for both bursting scenarios (noise and dynamic driven). We show that the IBI increases when approaching
the Saddle-Node line. Note that we define a burst numerically by a thresholding on Ca2+: a burst occurs when this
concentration exceeds 150 nM during a time larger than 1 s. There is a “critical” region (yellow zone) where inter-burst increases (up to several minutes). This is nicely explained by a bifurcation analysis (see section Robustness with respect to parameters variations). The irregular shape of this region - alternation between yellow and black regions - is due to our numerical procedure. We generate 20 trajectories of duration 2000 s and count the num-ber of bursts in each trajectory. In our simulation, when going close to the critical region we observe that this sampling is not sufficient; we have rare bursts giving poor statistics, and, in some cases (black regions in-between yellow ones), we observe no burst in the sample.
To illustrate the sensitivity of τIBI to a parameter variation, we now vary the external current Iext (Fig. 6). This
indeed induces strong variations in τIBI, compatible with the variations observed across species, which increases
monotonously and sharply as Iext decreases, following a hyperbola whose form has been derived analytically (see
Methods and Fig. 6, blue trace). As shown in the paper31, hyperbola is one of the 2 possibilities, corresponding to the case where the noise amplitude is small compared to the excitability. We also observe a sharp transition from a bursting to a non-bursting regime, where τIBI = 0, which corresponds to the loss of SACs excitability.
Based on the shape of our theoretical curve, we show that τIBI exhibits a strong asymptotic behavior around a
very narrow regime of Iext= ∈ −[ 5, 0] pA. The analytic form of the function τIBI = f(Iext) is the following (see
Methods for detailed derivation):
I I K I I I I 0, ; , ; (9) IBI ext c ext c ext c τ = ≤ − >
(where K = 0.657 s pA21 and Ic = −5 pA, for σ = 4 pA ms1/2, gK = 10 nS, gC = 12 nS). The values K, Ic are obtained from fit. Note that for Iext ≤ Ic, τIBI is not defined because neurons do not burst anymore.
This result suggests that, depending on slight variations of physiological conditions, a SAC could exhibit very variable bursting periods, providing an explanation how different species exhibit variability in the interburst inter-val of immature SACs. In real SACs, the inhibitory current Iext could correspond to a change in the intrinsic
inhib-itory ionic currents of individual SAC or to external inhibinhib-itory inputs from other layers of the retina. It could also mimic changes in synaptic inhibition (e.g. GABAA maturation, changes in [Cl]in). These factors could drive the
disappearance of bursting activity and subsequently the loss of SACs excitability. On the other hand, an increase of Iext leads to a gradual decrease of τIBI towards zero, meaning that in this regime of parameters, SACs tend to burst
repeatedly, without a refractory period. This scenario is not observed under normal physiological conditions, but could be tested experimentally by varying Iext as an externally applied current. Finally, in the experimental paper32,
it is found that the bursting period increases upon maturation (experiment in P1–P2 rabbit SAC). In light of the present model-driven analysis, this could be linked to a change of intrinsic properties of SACs during development. To compare with experimental results, we show in the same figure τIBI for different species as found in the
lit-erature (Fig. 6). We have not been able to find τIBI for turtles and chicks. We found the mean inter-wave intervals
τIWI instead. In order to extrapolate to τIBI in these cases, we used a common constant scaling factor of 3, based
on the ratio between τIBI and τIWI for rabbits and mice found in6 and21 respectively. Besides this narrow regime a
decrease of Iext results in a sharp disappearance of bursting activity, which means that bursting activity stops after
a limit value.
To conclude, our study suggests that bursting activity in immature SACs could share a common mechanism across species. The same mechanism could also induce interburst variability within a network SACs, thus with cells bursting with a different period. Such variability has been implemented in21 by varying the decay time of the sAHP from a Gaussian distribution. In our case, the variability arises without adding an extra mechanism and is induced by the hyperbolic behavior observed near a saddle-node bifurcation upon a tiny variation of a single parameter, Iext, interpreted as an effective depolarizing/hyperpolarizing current. Taken together, the vast
variabil-ity of SACs bursting features accross different species, could be explained simply by our hypothesis that the rest state of SACs lie within a narrow regime around a saddle-node bifurcation point.
Characterizing the effect of noise on the probability distribution of bursts. In6, recordings show that the bursting periods of SACs are not regular and have a certain probability distribution. We obtain this effect by adding the noise ξ to the dynamics of the voltage V (see Eq. (1)). Note that noise is always present in real neurons due e.g. to fluctuations in ionic currents from the random opening of ionic channels. What we want to illustrate here is the role played by the intensity of this noise, controlled by the parameter σ. For small σ, dynamics has fluctuations around the deterministic trajectory with little effects during the bursting phase. In contrast, low additive noise during the slow (after-hyperpolarization) dynamics, is enough to accelerate the start of a burst. For higher values of σ the bursting period of cells decreases dramatically. As shown in Fig. 7 the presence of noise has also a drastic impact on the shape of the interbursts intervals distribution.
www.nature.com/scientificreports/
Experimentally, maybe due to the lack of sufficiently large samples in6, the exact shape of the distribution of the interburst intervals is not sharply defined. Therefore, the comparison with our theoretical results is difficult. However, the experimental distribution obtained by these authors is definitely not exponential. As we observe an exponential distribution for large enough σ values, Fig. 7, this remark provides us with an upper bound on the level of noise which should be no greater than 8 pA ms1/2. Note that the left-wise peak in the bimodal distribution
(σ ~ 8 pA ms1/2), corresponds to short bursts. Similar bursts have been observed in the spontaneous activity of
retinal ganglion cells during waves, in turtle and in mouse, see e.g. control in Figs 3 and 7 in4 (E. Sernagor private communication).
the role of the fast potassium conductance in bursting activity.
We now address in further detail the potential role of the fast voltage-gated potassium channels used in our model to produce bursting (see also the work of E. Marder and collaborators, in a different context33). Zheng et al.6 propose that the ionic channels mainly involved in the bursting activity of SACs during early development are voltage-gated Ca2+ channels. Inthis work the hyperpolarizing current involved is not characterized and these authors don’t mention potassium channels before the end where they perform experiments with TEA (see below for more details). We proposed above fast voltage-gated K+ channels as a source of fast inhibition necessary for the active phase of bursting of
SACs. We now justify this claim based on several experiments made by Zheng et al., interpreted in the context of our bifurcation analysis.
We first show (Fig. 8) how our model accurately reproduces a key experiment of 6. Here, the authors artificially control the triggering of fast oscillations by applying a short current pulse (Iext = 150 pA for 60 ms) to individual
immature SACs. Also, upon the pharmacological application of Cd2+, which blocks all Ca2+ related channels
(voltage-gated Ca2+ and sAHP), they show that no oscillatory activity is triggered upon stimulation, but only a
raise in the plateau of the level of the voltage. The corresponding figure of their experiment in the paper6 has been reproduced in Fig. 8A (with the kind authorization of the authors). As shown in Fig. 8B, we are able to reproduce reliably this result using the fast K+ channels described in Eq. (3). Particularly, we are able to simulate the
emer-gence of fast oscillations during a short current pulse, with an AHP phase after the end of the pulse (see gray curve in Fig. 8B). We emulate as well the disappearance of the oscillations observed by these authors, upon blocking all Ca2+ related channels (voltage-gated Ca2+ and sAHP), by setting, in our model, the corresponding conductances
to zero (see black curve in Fig. 8B).
This is interpreted as follows from the bifurcation diagram Fig. 9, in the plane Itot, gK. The simulation has been
done in the noise driven bursting regime where the cell, initially in its rest state, is in region A. A pulse of current Iext = 150 pA drives the cell in region D where it fast spikes. Removing the current pulse drives back the cell in
region A. Here we observe a small sAHP hyperpolarizing the cell. In order to observe the same behavior in the dynamically driven bursting regime, one needs to clamp the voltage so as to maintain the cell in the rest state.
These observations support therefore our proposition that the hyperpolarizing component of the fast oscilla-tions observed in immature SACs are driven by fast voltage-gated K+ channels.
exploring the role of the potassium conductance in the loss of sACs excitability upon maturation.
SACs in the retina of vertebrates lose their ability to spontaneously burst once they reach a certain stage of devel-opment different for each species. This transient excitability is a key process in the developing retina and the shaping of the visual system. It is not yet clear which physiological properties of SACs change upon maturation causing the abrupt change from autonomous bursting to rest state. So far, to our best knowledge, no experiment has studied in detail the biophysical properties of immature SACs at the level of each ionic channels involved during this window of development. However, there are some indirect experimental implications which help us extrapolate a possible scenario on how SACs change their properties upon maturation. In20 Ozaita et al. show that mature SACs not only stop bursting but also cannot be depolarized beyond −20 mV. A specific type of inhibitory voltage gated K+ channels, Kv3, is responsible for this property, providing an electric shunt to SACs somas. In the
contrary, in the developing retina, SACs are autonomous bursters, depolarised beyond mature SACs (~−5 mV)6. Therefore, upon maturation, the characteristics of voltage gated K+ channels evolve, leading to a drastic change
in SACs activity. In our model, these observations can be reproduced by the variation of two parameters; (i) the conductance gK and (ii) the half-activation potential V3 of the voltage gated K+ channels.
Here a point of caution is necessary. The modeling chosen here, in the same spirit as Morris-Lecar or Hodgkin-Huxley model, characterizes the behavior of a small piece of a cellular membrane, large enough to contain many ionic channels so that the description in terms of activity variables (N, R, S) is correct. As a con-sequence, parameters such as gK, V3 are phenomenological, depending on membrane characteristics (e.g. the
density of ionic channels of a given type), and on channels characteristics. When we vary a parameter such as V3, it means that we mathematically change the threshold of the term mimicking fast-K channels in the model.
The biophysical interpretation of this variation is more difficult. The easiest interpretation is that it corresponds to a change of threshold response of the corresponding channels, but other explanations could be also possible. Assume for example that there are two types of fast K+ channels (e.g. kV3.1 and kV3.2) on the membrane, with
different densities and reactivity. Then, a mere change of their density during development would impact the value of the phenomenological parameters gK, V3 of our model.
With our model, we are able to reproduce an experiment by Zheng et al.6. The results of their experiment are shown in Fig. 10, left column (with the kind authorization of the authors), whereas the model results are presented in Fig. 10, right column. Our results are based on a bifurcation analysis in the plane V3 − gK, which
reveals a wide region of parameters where bursting takes place. In Fig. 11 we show, on the top left, the bifurcation diagram in the plane V3, gK and on the top right, a heat map, similar to Fig. 5). This map makes easier the
www.nature.com/scientificreports/
• How does SACs autonomous bursting stop? Zheng et al. consider first isolated SACs (all synaptic connections are inactivated with a pharmacological cocktail). While SACs are bursting spontaneously (i.e. without the influence of the other cells) at P4 (first row, left in Fig. 10), this spontaneous activity disappears at P6 (second row, left). We can easily reproduce this observation (Fig. 10, first and second row, right) by moving from region C (fast oscillations) in the bifurcation diagram of Fig. 11 to another region. For example, a simple tran-sition to region A is obtained by decreasing the half-activation potential V3 of the fast K+ channels, leading to
the saturation of SACs depolarization below −20 mV observed in mature SACs. A concomitant variation of gK
is also possible leading to stop bursting as well. To illustrate this scenario, we set gK = 10 nS and V3 = −34 mV
as an indicative example (see Fig. 10).
• How can bursting be restored in further mature SACs? Zheng et al.6 show that bursting activity can be re-in-itiated pharmacologically in P8 (stage III) and P22 retinas with chemical agents upon i) blocking all syn-aptic connections (gap junctions, cholinergic, gabaergic and glutamatergic synapses), especially inhibition by applying an antagonist cocktail and ii) decreasing the conductance of the fast inhibitory K+ channels, by
applying tetraethylammonium (TEA). This suggests that upon maturation, bursting is in fact suppressed by alterations in the intrinsic properties of individual SACs. Particularly, in the same preparation (P8 isolated SACs), the authors apply a voltage-gated K+ channel blocker tetraethylammonium (TEA), which results in
restoring bursting activity in isolated mature SACs (Fig. 10, third row, left). A potential type of potassium channels involved is the TEA -sensitive K+ of the Kv
3 family. Therefore, this experiment emphasizes once
again the potential role of fast potassium channels and especially the Kv3 family. We mimic the blocking
of these channels in our model by decreasing the conductance gK. When gK is small enough, we reproduce
the bursting restoration (Fig. 10, third row, right). This example corresponds, in Fig. 11, to a motion from (gK, V3) = (10 nS, −34 mV) (region B) to (gK, V3) = (8 nS, −34 mV) (region C). Note that the chosen value
V3 = −34 mV allows us to fix the maximal depolarization to −20 mV, the value observed by Ozaita et al.20
for further mature SACs. Remark also that the lower branch of the heat map Fig. 11 (region between G and B in the bifurcation map) corresponds to interburst intervals of the order of 8–16 min, so according to SACs recording not to a biophysically plausible bursting regime.
• How can bursting be restored in adult SACs? Upon further maturation, Zheng et al. show that the restoration of bursting in P22 SACs (late stage III-before eye-opening) depends on the interplay between the change of the intrinsic properties of K+ channels strong inhibition (TEA application) and blocking the strong inhibitory
(gabaergic) input induced by other amacrine cells at this phase (Fig. 10, fourth and fifth row, left). Neither of these conditions suffice alone for the bursting restoration. To model the gabaergic inhibitory input to coupled SACs at P22, we add an inhibitory current Iext = −10 pA whereas the effect of TEA is modeled by decreasing
the gK conductance to 4.5 nS. This conductance is not set to 0 because TEA blocks only one subtype of Kv3
channels while there exist several of them (see below) in the developing retina. The whole operation has the effect of suppressing bursting (red trace top) and corresponds moving from region B to region A in Fig. 9. Bursting re-initiation is obtained by setting back the current Iext to zero.
Along these lines, we have been able to reproduce the effects of the pharmacological manipulation performed by Zheng et al. at the three separate ages; P4, P8 and P22 in Fig. 10.
Taken together, during development, SACs exhibit a transient bursting activity which is lost upon maturation. In the context of our bifurcation analysis, this process is interpreted as follows: immature SACs rest state lies close to a bifurcation point in order to facilitate the bursting activity which is essential for the generation of retinal waves and the shaping of the visual system. Upon maturation and once this functionality is no further useful for the retinal circuitry, we predict that SACs rest state is naturally driven towards the stable branch (further left in Fig. 2A), away from the bifurcation point, where bursting generation is no longer possible (we remind that noise could drive the cell to cross the bifurcation but, the further away, the less biophysically plausible this scenario is regarding the noise amplitude). In our model, this essentially corresponds to adding a hyperpolarizing (negative) current as an input. For identifying the source of such current, we propose a conjecture on the possible role of the Kv3 potassium channels during development, based on our analysis, which could reveal a mechanism of how
SACs lose their excitability.
A conjecture on the role of the Kv
3channels in the loss of sACs excitability upon maturation.
We predict that bursting occurs in immature SACs, during a certain age window while fast potassium channels are under-expressed. Upon development, we make the hypothesis that potassium channels increase their expres-sion and spontaneous bursting stops when the hyperpolarizing K+ dominate the dynamics over the depolarizingCa2+ channels. Also, we suggest that upon maturation, the half activation potential V
3 decreases in order to
provide a saturation in mature SACs activity as shown in20. This theoretical prediction could be experimentally tested, by following the expression of the fast K+ channels in SACs during development and showing a potential
increase of their activity along maturation (see discussion section). Moreover, we propose that the fast voltage gated K+ channels involved is the Kv
3 family. More specifically, two subtypes of fast voltage gated K+ channels
have been identified19,20, both belonging to the Kv
3 family: i) IK delayed rectifier currents, sensitive to TEA
(tetra-ethylammonium) emitted by subunits Kv3.1 and Kv3.2 and ii) IA A-type currents, sensitive to 4-amino- pyridine
(4AP), emitted by subunits Kv3.3 and Kv3.419 which are not sensitive to TEA. The apparition and evolution of such
channels in SACs during development has not been studied yet. However, in the experiment of6, the application of TEA in immature SACs (rabbit ~ P8) was crucial to the re-initiation of bursting activity. This finding implies that, during development TEA sensitive K+ channels are already expressed in SACs. On this basis, we propose that the
specific type of K+ channels responsible for the spontaneous bursting activity during development and eventually