HAL Id: insu-02052254
https://hal-insu.archives-ouvertes.fr/insu-02052254
Submitted on 28 Feb 2019
HAL is a multi-disciplinary open access
archive for the deposit and dissemination of
sci-entific research documents, whether they are
pub-lished or not. The documents may come from
teaching and research institutions in France or
abroad, or from public or private research centers.
L’archive ouverte pluridisciplinaire HAL, est
destinée au dépôt et à la diffusion de documents
scientifiques de niveau recherche, publiés ou non,
émanant des établissements d’enseignement et de
recherche français ou étrangers, des laboratoires
publics ou privés.
in the Arctic
Jonathan Abbatt, W. Richard Leaitch, Amir A. Aliabadi, Allan Bertram,
Jean-Pierre Blanchet, Aude Boivin-Rioux, Heiko Bozem, Julia Burkart,
Rachel Y. W. Chang, Joannie Charette, et al.
To cite this version:
Jonathan Abbatt, W. Richard Leaitch, Amir A. Aliabadi, Allan Bertram, Jean-Pierre Blanchet, et
al.. Overview paper: New insights into aerosol and climate in the Arctic. Atmospheric Chemistry
and Physics, European Geosciences Union, 2019, 19 (4), pp.2527-2560. �10.5194/acp-19-2527-2019�.
�insu-02052254�
https://doi.org/10.5194/acp-19-2527-2019 © Author(s) 2019. This work is distributed under the Creative Commons Attribution 4.0 License.
Overview paper: New insights into aerosol and climate in the Arctic
Jonathan P. D. Abbatt1, W. Richard Leaitch2, Amir A. Aliabadi3, Allan K. Bertram4, Jean-Pierre Blanchet5, Aude Boivin-Rioux6, Heiko Bozem7, Julia Burkart8, Rachel Y. W. Chang9, Joannie Charette6, Jai P. Chaubey9, Robert J. Christensen1, Ana Cirisan5, Douglas B. Collins10, Betty Croft9, Joelle Dionne9, Greg J. Evans11, Christopher G. Fletcher12, Martí Galí13, Roghayeh Ghahremaninezhad2, Eric Girard5,†, Wanmin Gong2, Michel Gosselin6, Margaux Gourdal13, Sarah J. Hanna4, Hakase Hayashida14, Andreas B. Herber15, Sareh Hesaraki16, Peter Hoor7, Lin Huang2, Rachel Hussherr13, Victoria E. Irish4, Setigui A. Keita5,
John K. Kodros17, Franziska Köllner7,18, Felicia Kolonjari2, Daniel Kunkel7, Luis A. Ladino19, Kathy Law20, Maurice Levasseur13, Quentin Libois5, John Liggio2, Martine Lizotte13, Katrina M. Macdonald11,
Rashed Mahmood14,21, Randall V. Martin9, Ryan H. Mason4, Lisa A. Miller22, Alexander Moravek1, Eric Mortenson14, Emma L. Mungall1, Jennifer G. Murphy1, Maryam Namazi23, Ann-Lise Norman24, Norman T. O’Neill16, Jeffrey R. Pierce17, Lynn M. Russell25, Johannes Schneider18, Hannes Schulz15,
Sangeeta Sharma2, Meng Si4, Ralf M. Staebler2, Nadja S. Steiner22, Jennie L. Thomas20,26, Knut von Salzen21,
Jeremy J. B. Wentzell2, Megan D. Willis27, Gregory R. Wentworth28, Jun-Wei Xu9, and
Jacqueline D. Yakobi-Hancock29
1Department of Chemistry, University of Toronto, Toronto, Canada 2Environment and Climate Change Canada, Toronto, Canada 3School of Engineering, University of Guelph, Guelph, Canada
4Department of Chemistry,University of British Columbia, Vancouver, Canada
5Department of Earth and Atmospheric Sciences, Université du Québec à Montréal, Montréal,Canada 6Institut des sciences de la mer de Rimouski, Université duQuébec à Rimouski, Rimouski, Canada 7Institute for Atmospheric Physics,Johannes Gutenberg University, Mainz, Germany
8Aerosol Physics & Environmental Physics, University of Vienna, Vienna, Austria 9Department of Physics and Atmospheric Science, Dalhousie University, Halifax, Canada 10Department of Chemistry, Bucknell University, Lewisburg, USA
11Department of Chemical Engineering and Applied Chemistry, University of Toronto, Toronto, Canada 12Department of Geography and Environmental Management, University of Waterloo, Waterloo, Canada 13Department of Biology,Université Laval, Québec City, Canada
14School of Earth and Ocean Sciences, University of Victoria, Victoria, Canada
15Alfred Wegener Institute, Helmholtz Centre for Polar and Marine Research, Bremerhaven, Germany 16Centre d’Applications et de Recherches en Télédétection, Université de Sherbrooke, Sherbrooke, Canada 17Department of Atmospheric Science, Colorado State University, Fort Collins, USA
18Particle Chemistry Department, Max Planck Institute for Chemistry, Mainz, Germany 19Centro de Ciencias de la Atmósfera, Universidad Nacional Autónoma de México,
Ciudad Universitaria, México City, Mexico
20ATMOS/IPSL, Sorbonne Université, UVSQ, CNRS, Paris, France
21Canadian Centre for Climate Modelling and Analysis, Environment and Climate Change Canada, Victoria, Canada 22Institute of Ocean Sciences, Fisheries and Oceans Canada, Sidney, Canada
23Department of Mathematics, University of Isfahan, Isfahan, Iran
24Department of Physics and Astronomy, University of Calgary, Calgary, Canada
25Scripps Institution of Oceanography, University of California, San Diego, La Jolla, USA 26Université de Grenoble Alpes, CNRS, IRD, IGE, Grenoble, France
27Lawrence Berkeley National Laboratory, Berkeley, USA 28Alberta Environment and Parks, Edmonton, Canada 29National Research Council, Ottawa, Canada
†deceased
Correspondence: Jonathan P. D. Abbatt (jonathan.abbatt@utoronto.ca) and W. Richard Leaitch (leaitchs@gmail.com) Received: 19 September 2018 – Discussion started: 12 October 2018
Revised: 1 February 2019 – Accepted: 11 February 2019 – Published: 28 February 2019
Abstract. Motivated by the need to predict how the Arc-tic atmosphere will change in a warming world, this arArc-ticle summarizes recent advances made by the research consor-tium NETCARE (Network on Climate and Aerosols: Ad-dressing Key Uncertainties in Remote Canadian Environ-ments) that contribute to our fundamental understanding of Arctic aerosol particles as they relate to climate forcing. The overall goal of NETCARE research has been to use an in-terdisciplinary approach encompassing extensive field ob-servations and a range of chemical transport, earth system, and biogeochemical models. Several major findings and ad-vances have emerged from NETCARE since its formation in 2013. (1) Unexpectedly high summertime dimethyl sulfide (DMS) levels were identified in ocean water (up to 75 nM) and the overlying atmosphere (up to 1 ppbv) in the Cana-dian Arctic Archipelago (CAA). Furthermore, melt ponds, which are widely prevalent, were identified as an important DMS source (with DMS concentrations of up to 6 nM and a potential contribution to atmospheric DMS of 20 % in the study area). (2) Evidence of widespread particle nucleation and growth in the marine boundary layer was found in the CAA in the summertime, with these events observed on 41 % of days in a 2016 cruise. As well, at Alert, Nunavut, particles that are newly formed and grown under conditions of mini-mal anthropogenic influence during the months of July and August are estimated to contribute 20 % to 80 % of the 30– 50 nm particle number density. DMS-oxidation-driven nucle-ation is facilitated by the presence of atmospheric ammonia arising from seabird-colony emissions, and potentially also from coastal regions, tundra, and biomass burning. Via ac-cumulation of secondary organic aerosol (SOA), a signifi-cant fraction of the new particles grow to sizes that are active in cloud droplet formation. Although the gaseous precursors to Arctic marine SOA remain poorly defined, the measured levels of common continental SOA precursors (isoprene and monoterpenes) were low, whereas elevated mixing ratios of oxygenated volatile organic compounds (OVOCs) were in-ferred to arise via processes involving the sea surface micro-layer. (3) The variability in the vertical distribution of black carbon (BC) under both springtime Arctic haze and more pristine summertime aerosol conditions was observed. Mea-sured particle size distributions and mixing states were used to constrain, for the first time, calculations of aerosol–climate interactions under Arctic conditions. Aircraft- and ground-based measurements were used to better establish the BC source regions that supply the Arctic via long-range
trans-port mechanisms, with evidence for a dominant springtime contribution from eastern and southern Asia to the middle troposphere, and a major contribution from northern Asia to the surface. (4) Measurements of ice nucleating particles (INPs) in the Arctic indicate that a major source of these particles is mineral dust, likely derived from local sources in the summer and long-range transport in the spring. In addition, INPs are abundant in the sea surface microlayer in the Arctic, and possibly play a role in ice nucleation in the atmosphere when mineral dust concentrations are low. (5) Amongst multiple aerosol components, BC was observed to have the smallest effective deposition velocities to high Arctic snow (0.03 cm s−1).
1 Introduction
Rapid changes in the Arctic environment including rising temperatures, melting sea ice, elongated warm seasons, and changing aerosol and trace gas long-range transport patterns (IPCC, 2013) are driving a growing interest in developing a better understanding of the processes that control Arctic cli-mate. Furthermore, because high-latitude climate change is a bellwether for change on a global scale, it is particularly im-portant to understand the feedbacks that lead to amplification of Arctic warming (Serreze and Barry, 2011).
This article discusses key discoveries that have been made in climate-related Arctic aerosol research by the NETCARE (Network on Climate and Aerosols: Addressing Key Un-certainties in Remote Canadian Environments) research net-work. Formed in 2013, NETCARE consists of Canadian academic and government researchers along with interna-tional collaborators. Given the highly diverse nature of inter-related earth system processes that couple within the Arc-tic environment, the network is necessarily interdisciplinary, consisting of climate and air quality modellers, atmospheric chemists, aerosol and cloud physicists, biological and chemi-cal oceanographers, biogeochemists, and remote sensing ex-perts. Over the past 6 years, the network has conducted a set of field campaigns and modelling projects focused on the sources and loss mechanisms of atmospheric particles, their chemical and optical characteristics, and their role in climate. The field studies were conducted using a variety of plat-forms including the Alfred Wegener Institute’s Polar 6 air-craft (Herber et al., 2008), the research icebreaker Canadian Coast Guard Ship (CCGS) Amundsen, and the Dr. Neil
Triv-Table 1. NETCARE Arctic field campaigns.
Date Location(s) Platform
2014 (July–August) Canadian Arctic Archipelago ship – CCGS Amundsen 2014 (July) Resolute Bay, Nunavut airborne – Polar 6
2014 (March–July) Alert, Nunavut ground – Dr. Neil Trivett Global Atmosphere Watch Observatory 2015 (April) Longyearbyen, Alert, Eureka, Inuvik airborne – Polar 6
2016 (July–August) Canadian Arctic Archipelago ship – CCGS Amundsen 2016 (March, June–July) Alert, Nunavut ground – Dr. Neil Trivett Global
Atmosphere Watch Observatory
ett Global Atmosphere Watch Observatory at Alert, Nunavut (hereafter, Alert). Table 1 and Fig. 1 present the locations and dates of the field studies. The modelling studies used the Canadian Atmospheric Global Climate Model (CanAM; von Salzen et al., 2013), the GEOS-Chem chemical transport model with associated microphysics module TOMAS (Croft et al., 2016b), Environment and Climate Change Canada’s GEM-MACH chemical transport model (Moran et al., 2010), coupled ice–ocean biogeochemistry models in 1-D and 3-D configurations (Hayashida et al., 2018; Mortenson et al., 2018), and the Lagrangian particle dispersion model FLEX-PART (Stohl et al., 2005). The overall goals of the network have been to study the nature of fundamental biogeochemical and physical processes that connect aerosol to climate in en-vironments that vary from pristine to polluted, such as those found in the Arctic, in order to use this new understanding to improve the accuracy of the different modelling approaches used to simulate climate in these environments.
The network’s output is documented through a spe-cial issue across three journals: Atmospheric Chem-istry and Physics; Biogeosciences; and Atmospheric Mea-surement Techniques (https://www.atmos-chem-phys.net/ special_issue835.html; Bopp et al., 2014), of which this ar-ticle is a part. NETCARE has also produced a number of publications in other journals. All of the NETCARE atmo-spheric measurements are in a publicly available archive at https://open.canada.ca (last access: 16 February 2019). The specific goal of this overview paper is to synthesize the re-sults from NETCARE and to act as a gateway into the more detailed results described within the special issue and else-where.
Written for a scientist interested in the fields of Arctic climate, atmospheric chemistry, and biogeochemistry, this article starts with a background on Arctic aerosol that is not focused on NETCARE results (Sect. 2). For additional background information, the reader is referred to Quinn et al. (2006, 2008), Law and Stohl (2007), and Willis et al. (2018). The article then presents new insights into the three topics around which NETCARE was structured: marine processes and the Arctic atmosphere (Sect. 3); the sources, sinks, and properties of Arctic aerosol (Sect. 4); and ice
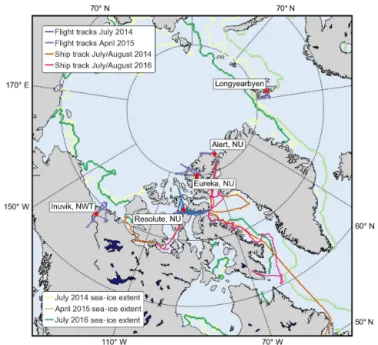
Figure 1. Map of the Arctic indicating NETCARE field work lo-cations, including the ground station (Alert), CCGS Amundsen ship tracks in the summers of 2014 and 2016, and Polar 6 aircraft flights in summer 2014 (based out of Resolute Bay) and in spring 2015 (based out of Longyearbyen, Alert, Eureka, and Inuvik).
nucleating particles (INPs; Sect. 5). Each of these sections stands alone, so that the interested reader can focus their at-tention on a specific subject. However, there are clear con-nections between the different topics. For example, Sect. 3 (Marine processes and the summertime Arctic atmosphere) is motivated by the increasing marine impact that is arising as sea ice melts and focuses on new NETCARE Arctic mea-surements of dimethyl sulfide (DMS), ammonia, and oxy-genated volatile organic carbon species. The oceans are an important source of such reactive gases to the atmosphere, leading to direct impacts on aerosol particles and ultimately on climate. Those connections are made in Sect. 4 (Arctic aerosol: sources, sinks, and properties), which presents in-sights gleaned for the summertime environment, when these marine emissions can lead to new particle formation and growth, and discusses the impacts of this aerosol on clouds.
Section 4 also presents results from the Arctic haze spring-time period, where the emphasis is on the sources of parti-cles, their optical properties, and the potential for direct ra-diative forcing. Section 5 (Ice nucleating particles) addresses the select fraction of atmospheric particles that nucleate ice crystals. Section 6 concludes the article by discussing re-maining research uncertainties and future priorities.
2 Background on Arctic aerosol
Over the last half century, our knowledge of Arctic aerosol and its role in climate has advanced from almost nothing to a clear understanding of its importance, although important questions remain regarding mechanistic details. This short section of the paper presents a comprehensive description of the field, leaving the recent NETCARE results for later sec-tions.
Following early observations of visibility-reducing haze particles in the spring Arctic atmosphere (Greenaway, 1950), study of Arctic haze began in earnest in the 1970s (Holm-gren et al., 1974; Rahn and Heidam, 1981). Investigations intensified through the 1980s, with observations (ground-based and airborne) and meteorological analyses indicating that haze particles were transported from mid-latitude pollu-tion sources, often in layers that reached up to the tropopause, and that their concentrations increased in winter and spring due to efficient meridional transport and low rates of wet de-position (Barrie, 1986; Barrie and Hoff, 1985; Brock et al., 1989; Leaitch et al., 1989; Radke et al., 1984; Schnell and Raatz, 1984; Shaw, 1982).
Through the 1990s and beyond, concentrations of Arctic haze components declined at the northernmost observatories: Alert, Nunavut; Barrow, Alaska; Mount Zeppelin, Svalbard; and Station Nord, Greenland (Heidam et al., 1999; Hirdman et al., 2010; Quinn et al., 2009; Sharma et al., 2004, 2006; Sinha et al., 2017; Sirois and Barrie, 1999). Recent measure-ments (Fisher et al., 2011; Frossard et al., 2011; Leaitch et al., 2018; Massling et al., 2015; Sharma et al., 2017; Sinha et al., 2017) have found surface mass concentrations of sulfate, or-ganic material and black carbon (BC) 3–10 times lower than those estimated from studies conducted prior to 1981 (Rahn and Heidam, 1981), but the total Arctic column burden of BC may have increased (Koch and Hansen, 2005; Sharma et al., 2013) with implications for climate forcing efficiency (Brei-der et al., 2017). The turn of the century saw renewed inter-est in Arctic haze with concern for the role of BC in Arctic warming (Flanner et al., 2007; Hansen and Nazarenko, 2004; Law and Stohl, 2007; McConnell et al., 2007; Quinn et al., 2008; Shindell and Faluvegi, 2009).
From the early studies of Arctic haze arose the concept of the Arctic atmosphere as a dome of cold air that regu-lates transport of polluted air from southerly latitudes (Bar-rie, 1986). The polar front extends in the winter to include more southerly industrial emissions that can be transported
Figure 2. The potential temperature (2) distribution binned in steps of 1◦latitude and 20 hPa pressure. 2 was calculated from the tem-perature and pressure measurements on board the Polar 6 aircraft during the NETCARE 2015 springtime campaign. Minimum po-tential temperatures of less than 270 K were only observed in the high Arctic lower troposphere, representing very cold air masses that isolate this area from mid-latitudinal influence. The polar dome is formed by the sloping isentropes which can be identified from the NETCARE measurements. Figure from Bozem et al. (2019).
into the high Arctic, and the front retreats in the summer to inhibit transport from mid-latitude sources. Figure 2 shows an example of identification of the polar dome in spring 2015 through measurements conducted during the NETCARE air-craft campaign. Pollution transport into the Arctic may also be influenced by the North Atlantic Oscillation (Duncan and Bey, 2004; Eckhardt et al., 2003). Arctic haze originates from Eurasia, Siberia, southeast Asia and North America, with Eurasia as the dominant source region at lower altitudes and contributions from south and central Asian sources dominat-ing at higher altitudes (Fisher et al., 2011; Qi et al., 2017; Sharma et al., 2013; Stohl, 2006). Sea salt contributes to the haze due to the combination of stronger winds and reduced wet deposition in the winter and spring (Huang and Jaeglé, 2017; Leaitch et al., 2018) and frost flowers may contribute some marine salt (Shaw et al., 2010). Snowpack exchange is a potential springtime source of organic precursors (McNeill et al., 2012), while stratospheric contributions appear to be small (Leaitch and Isaac, 1991; Stohl, 2006).
Arctic haze warms the Arctic in several ways. BC from an-thropogenic sources and forest fires deposits to snow and ice, lowering the surface albedo (Clarke and Noone, 1985; Do-herty et al., 2010; Flanner et al., 2007; Forsström et al., 2013; Hegg and Baker, 2009; Keegan et al., 2014; McConnell et al., 2007). Atmospheric haze layers containing BC are warmed while the underlying surface is cooled, which acts to increase atmospheric stability (Blanchet and List, 1983; Brock et al., 2011; Koch and Del Genio, 2010; Leighton, 1983; Pueschel and Kinne, 1995; Valero et al., 1984). Meridional tempera-ture gradients are enhanced by BC outside the Arctic, which warms the air during transport to the Arctic, hence increasing
heat transport into the Arctic (Sand et al., 2013). Dust, when present in layers over high-albedo surfaces and/or deposited to the snow, will warm the atmosphere (Bond et al., 2013; Dumont et al., 2014; Lohmann and Feichter, 2005). Arctic haze can also increase longwave radiative forcing by form-ing thin Arctic low-level liquid clouds (Garrett et al., 2009; Garrett and Zhao, 2006; Lubin and Vogelmann, 2006; Mau-ritsen et al., 2011).
However, many components of Arctic haze (e.g. sulfate; organic matter, OM; sea salt) help to cool the Arctic by scattering light back to space (Schmeisser et al., 2018) and by modifying the microphysics of liquid clouds to enhance shortwave cooling (Garrett and Zhao, 2006; Lubin and Vo-gelmann, 2006; Zamora et al., 2017; Zhao and Garrett, 2015). During winter and spring, sulfuric acid in Arctic haze parti-cles may reduce their effectiveness as INPs, leading to larger crystals that precipitate more easily. As a result, there may be an increase in the dehydration rate of the atmosphere and a corresponding reduction in longwave forcing (Blanchet and Girard, 1994; Curry and Herman, 1985). At cirrus tempera-tures, dust, ammonium sulfate, and sea salt may also increase cloud albedo by increasing ice crystal concentrations (Abbatt et al., 2006; Sassen et al., 2003; Wagner et al., 2018).
Observed and simulated seasonal cycles of BC and sul-fate typically show a maximum in near-surface concentra-tions in March or April (Barrie and Hoff, 1985; Eckhardt et al., 2015; Garrett et al., 2010; Sharma et al., 2006) and clean conditions in the summertime. Natural emissions of BC from vegetation fires are considerable in late spring to early summer in the Arctic and at mid-latitudes (Mahmood et al., 2016). Production of sulfate aerosol is more efficient in the warm than the cold seasons (Mahmood et al., 2018; Tesdal et al., 2015). The decline in Arctic haze after its peak in early spring and the approach to the summertime pristine conditions are largely related to changes in transport as the polar front moves northward and aerosol scavenging rather than a reduction in aerosol production. Wet deposition as-sociated with transport across the retracted polar front, fre-quent low-intensity precipitation, and longer residence times within the polar dome keep the summertime near-surface Arctic nearly free of anthropogenic aerosol (Barrie, 1986; Stohl, 2006; Garrett et al., 2010; Browse et al., 2012). How-ever, at higher altitudes up to 8 km, long-range transport from mid-latitude pollution into the Arctic was also observed in summer (Schmale et al., 2011). Marine sources have a strong influence on the Arctic summer aerosol near the surface and possibly aloft (Dall’Osto et al., 2017; Korhonen et al., 2008b; Stohl, 2006).
Summer sources of sulfate appear to be the oxidation of DMS from the Arctic Ocean as well as connected waters to the south, volcanism, residual Arctic haze sulfate, and some anthropogenic sulfate or SO2 that may leak past the
Arctic front into the dome (Leaitch et al., 2013). Methane sulfonic acid (MSA), another product of DMS oxidation, is most prominent in the spring and summer, and its levels are
linked to the northward migration of the marginal ice zone (Laing et al., 2013; Leck and Persson, 1996; Quinn et al., 2009; Sharma et al., 2012). Aside from DMS, natural sources that can contribute to summertime Arctic atmospheric or-ganic matter include biomass burning (Chang et al., 2011a; Stohl, 2006) and sea spray (Chang et al., 2011a; Frossard et al., 2014; Shaw et al., 2010). Sea spray encompasses marine emissions of aerosol precursors, products of photochemical processes transforming organic compounds at the ocean sur-face, and colloidal gels (Leck and Bigg, 1999, 2005, 2007; Orellana et al., 2011).
Characterized by a unimodal diameter distribution centred between 200 and 300 nm (Bigg, 1980; Heintzenberg, 1980; Leaitch and Isaac, 1991; Radke et al., 1984; Staebler et al., 1994), Arctic haze particles are effective at both scattering light (Andrews et al., 2011; Schmeisser et al., 2018) and act-ing as nuclei for cloud droplets (Earle et al., 2011; Komppula et al., 2005). In contrast, the summertime number distribu-tion is dominated by smaller Aitken particles resulting from newly formed particles that have experienced modest growth in the near-pristine summer Arctic. Their small sizes render Aitken particles relatively ineffective at scattering light, but they may be able to influence cloud microphysics in the clean summertime Arctic (Korhonen et al., 2008b).
Overall, the net effect of anthropogenic aerosols has been to cool the Arctic (Fyfe et al., 2013; Najafi et al., 2015), and Navarro et al. (2016) showed that reductions in Arctic haze have contributed to the sharp increase in the rate of Arctic warming since 1990. Mitigation of BC emissions may help to slow Arctic warming so long as cooling components are not simultaneously mitigated (Kopp and Mauzerall, 2010; Sand et al., 2013; Shindell and Faluvegi, 2009).
As seen from this brief overview, understanding natu-ral aerosol processes in addition to anthropogenic aerosol sources is vital for climate studies, as anthropogenic aerosol forcing is measured against the natural component (Carslaw et al., 2013; Megaw and Flyger, 1973). For example, in the winter and spring, sea salt aerosol may play an important cli-mate role (Kirpes et al., 2018). At the start of NETCARE, de-tailed knowledge of natural particle sources and their impacts on clouds in the nearly pristine summer was incomplete, and it became a major focus of the network’s research activities.
3 Marine processes and the summertime Arctic atmosphere
3.1 Rationale and research questions
In remote marine atmospheres such as the summertime Arc-tic, assessing the impact of natural marine biogenic aerosol (MBA) sources on cloud formation is pivotal to accurately estimating climate forcing (Carslaw et al., 2013; Charlson et al., 1987). While a variety of organic compounds, such as marine microgels, may be relevant primary MBA sources
in the Arctic (Leck and Bigg, 2005; Orellana et al., 2011), DMS-derived sulfate is thought to be a key precursor to sec-ondary marine aerosol mass over biologically productive re-gions (Ghahremaninezhad et al., 2016; Leaitch et al., 2013; McCoy et al., 2015; Park et al., 2017). The production of DMS and other organic compounds in polar regions is linked to the productivity of microalgae, as well as to the dynam-ics and the structure of pelagic (oceanic) and sympagic (ice-associated) microbial food webs (Gabric et al., 2017; Lev-asseur, 2013; Simó, 2001; Stefels et al., 2007). Peaks in the DMS proxy MSA have been observed in association with bursts of phytoplankton productivity in the high Arc-tic (Becagli et al., 2016). As well, atmospheric DMS mixing ratios in the marine boundary layer have been shown to tran-siently peak during the phytoplankton growth period from May to September (Park et al., 2013, 2018). Particle nucle-ation and growth events have been observed even at moderate levels of atmospheric and oceanic DMS in the high Canadian Arctic (Chang et al., 2011b; Rempillo et al., 2011).
Despite these compelling indications of the key role played by marine biogenic DMS in contributing to sulfate aerosols (Rempillo et al., 2011), measurements of seawater and sea-ice DMS during the biologically productive summer months (June to August) that coincide with clean aerosol time periods are still scarce (Jarníková et al., 2018; Lev-asseur, 2013). The paucity of DMS measurements in ice-associated habitats, such as under the sea ice, in melt ponds atop the ice, or directly at the Arctic sea-ice margin, is even greater (Levasseur, 2013). Sea ice not only acts to modu-late gaseous exchange but also hosts active microorganisms (Gradinger, 2009), making it a fundamental driver of vari-ous MBA precursors, including DMS (Arrigo, 2014; Gabric et al., 2017; Korhonen et al., 2008b). Our understanding of the processes that control other key gases that can lead to aerosol formation in marine environments, including am-monia and volatile organic compounds (VOCs), is partic-ularly weak. There have been very few measurements of their Arctic abundance in the past and we have a poor un-derstanding of their sources. In this context, NETCARE tar-geted the spatio-temporal variability in DMS and the under-lying ecosystemic mechanisms controlling its abundance in the eastern Canadian Arctic (Canadian Arctic Archipelago, henceforth CAA, and northern Baffin Bay), along with the atmospheric abundances and sources of other key gases. 3.2 DMS production in oceanic and ice-associated
environments
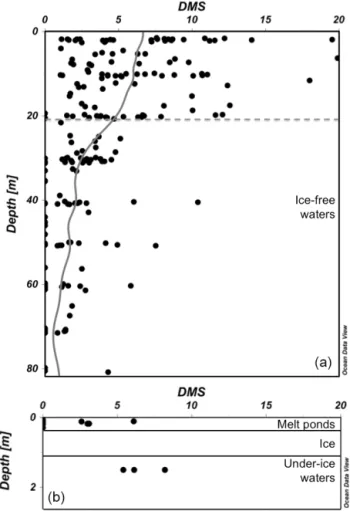
The two NETCARE summer campaigns (July–August 2014 and 2016; see Fig. 1 and Table 1) revealed high open-water concentrations of DMS (interquartile range of 5.1– 10.9 nmol L−1, maximum 75 nmol L−1) in the eastern Cana-dian Arctic. Previous pan-Arctic measurements had an in-terquartile range of 0.9–5.9 nmol L−1 and a maximum of 26 nmol L−1. These results challenged the representativeness
of measurements conducted during previous cruises in the Eastern Canadian Arctic in late summer and early fall (Luce et al., 2011; Motard-Côté et al., 2012) by showing that aver-age summer surface DMS concentrations in this part of the Arctic were at least 2-fold higher than measurements ducted later in the season. The range of seawater DMS con-centrations measured in the CAA during the NETCARE ex-peditions in 2014 (Fig. 3) and 2016 is comparable to those observed in the same area and season in 2015 by Jarníková et al. (2018), who found the highest DMS concentrations in association with localized peaks of chlorophyll a, a proxy of phytoplankton biomass. Combining oceanic and atmo-spheric NETCARE data sets provided further evidence that marine DMS hotspots were associated with high atmospheric DMS (Mungall et al., 2016). As described in Sect. 4, con-nections were also found between localized regions of high oceanic biological activity and new particle formation and growth events (Collins et al., 2017; Mungall et al., 2016) that may be partly caused by DMS and organic emissions. These new observations lend strong support to the hypothesis that local Arctic DMS sources are responsible for the summer-time peaks in MSA measured at Alert (Leaitch et al., 2013; Sharma et al., 2012).
Novel measurements made during NETCARE also sub-stantiated the potentially important role played by melt ponds. An in-depth study of nine melt ponds revealed that brackish melt ponds over first-year sea ice (FYI) may have DMS concentrations ranging from 3 to 6 nmol L−1(Fig. 3) with an average of 3.7 nmol L−1(Gourdal et al., 2018). These concentrations are higher than the area-weighted mean of ca. 2.4 nmol L−1 derived from the global climatology of Lana et al. (2011), bringing support to the suggestion that melt ponds may represent a significant source of DMS in the Arc-tic. A search for the underlying mechanisms associated with the presence of DMS in these melt ponds revealed that intru-sions of seawater through permeable sea ice is a key phys-ical process allowing their colonization by DMS-producing marine protists (Gourdal et al., 2018). Considering that the areal coverage of melt ponds may extend up to 90 % over Arctic FYI (Rösel et al., 2012) these results shed light on a previously overlooked source of DMS to the atmosphere and further call for a re-evaluation of the emissions from these regions within climatologies that currently assume the ab-sence of DMS fluxes above ice-covered waters (Lana et al., 2011). In a simulation exercise, melt ponds were found to contribute an average of 20 % (and up to 100 %) of the atmo-spheric DMS over and near ice-covered regions of the Arctic during the melt season (Mungall et al., 2016).
While marginal ice zones (MIZs) and various ice-edge systems have long been recognized for their teeming biolog-ical activity (Mundy et al., 2009; Perrette et al., 2011) and potential for heightened DMS production (Galí and Simó, 2010; Levasseur, 2013; Matrai and Vernet, 1997), they re-main surprisingly under-documented for their specific role in MBA production in the eastern Canadian Arctic during
Figure 3. (a) Concentrations of DMS (nmol L−1) in ice-free wa-ters as a function of depth (m) with moving average line (all data, n =208). The grey dotted line represents the average surface mixed layer depth (Zm=21 m) estimated as the depth at which the
gra-dient in density between two successive depths was > 0.03 kg m3. (b) Concentrations of DMS (nmol L−1) in melt ponds (n = 9) atop first-year sea ice (Gourdal et al., 2018) and in under-ice waters (n = 3). All data are from the 2014 NETCARE cruise on board CCGS Amundsen.
summer. Two distinct MIZs explored during the summer of 2014 revealed highly contrasting DMS dynamics, suggest-ing that whether the sea ice is FYI or multi-year ice (MYI) is of paramount importance in shaping marine food webs and the net production of DMS in the water exiting the ice pack. Contrasting DMS dynamics between FYI and MYI systems were likely linked to differences in light penetration through the ice pack and its availability to primary producers in the waters just below the ice. At the MYI edge in Kennedy Chan-nel (ca. 81◦N), DMS concentrations were very low at the ice edge and increased progressively over several kilometres as the water flowed away from the ice pack, suggesting that time out from under the ice was required for development of a phytoplankton bloom and the concomitant production of DMS. However, at a FYI edge in the CAA (ca. 74◦N), DMS concentrations were already high under the ponded sea ice
(Fig. 3) due to the presence of an under-ice bloom. Conse-quently, the surface waters exiting the ponded FYI displayed high DMS even at the very edge of the ice pack. The elevated levels of DMS persisted for several kilometres away from the ice edge. Thus, beyond the direct contributions melt ponds make to DMS fluxes, results from the NETCARE campaigns suggest that melt ponds play an additional role in DMS dy-namics by promoting the earlier onset of under-ice phyto-plankton blooms and DMS production (Lizotte et al., 2019). Taken together, these observations reveal the potential for high DMS emissions to the atmosphere immediately upon the cracking, opening, or melting of ponded FYI without the prerequisite of an ice-free period to initiate a phytoplankton bloom and potential accumulation of DMS in surface waters. 3.3 Gaseous aerosol precursors in Arctic marine and
coastal environments
High levels of DMS have previously been associated with aerosol formation and growth in the CAA (Chang et al., 2011b; Park et al., 2017; Rempillo et al., 2011). As part of NETCARE, new atmospheric measurements of DMS were performed from both the Polar 6 aircraft and the CCGS Amundsen icebreaker. Mean DMS mixing ratios in the Arctic lower free troposphere in April 2015 were found to be unexpectedly high (average 116 ± 8 ppt) relative to those from the July 2014 campaign (20 ± 6 ppt) (Ghahmaninezhad et al., 2017). The springtime levels likely re-flect long-range transport from more southerly open-ocean regions. In the summertime, the boundary layer mixing ra-tios were at times much higher than they were in the spring in both 2014 (Mungall et al., 2016) and 2016 (unpublished results), reflecting nearby marine sources. For example, high atmospheric DMS concentrations (up to 1800 ppt, median 144 ppt) were found within the boundary layer from ship-based grab samples collected in July and August 2016. For a similar period and location in 2014, these values were up to 1100 ppt (median 186 ppt; Mungall et al., 2016). Evidence for atmospheric DMS was the widespread prevalence of bio-genic DMS oxidation products in the marine boundary layer (Ghahremaninezhad et al., 2016).
VOCs were measured in the marine atmosphere during the 2014 CCGS Amundsen cruise. Isoprene and monoter-pene levels were frequently below detection limit, but oc-casionally reached as high as 15 ppt (Mungall et al., 2016). Oxygenated volatile organic compounds (OVOCs) were also measured, using an instrument that is especially sensitive to organic acids. High levels of formic acid (up to 4 ppb) and isocyanic acid (up to 80 ppt) were strongly correlated with a suite of C4–C11 oxo-acids (Mungall et al., 2017). Using
positive matrix factorization, these OVOCs, which were el-evated in regions where the ocean had high dissolved or-ganic carbon (DOC) content, were interpreted as originat-ing from an ocean source (Fig. 4). Production at the sea surface microlayer was invoked as an explanation, because
Figure 4. A large suite of oxygenated VOCs (OVOCs) were mea-sured on the CCGS Amundsen during the 2014 cruise in the high Canadian Arctic. A factor analysis of the full time-dependent data set yielded an “Ocean factor” of small organic acids whose inten-sity correlated with the DOC levels in the ocean (a) and with time of day and hence downwelling radiation (b). See text for additional discussion. Figures from Mungall et al. (2017).
compounds like formic acid are sufficiently soluble that they should not escape from the bulk ocean into the atmosphere. Rather, these species must arise either through photochem-istry or heterogeneous oxidation proceeding in the sea sur-face microlayer, or by gas-phase atmospheric oxidation of components volatilized from the microlayer. Although the OVOC molecules measured by Mungall et al. (2017) were too volatile to participate in formation of Arctic marine sec-ondary organic aerosol (MSOA) themselves, similar pro-cesses that form larger, less volatile molecules could con-tribute to aerosol growth. We note that there was a weak pos-itive correlation between total aerosol volume and the levels of OVOCs observed, indicating a potential link between the processes forming OVOCs and aerosol growth. Formation of Arctic MSOA and its role in new particle growth in the Arc-tic is discussed further in Sect. 4.2. (Note that in this work we use the term Arctic MSOA to refer to the organic aerosol formed in the atmosphere from marine biogenic emissions. We note that the chemical character of Arctic MSOA is not necessarily the same as that in other marine environments. For example, different biogenic precursors may be present elsewhere, and the SOA that forms from shipping emissions will have very different properties and composition.)
NETCARE provided the opportunity to make some of the first observations of ammonia in the Arctic atmosphere. Pre-vious measurements of atmospheric ammonia over the Nor-wegian Sea and Arctic Ocean during the summer ranged be-tween the detection limit (35 ppt) and 400 ppt (Johnson et al., 2008). Simultaneous measurements of sea surface ammo-nium (NHx) during these previous studies ranged between 29
and 616 nM, leading to ammonia compensation points that were below the ambient concentrations, suggesting that the ocean could not act as a source of ammonia to the sphere. During the 2014 NETCARE campaign, hourly atmo-spheric ammonia measurements in the CAA marine bound-ary layer ranged between 40 and 870 ppt (Wentworth et al., 2016). Simultaneous measurements of NHx at the sea
sur-face and in melt ponds confirmed that these reservoirs could
not act as sources of ammonia to the atmosphere. Boreal fires contributed to elevated atmospheric NH3in the CAA during
2014 (Lutsch et al., 2016), but could not fully explain the spatial and temporal extent of the elevated NH3mixing
ra-tios. The inclusion of NH3emissions from migratory seabird
colonies in model simulations brought predicted NH3values
into much better agreement with observations (Wentworth et al., 2016) and strongly influenced modelled new particle for-mation (Croft et al., 2016a). In 2016, observations were again made from the CCGS Amundsen but at a higher time resolu-tion, as well as at the Alert field site, both from mid-June to mid-July (Murphy et al., 2019). The ranges of hourly average NH3values measured from the ship in 2016 (up to 1150 ppt;
median 125 ppt) and at Alert (up to 720 ppt; median 234 ppt) were similar to the observations in 2014. Limited measure-ments of the tundra soil emission potential at the Alert site indicated that under the unusually high temperatures experi-enced at Alert in July 2016, the tundra could act as a source of ammonia to the atmosphere. Overall, the bidirectional ex-change of ammonia between the atmosphere and the land– ocean surface is important to include in chemical transport models. The impact of ammonia on aerosol formation in the summertime Arctic, with associated climate impacts, is dis-cussed below in Sect. 4.2.
3.4 Connecting the ocean, sea ice and the atmosphere through DMS modelling
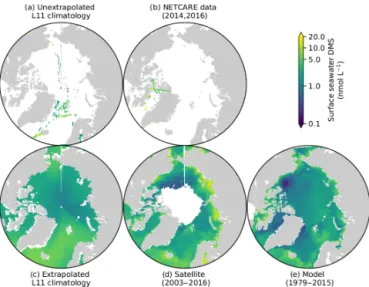
Prior to the NETCARE field campaigns, the existing un-extrapolated DMS climatology, averaged over the most pro-ductive time of the year (months of July and August), clearly demonstrated the scarcity of surface ocean DMS measure-ments in the Arctic (Lana et al., 2011). The updated Lana DMS climatology and its precursor (Kettle et al., 1999) have long represented useful tools for oceanic model validation (e.g. Le Clainche et al., 2010; Tesdal et al., 2016; Kim et al., 2017) and lack of data over the Canadian Polar shelf and the Baffin Bay area challenged the representativeness of the stan-dard (extrapolated) version of this climatology for these spe-cific regions (Fig. 5c). Observations gathered through NET-CARE field campaigns (Fig. 5b) significantly enhanced cov-erage in these regions.
As part of NETCARE, a new process-based sea-ice– ocean biogeochemical model representing ecosystems in both the sea ice and water column of the marine Arctic was developed. The model was initially developed in a one-dimensional (1-D) configuration (Mortenson et al., 2017). Subsequently, sulfur and inorganic carbon cycling were de-veloped and implemented into the model (Hayashida et al., 2017; Mortenson et al., 2018). The simulated Arctic sea-ice ecosystem and sulfur cycle were next incorporated into a three-dimensional (3-D) regional configuration (Hayashida, 2018; Hayashida et al., 2018). This model advances previ-ous Arctic-focused DMS model studies (Elliott et al., 2012; Jodwalis et al., 2000) in that many of the parameters
concern-Figure 5. Pan-Arctic distribution of July–August concentrations of surface ocean DMS. Upper panels show the comparison between (a) the discrete (Lana et al., 2011) climatology and (b) the data collected during the two NETCARE field campaigns. Lower pan-els compare (c) the standard (Lana et al., 2011) climatology with (d) the satellite-derived (Galí et al., 2018; Hayashida, 2018) and (e) model-based (Hayashida, 2018) climatologies developed within NETCARE.
ing the DMS production are derived from recent field obser-vations in the Arctic, enabling quantification of the relative contributions of ice algae and phytoplankton to DMS pro-duction and emissions. The 1-D simulations indicated a no-table contribution of ice algae: an 18 % enhancement of DMS concentrations under the ice and a 20 %–26 % enhancement of sea–air DMS fluxes during the melt period for Resolute Passage (Hayashida et al., 2017). Also in the vicinity of ice margins, simulated spikes in sea–air fluxes of DMS origi-nating from bottom and under-ice production by algae were comparable to some of the local maxima in the summertime flux estimated for ice-free waters in the Arctic.
The data obtained during the two NETCARE ship cam-paigns, together with data previously available in the PMEL sea surface database (https://saga.pmel.noaa.gov/dms/, last access: 16 February 2019), were used to develop a new satellite-based model allowing the estimation of DMS at the global and regional scales (Galí et al., 2018). As can be seen in Fig. 5d, the satellite-based model provides a DMS map with an unprecedented spatial resolution (8 days, 28 km × 28 km pixels). The DMS climatology based on the 3-D process-based model simulation shows a range simi-lar to the Lana et al. (2011) climatology, but higher spa-tial variability, in line with the satellite-based climatology (Fig. 5e). Together with the remote sensing approach, the nu-merical model is being used to help interpret the new NET-CARE DMS data set, as well as to investigate longer-term and larger-scale variability, such as impacts of sea-ice reduc-tion on DMS producreduc-tion (Hayashida, 2018).
Under future global warming conditions, sea-ice extent is expected to decline significantly, affecting the temporal and spatial evolution of ice algae and under-ice and open-water phytoplankton blooms. This may lead to changes in oceanic DMS emissions, although the sign and magnitude of the change is highly uncertain. Using the satellite approach men-tioned above, Galí et al. (2019) showed that DMS emission has increased at a rate of about 30 % decade−1 during the last 2 decades, accompanied by large inter-annual changes linked to variable ice retreat patterns. They also estimated a 2- to 3-fold increase in DMS emission in response to com-plete sea-ice loss in summer.
To estimate the sensitivity of Arctic aerosols and radia-tive forcing to surface seawater concentrations of DMS in the Arctic, simulations with different specified surface sea-water DMS concentrations and spatial distributions in the Arctic were performed for future sea-ice conditions using the Canadian Atmospheric Global Climate Model (CanAM4.3). For all of the specified surface seawater DMS conditions in the model, simulated Arctic sulfate aerosol amounts respond only weakly to a reduction in sea-ice extent owing to in-creases in precipitation and aerosol wet deposition associated with the receding ice and increased open water (Mahmood et al., 2018). However, nucleation rates for sulfate aerosol respond significantly to reductions in sea-ice extent, which leads to a strengthening of cloud radiative forcing in the fu-ture. Furthermore, the simulated response of the mean cloud radiative forcing in the Arctic is approximately proportional to the mean surface seawater DMS concentration in the Arc-tic. Thus potential future changes in sea-ice extent may result in a negative climate feedback of DMS on radiative forcing in the Arctic, as suggested by Charlson et al. (1987).
4 Arctic aerosol: sources, sinks, and properties 4.1 Rationale and research questions
The overall motivation of Arctic summertime research is to determine how the atmosphere will respond to melting sea ice, as an ocean that was largely covered by sea ice through much of the summer will potentially be ice free in summer by mid-century (AMAP, 2017; Comiso, 2011; Gregory et al., 2002; Holland et al., 2006). Given the evolution of the summertime Arctic Ocean from a bright ice cap to a dark ocean that can readily absorb solar radiation, it is of partic-ular importance to understand factors controlling the over-head aerosol and cloud that could mediate the positive ra-diative feedback of declining sea ice. Precipitation associ-ated with low clouds and fogs is common in the summertime (Browse et al., 2014). Wet deposition is a highly efficient aerosol removal mechanism, giving rise to a clean boundary layer in which new particles may be formed or into which they may be input. In these clean boundary layers, increases in the numbers of particles acting as cloud condensation
nu-clei (CCN) may increase longwave warming by clouds if the absolute concentrations of CCN are sufficiently low (Mau-ritsen et al., 2011); otherwise, increases in CCN concentra-tions lead to enhanced shortwave cooling. In this context, it is important to better understand the processes that give rise to new particle formation and growth to CCN sizes, and the associated impacts on clouds. For example, how do the emis-sions of biogenic gases described in Sect. 3 affect new parti-cle formation and growth in such environments, and what is their importance relative to anthropogenic inputs from local shipping and long-range transport?
In contrast, the springtime atmosphere, with its associated Arctic haze, has been better studied than the summertime at-mosphere. The results from high profile campaigns such as ISDAC (Indirect and Semi-Direct Aerosol Campaign, https: //campaign.arm.gov/isdac/, last access: 16 February 2019), ARCTAS (Arctic Research of the Composition of the Tro-posphere from Aircraft and Satellites, https://www.nasa.gov/ mission_pages/arctas/, last access: 16 February 2019), and ARCPAC (Aerosol, Radiation, and Cloud Processes affect-ing Arctic Climate, https://www.esrl.noaa.gov/csd/projects/ arcpac/, last access: 16 February 2019) have emphasized the importance of long-range transport (see also the POLAR-CAT project; Polar Study using Aircraft, Remote Sensing, Surface Measurements and Models, of Climate, Chemistry, Aerosols, and Transport, https://www.atmos-chem-phys.net/ special_issue182.html; Stohl et al., 2009). However, many questions remain. Taking BC-containing aerosol as an exam-ple, we can ask the following questions. What is the relative importance of sources in Europe and different Asian regions (Jiao and Flanner, 2016), and how does the relative impor-tance of different source regions vary vertically from the sur-face to higher altitudes? To what degree can specific source regions be identified? How important are local sources, such as from Arctic shipping or gas flaring? How will the direct effect of light-absorbing particles be impacted by their mix-ing state, that is, by the degree to which they are internally or externally mixed with other components of the pollution plume? More generally, the composition of the air masses throughout the Arctic needs to be better evaluated vertically to aid in the identification of long-range transport sources, to help establish whether chemical transformations occur dur-ing transit and descent within the Arctic air mass, and to ul-timately better estimate climate impacts.
Lastly, the deposition rates of aerosol constituents need to be measured to better constrain models. Ideally, both wet and dry deposition rates would be individually evaluated throughout the year, to map out the transition from a system dominated by the relatively slow loss with ice cloud scav-enging versus the more efficient removal via warm clouds and fogs.
4.2 Summertime aerosol: particle formation and growth
As described in Sect. 2, a pronounced Aitken mode in the aerosol size distribution is a common feature during the Arc-tic summertime, as demonstrated by Croft et al. (2016b), who identified this feature in long-term monitoring data sets from both the Alert and Zeppelin ground stations (Fig. 6). One of the major findings from NETCARE is the widespread prevalence of 5–50 nm ultrafine particles in the summertime Canadian Arctic (Burkart et al., 2017b; Collins et al., 2017; Willis et al., 2016, 2017) and their ability to activate as CCN (Burkart et al., 2017a; Chaubey et al., 2019). While previous ship-based measurements in similar regions in late summer and fall had demonstrated new particle formation and growth events, their frequency was low. For example, in the fall pe-riod of late August to the end of September 2008, only three such events were observed over a 5-week observation pe-riod, whereas no events were observed at all in October 2007 (Chang et al., 2011b). By comparison, NETCARE measure-ments in mid-July to mid-August 2016 observed enhance-ments in 5–50 nm particles 41 % of the time in a spatially heterogeneous manner (Collins et al., 2017). Characteriza-tion of the summertime increase in particles is provided in Fig. 7, wherein the number of particles between 15 and 30 nm (N15–N30) is highly enhanced at Alert in July and August, before rapidly declining in September (see the Supplement for details). As discussed in the Supplement, natural sources are estimated to contribute 20 %–80 % of the 30–50 nm par-ticles during July and August. NETCARE aircraft measure-ments in July 2014 also demonstrated the spatial heterogene-ity of 5–50 nm particle numbers in the inversion layer, with the highest concentrations observed over marine and cloudy regions and little detectable enhancement over ice-covered areas (Burkart et al., 2017b). These aircraft measurements also indicate that the numbers of these tiny particles in the free troposphere are spatially homogeneous and considerably lower than those measured in the inversion layer, indicative of a boundary layer source.
Significant growth of 5–50 nm particles to CCN sizes was clear from each observational platform. At Alert (Fig. 7), the summertime enhancement in particles between 15 and 30 nm (N15–N30) coincides with the increase in particles in the 50 to 100 nm size range (N50–N100), which is also the size of particle activation diameters observed in the field (see Sect. 4.3). Interestingly, using Fourier Transform Infrared (FTIR) absorption of particulates collected on filters, the ra-tio of aerosol organic material to sulfate was also observed to increase during this time period, and the region of amide functional groups indicates a contribution of organic compo-nents from breakdown of seabird urea in guano (Leaitch et al., 2018). Likewise, a particle growth episode was clearly observed over the ice-free Lancaster Sound, in which the numbers of 5–50 nm particles and CCN increased in con-cert with the measured organic content of the PM1 aerosol
Figure 6. Aerosol size distributions from Alert and Zeppelin Arctic field stations. The pronounced accumulation mode in the winter and spring is characteristic of Arctic haze. The mode of Aitken particles is a common feature of the Arctic summertime atmosphere. Figure from Croft et al. (2016b).
(Willis et al., 2016). Across the entire aircraft campaign, the numbers of CCN were most strongly enhanced above back-ground levels when the air had recently been at low altitude over open water (Fig. 8a), when the wind speeds were low, and when the organic-to-sulfate ratio of the particles was high (Willis et al., 2017). This marine influence is consistent with summertime single-particle mass spectrometric mea-surements of trimethylamine-containing particles in the ma-rine boundary layer that were largely externally mixed with sea-salt-containing particles (Fig. 9; Köllner et al., 2017).
The lack of a wind speed dependence and the observa-tions of externally mixed particulate trimethylamine suggests that secondary sources are important. Similarly, microphys-ical models of growing particle size distributions could only be reconciled with observations from the CCGS Amundsen icebreaker in northern Baffin Bay by invoking partitioning of semi-volatile species to the freshly nucleated and pre-existing particles (Burkart et al., 2017a). This stands in con-trast to mid-latitude continental settings, where the growth behaviour is best modelled by considerable condensation of low volatility species such as sulfuric acid and highly oxy-genated organic molecules. We presume this semi-volatile material is organic in nature (i.e. Arctic MSOA).
Natural emissions of ammonia are also important to new particle formation and growth. Wentworth et al. (2016) used GEOS-Chem model simulations to interpret NETCARE
am-monia measurements (see Sect. 3.3) and found that migra-tory seabird colonies (emitting 36 Gg NH3between and May
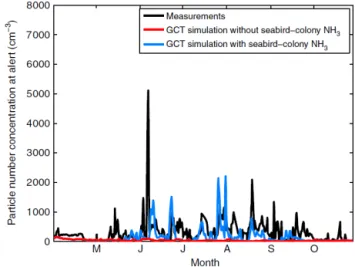
and September) were important sources of ammonia in the summertime Arctic. In addition, transport of boreal wildfire smoke from lower latitudes can also be an important, albeit episodic, contributor of ammonia to the summertime Arctic troposphere (Croft et al., 2016a; Lutsch et al., 2016; Went-worth et al., 2016). Croft et al. (2016a) further interpreted NETCARE observations using the GEOS-Chem-TOMAS model to find that ammonia from seabird-colony guano is a key factor contributing to the bursts of newly formed par-ticles that are observed every summer at Alert (Fig. 10). In addition, the FTIR absorption in the region of amide func-tional groups indicates a contribution of organic components from the breakdown of seabird urea in guano. The chemi-cal transport model simulations indicate that the pan-Arctic seabird-influenced particles can grow by sulfuric acid and or-ganic vapour condensation to diameters sufficiently large to enhance pan-Arctic cloud droplet number concentrations and effects on climate in the clean Arctic summertime. Other nat-ural ammonia sources within the same order of magnitude as the seabird-colony emissions, including but not limited to episodic biomass burning influences (Lutsch et al., 2016) and tundra emissions (Murphy et al., 2019), could also contribute to these effects (Croft et al., 2018).
Figure 7. The changing composition and size distributions of aerosol in the high Arctic, see the Supplement for details. (a) Monthly average number concentrations for the indicated size ranges for measurements at Alert. (b) Estimated increases in par-ticles in the indicated size intervals for June–September, inclusive, and monthly average values of OM/nss-SO2−4 (non-sea-salt sulfate) based on weekly filter samples. The data presented here are from April 2012 to October 2014, inclusive. The dashed lines in panel (a) represent an estimate of number concentrations assuming no new particle formation. The number concentration curves in panel (b) are the difference between the solid and dashed curves in panel (a).
Determining the precursors to Arctic MSOA is of crucial importance. Aerosol mass spectrometry measurements from the aircraft campaign in summer 2014 indicate that the or-ganic chemical character of this aerosol is distinctly differ-ent from that which arises from oxidation of common con-tinental precursors, such as isoprene or the monoterpenes (Willis et al., 2017). The mass spectral signatures indicate molecules that instead have substantial alkyl components, such as functionalized fatty acids (Fig. 8b). Long-chain fatty acids can sometimes be a significant component of the sea surface microlayer (Cunliffe et al., 2013). Croft et al. (2018) have shown that a steady flux of condensable organic
ma-terial from the ocean that oxidizes with a lifetime of a day is essential for consistency between GEOS-Chem-TOMAS modelled aerosol size distributions and those measured at Alert and from the CCGS Amundsen icebreaker. This evi-dence strongly supports the importance of Arctic MSOA in setting the overall aerosol composition and size in the sum-mertime.
4.3 Summertime aerosol: impacts on liquid water clouds
Studies at mid-latitudes have routinely shown that the small-est particles that can serve as nuclei for liquid cloud droplets are 80–120 nm in diameter (Hoppel et al., 1985; Leaitch et al., 1986). The smaller Aitken particles, 20–80 nm in size, are commonly considered to be too small to activate into cloud droplets. However, there are two circumstances which en-able Aitken particles to activate at cloud base: (1) rapid cool-ing rates, generally associated with higher updraft speeds, increase cloud base supersaturation; and (2) very low con-centrations of larger particles (> 100 nm), which reduce wa-ter vapour uptake at cloud base, thereby increasing super-saturations. In the second case, which is prominent in the Arctic during summer, modelling suggests that even mod-est updrafts (20–50 cm s−1) lead to the activation as CCN of particles as small as 40 nm (Korhonen et al., 2008b, a). This had never previously been verified by observations and was a main focus of the NETCARE summertime flight campaign.
During the NETCARE flights conducted out of Resolute Bay in July 2014, number size distributions of cloud droplets and aerosol particles measured in and around clouds showed that 50 nm particles were routinely activated and that par-ticles as small as 20–30 nm were activated on a few occa-sions where updraft speeds were likely higher (Leaitch et al., 2016). These results substantiate the prediction made by Ko-rhonen et al. (2008b). However, Leaitch et al. (2016) found no evidence for an association of cloud liquid water content with aerosol variations when droplet concentrations are less than about 10 cm−3, which was proposed by Mauritsen et al. (2011) as a means of aerosol-induced longwave warming. Modelling conducted as part of NETCARE demonstrated the importance of this Aitken particle activation. For exam-ple, as mentioned above, Croft et al. (2016a) estimated the Arctic summertime shortwave radiative forcing by the ef-fects of natural seabird ammonia emissions on these particles at −0.5 W m−2, highlighting the importance of this natural aerosol for climate.
Lastly, experiments are in progress to evaluate the Sin-gle Column Model of Arctic Boundary Layer Clouds (SCM-ABLC) and version 18 of the Canadian Climate Centre’s ra-diative transfer model with the cloud observations conducted from Resolute Bay discussed above. The modelling work will attempt to reproduce the observations and quantify the uncertainty in modelling the radiative balance of low clouds and fog in the summertime Arctic.
Figure 8. Panel (a) illustrates that the number of CCN (at 0.6 % supersaturation) measured by NETCARE in the summertime Arctic in 2014 is related to the organic mass fraction of the particles measured by an aerosol mass spectrometer. Open circles are all the data points. The closed, coloured circles represent the FLEXPART-WRF predicted air mass residence time over open water in the boundary layer prior to the measurement (see Willis et al., 2017, for details). Panel (b) plots the H / C vs. the O / C ratios of submicron aerosol measured during the same summertime 2014 campaign. The circles and triangles are low (< 300 m) and high (> 300 m) altitude points, respectively, and the colour is the MSA-to-sulfate ratio of the aerosol. High ratios indicate large biogenic secondary impact. The convergence of points with high ratios to an H / C ratio close to 2 indicates a composition with substantial hydrocarbon-like character, as indicated in red by the placements for common molecules. Figures from Willis et al. (2017).
Figure 9. Single-particle mass spectrometry results from the NET-CARE 2014 summer campaign, where the detected particle frac-tion is plotted against the aerodynamic diameter of the particle. The total number of particles detected in a specific size bin is plot-ted in red. The classifications of particle types containing different species are: Na / Cl (dark blue), levoglucosan (grey), Na (green), el-emental carbon (EC, black), and a category of particles called “Sec-ondary” that includes organics, potassium, sulfate, trimethylamine, and MSA (light blue). Figure from Willis et al. (2017).
4.4 Springtime aerosol: sources and vertical distribution
As discussed in Sect. 2, Arctic haze is a prominent feature in springtime, yet its composition and sources remain uncertain.
Figure 10. Time series of measured and modelled numbers of par-ticles 10 nm and larger at Alert during 2011. Seabird ammonia is included in the blue curve simulation but not in the red curve simu-lation. Measurements are in black. Figure from Croft et al. (2016a). GCT represents GEOS-Chem-TOMAS.
During the NETCARE 2015 aircraft campaign, vertically re-solved observations of trace gases and aerosol composition were made in the high Arctic springtime, with six flights north of 80◦N. Trace gas gradients observed on these flights defined the polar dome (i.e. the region north of the Arctic front) as north of 66–68.5◦N and below potential tempera-tures of 283.5–287.5 K (Fig. 2; Bozem et al., 2019; Willis et al., 2019).
NETCARE flight observations based at Alert and Eureka revealed that within the polar dome, submicron aerosol com-position varied systematically with potential temperature. In the lower polar dome (i.e. below 252 K), measured aerosol mass (non-refractory aerosol and BC) was dominated by sul-fate (74 %), with smaller contributions from BC (1 %), or-ganic aerosol (OA, 20 %), and ammonium (NH4, 4 %). At
higher altitudes and warmer potential temperatures, BC, OA, and NH4 contributed up to 3 %, 42 %, and 8 % of aerosol
mass, respectively. These observations indicate a substan-tial but unquantified contribution from sea salt aerosol in the lower polar dome (Leaitch et al., 2018; Willis et al., 2019). Vertically resolved observations suggest that measurements at the surface may underestimate the contribution of OA, BC, and NH4to aerosol transported to the Arctic troposphere
(Schulz et al., 2019; Willis et al., 2019). Next, we discuss hy-potheses that may explain this vertical variability in aerosol composition.
Model simulations of air mass history using FLEXPART indicate differences in transport history as a function of po-tential temperature in the polar dome. Air masses at lower potential temperature (lower altitude) spent long times (> 10 days) in the polar dome, while air masses at higher po-tential temperature (higher altitude) had entered the Arctic more recently and were more recently influenced by lower latitude sources at the surface (Willis et al., 2019). Model results indicate that descent of air masses from higher po-tential temperatures influenced the lower polar dome on the timescale of 10 days. Submicron aerosol composition var-ied systematically with model-predicted time spent in the mid-to-lower polar dome (i.e. below 265 K): the sulfate frac-tion increased with time below 265 K, while the NH4, OA,
and BC fractions decreased significantly. These phenomena could arise from a combination of three possible processes: (1) systematic changes in source region with increasing po-tential temperature (Fisher et al., 2011) that supply aerosol with systematically different compositions, (2) oxidation of transported aerosol and sulfur dioxide over the long aerosol lifetime in the polar dome and during transport, and (3) wet removal and cloud processing along the transport path that may impact the composition of aerosol arriving in the polar dome.
An analysis of results from simulations with four differ-ent models in NETCARE (Mahmood et al., 2016) indicates that the main source of BC in the Arctic is long-range trans-port from mid-latitudes. The long-range transtrans-port of BC to the Arctic is particularly efficient in midwinter and then de-creases in efficiency, reaching a minimum in March and April. At the same time, dry deposition decreases, and wet deposition from clouds in the low and mid troposphere be-comes more important during the transition from winter to spring. Overall, sources and sinks of BC in the Arctic are well balanced, leading to nearly steady Arctic burdens during the time period from December to May. Subsequently, during the transition from spring to summer, precipitation increases
and wet deposition becomes highly efficient, which leads to substantial reductions in BC burdens in the Arctic despite in-creased emissions from vegetation fires. At high altitudes in the Arctic, the model results indicate that convective trans-port of pollution from the lower to the upper troposphere at lower latitudes and subsequent long-range transport to the Arctic represents an important source of BC.
Xu et al. (2017) interpreted a series of airborne and ground-based BC measurements made using multiple mea-surement techniques with the GEOS-Chem global chemical transport model and its adjoint to attribute the sources of Arctic BC (Fig. 11). This was the first comparison of BC measurements from a Single Particle Soot Photometer (SP2) at Alert with a chemical transport model. The inclusion of seasonally varying domestic heating and of gas-flaring emis-sions was crucial to successfully simulating ground-based measurements of BC concentrations at Alert and Barrow and airborne BC measurements across the Arctic. Sensitiv-ity simulations suggest that anthropogenic emissions in east-ern and southeast-ern Asia have the largest effect on the Arctic BC column burden in spring (56 %), with the largest contri-bution in the middle troposphere. At the Arctic surface, an-thropogenic emissions from northern Asia (40 %–45 %) and eastern and southern Asia (20 %–40 %) are the largest BC contributors in winter and spring, followed by Europe (16 %– 36 %). This dominant role of Asian sources is consistent with some recent studies (e.g. Ma et al., 2013; Wang et al., 2014; Ikeda et al., 2017) but differs from many earlier studies (e.g. Stohl, 2006; Shindell et al., 2008; Gong et al., 2010; Huang et al., 2010; Bourgeois and Bey, 2011; Sharma et al., 2013) due to decreased European emissions and increased Asian emissions. The adjoint simulations enabled identification of pronounced spatial heterogeneity in the contribution of emis-sions to the Arctic BC column concentrations, with notewor-thy contributions from emissions in eastern China (15 %) and western Siberia (6.5 %). The Tarim oilfield in western China stood out as a specific influential source with an annual con-tribution of 2.6 %. Emissions from as far away as the Indo-Gangetic Plain could have a substantial influence (6.3 %) on Arctic BC as well.
4.5 Springtime aerosol: optical properties
Kodros et al. (2018) combined measurements of BC mix-ing state in the sprmix-ingtime Canadian high Arctic with simu-lated size-resolved aerosol mass and number concentrations to constrain model estimates of the direct radiative effect (DRE). Airborne measurements using an SP2 (soot particle photometer) and Ultra-High Sensitivity Aerosol Spectrom-eter on board the Polar 6 aircraft show an average coating thickness of 45 to 40 nm for BC core diameters across the range of 140 to 220 nm, respectively. For total particle di-ameters ranging from 175 to 730 nm, BC-containing parti-cle number fractions range from 16 % to 3 %. GEOS-Chem-TOMAS yields a pan-Arctic average springtime DRE for all
Figure 11. GEOS-Chem adjoint modelling results for BC sources to the Arctic. Panels (a) and (b) show in colour the contributions of BC from different anthropogenic emission and biomass burning regions to the vertical profiles in the atmosphere, where the measurements are in black. Modelled results are for the entire Arctic for the annual average. The data are binned in pressure ranges in panels (c) and (d). Numbers of measurements are along the y axis. Figure from Xu et al. (2017).
aerosols ranging from −1.65 W m−2when assuming entirely externally mixed BC to −1.34 W m−2 when assuming en-tirely internally mixed BC. Using the observed mixing-state constraints from this field campaign significantly reduces this estimated range in DRE by over a factor of 2 (−1.59 to −1.45 W m−2). Measurements of mixing state thus provide important constraints for model estimates of the DRE.
Some of the first vertically resolved and concurrent mea-surements of aerosol composition and optical properties in the springtime high Arctic are presented in Leaitch et al. (2019). As shown in Fig. 12a, observations from the Po-lar 6during April 2015 indicate an increase in the fraction of refractory black carbon (rBC) in submicron particles with altitude coincident with an increase in the overall carbona-ceous fraction of the submicron aerosol for flights conducted around Alert, Nunavut, and Eureka, Nunavut (Schulz et al., 2019; Willis et al., 2019). For values of the light scattering coefficient (σscat) less than 15 Mm−1, which represent 98 %
of the measured σscatduring the Alert and Eureka flights, the
single scattering albedo (SSA) of the aerosol decreases from 0.96 near the surface to 0.93 at 500 hPa (Fig. 12a). The SSA
Figure 12. (a) Vertical profiles of the ratio of organic material to sulfate (Organic/sulfate) from Willis et al. (2019), the ratio of refrac-tory black carbon (rBC) to the volume concentration of the submi-cron aerosol estimated from the measured size distribution (Schulz et al., 2019) and one estimate of the single scatter albedo (SSA; Leaitch et al., 2019). (b) Profiles of the sum of the mass concen-trations of ammonium (NH4), organic material (Org.) and sulfate
(SO4) with the light scattering coefficient (σscat). All values are
medians over approximately 50 hPa pressure intervals. Results are for flights conducted out of Alert and Eureka, and constrained to σscat<15 Mm−1, which represents 98 % of the observed σscat.
decrease with altitude is consistent with the increasing frac-tion of rBC in the particles and suggests a stabilizing influ-ence of BC on the high Arctic atmosphere. In an absolute sense, the σscatvalues primarily vary with the sum of
ammo-nium, organics, and sulfate as shown in Fig. 12b. 4.6 Monitoring the transitions between seasons by
remote sensing
While in situ field campaigns provide detailed information over a short period of time, remote sensing provides an-nual measurements and thus information about the transi-tions from winter to spring and then into summer. In par-ticular, ground-based lidar and star photometry (carried out at the PEARL observatory in Eureka, Nunavut) and satellite-based lidar (CALIOP/CALIPSO) during the latter half of two polar winters suggest the frequent Arctic-wide presence of submicron particles in the boundary layer with aerosol opti-cal depths (AODs) significantly greater than the AOD pre-dicted by GEOS-Chem, in which the AOD largely results from sulfate particles (O’Neill et al., 2016). Ground-based sun photometry (AEROCAN/AERONET) measurements ac-quired between 2009 and 2012 at five western-Arctic stations (Hesaraki et al., 2017) revealed Arctic-wide springtime peak-ing of both submicron and super-micron AODs that were roughly consistent with submicron and super-micron AOD estimates from GEOS-Chem (predominantly associated with