HAL Id: hal-00251589
https://hal.archives-ouvertes.fr/hal-00251589
Submitted on 11 Dec 2008
HAL is a multi-disciplinary open access
archive for the deposit and dissemination of
sci-entific research documents, whether they are
pub-lished or not. The documents may come from
teaching and research institutions in France or
L’archive ouverte pluridisciplinaire HAL, est
destinée au dépôt et à la diffusion de documents
scientifiques de niveau recherche, publiés ou non,
émanant des établissements d’enseignement et de
recherche français ou étrangers, des laboratoires
Structural phase transition in ZrO2 induced by swift
heavy ion irradiation at high pressure
B. Schuster, M. Lang, R. Klein, C. Trautmann, R. Neumann, A. Benyagoub,
F. Fujara
To cite this version:
B. Schuster, M. Lang, R. Klein, C. Trautmann, R. Neumann, et al.. Structural phase transition in
ZrO2 induced by swift heavy ion irradiation at high pressure. The Seventh International Symposium
on Swift Heavy Ions in Matter, Jun 2008, Lyon, France. �hal-00251589�
Structural phase transition in ZrO
2
induced by
swift heavy ion irradiation at high pressure
B. Schuster
∗a,b, M. Lang
c, R. Klein
a, C. Trautmann
a, R.
Neumann
a, and A. Benyagoub
daGesellschaft f¨ur Schwerionenforschung (GSI), Planckstr.1, 64291 Darmstadt, Germany
b
Technische Universit¨at Darmstadt, Hochschulstrasse 1, Germany
c
University of Michigan, 1100 N. University Avenue, 48109 Ann Arbor, USA
d
CIMAP, rue Claude Bloch, BP 5133, F-14070 Caen Cedex, France
Abstract
Exposing pressurized crystals to GeV heavy ions reveals unexpected structural changes. Irradiated at ambient conditions, natural zirconia (ZrO2) transforms from the monoclinic structure to its tetragonal (high-temperature) phase. For this process the required fluence must exceed 5×10¹²
ions/cm2
for Pb and U, and become even significantly higher for lighter ions. If samples are pressurized during irradiation using diamond anvil cells, the required fluence drops at least by one order of magnitude. The efficiency of the monoclinic to tetragonal phase transition becomes larger with increasing pressure.
Keywords: Zirconia, phase transition, high pressure, irradiation effect, Raman spectroscopy
∗Corresponding author. Tel.: +49-6159-71-2033
1
Introduction
The initial motivation in combining high-pressure and irradiation with swift heavy ions has its origin in geophysics, where fission tracks are analyzed for dating purposes [1][2]. Also in materials science, the question how solids re-spond to the simultaneous exposure to pressure and extreme energy input has raised large interest [3]. The creation of new phases otherwise not accessible may become possible for manufacturing novel substances with particular char-acteristics. In this study, we are concentrating on zirconia, which is known for its thermal and mechanical resistance and its radiation hardness. Because of these properties, ZrO2 is often used as inert fuel matrix in nuclear reactors [4] [5] or as a container for radioactive e.g. plutonium waste [6].
At ambient temperature and pressure conditions, ZrO2 is a white powder with a monoclinic structure. ZrO2 has two known high-pressure polymorphs (or-thorombic I and or(or-thorombic II [7]) and two different high-temperature poly-morphs (tetragonal and cubic) (see Fig 1).
At about 1200◦C, a martensitic-type phase transition occurs to a tetragonal derivative of the fluorite structure, and at around 2400◦C another structural phase transition leads to a true cubic fluorite structure that is stable up to the melting temperature of ∼2700◦C [8]. These high-temperature phases cannot be quenched, but they can be stabilized at room temperature by replacing up to 15% of Zr with larger cations (e.g. La, Mg, Y) [9]. Stoichiometric as well as sta-bilized zirconia has previously been irradiated with a wide spectrum of energetic particles in the nuclear [10][11][12][13] and electronic stopping regime [8][14][15]. Both compound shows a remarkable resistance against amorphization if the grain size is not on the nm scale [16]. The polymorphism of zirconia plays an important role for the evolution of the radiation damage. ZrO2 is one of the few materials that undergoes, instead of amorphization, a crystalline-crystalline (displacive) phase transition to the higher symmetry phase, i.e. monoclinic ZrO2 transforms either to the tetragonal or the cubic structure. Once this has occured, the new crystalline phase persists without further transitions as observed e.g.
with 800-keV Bi ions dominated by nuclear stopping [12] and with various swift heavy ions for which the electronic stopping exceeded 13 keV/nm [17][8][18][19]. However, even at high fluences, the transformation into the tetragonal poly-morph is not complete but saturates below 100% [17]. In contrast to tetragonal ZrO2 created by heating, the radiation induced tetragonal phase does not re-turn to the monoclinic form. Including pressure as an additional parameter, new aspects of the structural transformations can be investigated.
2
Experimental
For pressurization of samples, Diamond Anvil Cells (DAC) of the Merrill-Bassett type [20] were used. Several grains (size ∼ 0.2 µm) of monoclinic ZrO2powder (from Goodfellow company) were inserted in the central aperture (diameter of 150 µm) of a stainless steel gasket mounted between two diamonds each with a culet face with a diameter of 600 µm and a thickness of 2.64 mm. In addition, the sample chamber was filled with a 16:3:1 mixture of methanol:ethanol:water as optically transparent pressure medium to insure hydrostatic conditions [21]. Pressure was applied by squeezing the gasket by two diamonds up to a pressure between 4.3 and 13.4 GPa. The pressure was measured by adding a small ruby crystal into the sample chamber and measuring the wavelength of the red flu-orescence line [22]. The pressurized ZrO2 samples embedded in the DAC were exposed to relativistic ions from the SIS heavy-ion synchrotron of GSI (Darm-stadt). The experiments were performed at room temperature using either238
U or208
Pb ions with kinetic energies of about 200 MeV per nucleon (MeV/u) (see Table 1).
The energy is high enough so that the ions traverse the first diamond and the entire sample (Fig 2). Moreover, the energy loss inside the sample is close to the Bragg maximum. Details of the irradiation parameters are summarized in Table 1. The irradiation experiment at the SIS was performed with a pulsed beam of 0.3 spills/s (extraction time of each spill ∼ 1.4 seconds) containing
about ∼ 2-5×10⁸
ions/cm2
per spill. The flux was monitored via a calibrated secondary-electron emitting detector (SEETRAM) [23]. The fluence applied ranged between 1 and 2.5×10¹¹
ions/cm2
. Fluence cross-checks were performed by counting tracks in an irradiated mica sample inspected by atomic force mi-croscopy [24]. As reference, an additional ZrO2 sample was irradiated behind a diamond applying identical conditions, but without external pressure. At the SIS, the beamtime and thus possible maximum fluences are limited therefore we performed additional reference irradiations to test radiation effects at high fluences (fluence series of 5×10¹⁰
to 5×10¹²
ions/cm2
) with238
U and208 Pb ions at the UNILAC (Universal Linear Accelerator) of GSI. Because the maximum available energy at the UNLIAC is only 11.1 MeV/u (corresponding to a range of ∼ 60 µm for U-ions), the ZrO2 samples were irradiated without using the DAC. The energy loss was 42 keV/nm for208
Pb and 53 keV/nm for 238 U, re-spectively. Both values are well above the threshold of 13 keV/nm necessary for a transformation from the monoclinic to the tetragonal phase [8]. After ir-radiation, the samples were analyzed by confocal Raman spectroscopy using a HR800-180◦ system (Horiba Jobin Yvon) with a 20 mW He-Ne-Laser and an excitation wavelength of 632.8 nm.
3
Results and Discussion
The Raman spectra of ZrO2 before and after irradiation with 208
Pb ions at the UNILAC are displayed in Fig. 3. Up to a fluence of 1×10¹²
ions/cm2 for Pb as well as U, the Raman spectra hardly change and predominantly show the bands typical of monoclinic ZrO2 at 180, 190, 334, 348, 380, 476, 617, and 638 cm−1[13][25]. At fluences around 2×10¹²
ions/cm2
, small modifications become visible. At 5×10¹²
ions/cm2
and above, the spectra exhibit new broad bands located at 148, 260, 465, and 640 cm−1 which are assigned to the tetragonal phase of ZrO2 [8][25][26]. For both ion species, this transformation occurs in a rather small fluence regime between 2×10¹²
and 5×10¹²
ions/cm2
fluence increase to 7.5×10¹²
Pb-ions/cm2
does not induce additional changes. This effect is similar to the observations made earlier by Benyagoub for Ni (135 MeV) and Kr (300 MeV) ions [27], but saturation for these lighter ions requires fluences higher than 2.5×10¹³
ions/cm2
. Also in agreement with [27], Pb- or U-irradiated ZrO2 does not fully transform into its tetragonal phase but still exhibits some Raman bands of the monoclinic phase (e.g. at 180 and 190 cm−1.) The samples irradiated at high pressure show quite different results. In a first approach, Raman spectra of irradiated ZrO2 samples still pressurized in the DAC to 10.9 GPa were recorded, but the quality of the spectra is quite poor, because the Raman light has to pass the diamond twice before reaching the detector. Therefore, the intensity of the signal is extremely weak, and the background increases enormously so that recording a single spectrum may take several hours. In the few spectra collected, no significant change could be observed, which was not too surprising given the low fluences available for the DAC irradiation. Another complication for a comparative study resulted from the fact that at a pressure of 10.9 GPa, the ZrO2sample is no longer monoclinic but has transformed to its high-pressure orthorombic I phase.
The Raman investigations concentrated on samples removed from the DAC, i.e. at ambient conditions. With the mapping function, several areas of the sample were examined using the microscope objective with the largest magnification (100x) with a spatial resolution of about 1 µm.
Surprisingly, the Raman spectra varied strongly with the position where the spectrum was acquired. Fig. 4 shows four representative Raman spectra of the sample irradiated with 2.5×10¹¹
Pb-ions/cm2
at 10.9 GPa. Spectrum (a) resembles that of an unirradiated monoclinic ZrO2 sample and was found at about 50% of the tested sample areas. Spectrum (b) is dominated by deformed monoclinic ZrO2bands with a small trace of tetragonal ZrO2indicated by bands at 148 and 260 cm−1. Spectrum (c) shows a mixture of monoclinic and tetrag-onal ZrO2 while spectrum (d) resembles that of almost pure tetragonal ZrO2. A nearly complete transformation appeared at about 7% of the tested sample
areas while all other spectra showed different mixtures of monoclinic and tetrag-onal ZrO2. Comparing the relative intensities of the monoclinic bands at 180 and 190 cm−1 and the tetragonal band at 148 cm−1, the amount of monoclinic ZrO2 (Xm) in the two-phase mixture can be estimated from the intensities of the monoclinic (Im) and tetragonal (It) bands [25].
Xm=
Im(180 cm−1) + Im(190 cm−1)
Im(180 cm−1) + Im(190 cm−1) + It(148 cm−1)
(1) Eq. (1) yields Xm = 99% for spectrum 4a, Xm = 97% for 4b, Xm= 70% for 4c, and Xm= 13% for 4d. This significantly exceeds the tetragonal content of the sample irradiated with 7.5×10¹²
Pb-ions/cm2
at the UNILAC where the amount of monoclinic ZrO2 did not surpass 28%.
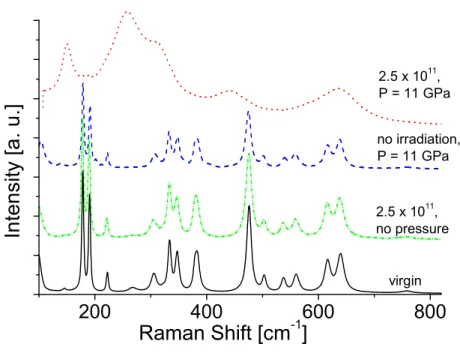
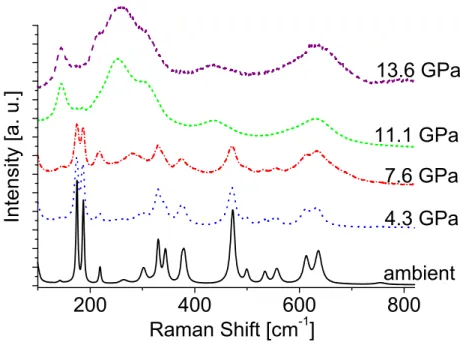
To exclude that pressure alone could have caused this strong transformation, a reference sample was pressurized to 11 GPa remaining in the DAC for two weeks. A second reference sample which was irradiated through a single dia-mond without being pressurized was also analyzed. The Raman spectra of both reference samples showed no deviation from a virgin sample (see Fig 5). To determine the effect of pressure, ZrO2 samples were irradiated at various pressures (ambient, 4.3, 7.6, 11.1, and 13.6 GPa) while keeping energy and fluence (1.5×10¹¹
U-ions/cm2
) constant (see Table 1). As stated before, the transformation of the sample is not homogeneously distributed, and thus it is difficult to directly compare the Raman spectra of the different samples. There-fore, for each sample the spectrum that showed the largest amount of tetragonal phase was selected (see Fig. 6). Up to 7.6 GPa, no strong transformation of ZrO2 can be observed, but only the merging of the two lines at 305 cm−1 and the appearing band at 260 cm−1. The latter belongs to the tetragonal phase and indicates the beginning of the phase change. In the sample irradiated at 11.1 GPa, areas that underwent a pronounced transformation to the tetragonal phase were found. For a pressure of 13.6 GPa, the transformation is slightly stronger than for 11.1 GPa. The originally prominent bands of the monoclinic phase at 180 and 190 cm−1 vanished almost completely. The degree of transformation is even more advanced than for the irradiation with 5×10¹²
U-ions/cm2 at the
UNILAC, where the electronic energy loss was about 40% higher compared to the irradiation at the SIS. The pressure applied during the irradiation obviously plays an important role in the mechanism of the monoclinic-tetragonal transfor-mation since at higher pressures the tetragonal phase reaches a higher fraction. Reference samples showed that neither pressure nor irradiation with 1.5×10¹¹ U-ions/cm−2 alone could induce this degree of transformation, and therefore the effect must be linked to the combination of both.
Several authors tried to explain the mechanism of the monoclinic-tetragonal transformation induced by high-energetic as well as low-energetic heavy ions [28][29][12][15]. Investigation of the development of the tetragonal phase as a function of fluence showed a sigmoidal curve with saturation at about 85% tetragonal ZrO2[14][15][12]. This sigmoidal behavior suggests a mechanism for the phase transition which needs two ion impacts [30][8][12]. The first ion is assumed to create defects, mainly oxygen vacancies, that generate an important strain field in the neighborhood in the monoclinic phase of ZrO2and might be responsible for lowering the transition temperature [27][12]. These local strain fields are necessary to trigger the phase transformation by the second ion im-pact.
This might be an explanation why a pressurized sample displays this trans-formation already at fluences more than one magnitude lower than needed at ambient pressure conditions. A sufficiantly high pressure induces a strain that otherwise has to be created by the first ion impact. In this case, the first ion takes over the part of the second ion in triggering the phase transition, and a double impact is no longer necessary. This could also explain why the transfor-mation appears only locally within the sample. At 1.5×10¹¹
ions/cm2 , about 10% of the sample area has been covered by ion hits assuming a track diameter of about 10 nm. It should be noted, that Raman Spectroscopy allows us to detect this displacive phase transition only if the area reaches an extension of several µm2
4
Conclusion
This work presents first results of effects in ZrO2irradiated at various pressures with relativistic Pb and U ions. We demonstrated that the phase transition from monoclinic to tetragonal ZrO2, which is known to occur under high-fluence ir-radiation [14][27][12], begins at fluences more than one magnitude lower if the pressure exceeds 11 GPa. Reference experiments showed that neither pres-sure nor irradiation alone can provoke such a strong transformation. Obviously the combination of both parameters plays a crucial role in the transformation mechanism. The pressure must exceed a certain value in order to initiate the transformation and further pressure increase enhances this process. The phase transformation is not homogeneous throughout the sample volume. In contrast to irradiation at ambient conditions it appears only locally and the degree of the transformation varies strongly depending on the measured position. This may indicate that under pressure the structural transition does not require a double hit process, because pressure takes over the role of the first ion by inducing a strain field within the sample.
Acknowledgement: M. Lang gratefully acknowledges financial support from the Ger-man Science Foundation (DFG).
References
[1] G.A. Wagner and P. van den Haute. Fission-Track Dating, volume 6 of Solid Earth Sciences Library. Kluwer Academic Publishers, 1992.
[2] R.L. Fleischer and P.B. Price. Journal of Geophysical Research, 69:331–339, 1964. [3] U.A. Glasmacher, M. Lang, H. Keppler, F. Langenhorst, R. Neumann, D. Schardt, Ch.
Trautmann, and G.A. Wagner. Physical Review Letters, 96(195701), 2006.
[4] V.M. Oversby, C.C. McPheeters, C. Degueldre, and J.M. Paratte. Journal of Nuclear Materials, 245:17–26, 1997.
[5] C. Degueldre. Journal of Nuclear Material, 320:96–105, 2003.
[7] O. Ohtaka, H. Fukui, T. Kunisada, and T. Fujisawa. Physical Review B, 63(174108), 2001.
[8] A. Benyagoub. Physical Review B, 72(094114), 2005.
[9] A. Meldrum, L. A. Boatner, and R. C. Ewing. Nuclear Instruments and Methods B, 207(1):28–35, 2003.
[10] K.E. Sickafus, H. Matzke, K. Yasuda, J.A. Valdez, P. Chodak III, M. Nastasi, and R.A. Verrall. Journal of Nuclear Materials, 274:66–77, 1999.
[11] M. Tang, J.A. Valdez, and K.E. Sickafus. Applied Physics Letters, 90, 2007.
[12] D. Simeone, G., D. Gosset, and S. Le Ca¨er. Nuclear Instruments and Methods B, 250:95– 100, 2006.
[13] J. A. Valdez, M. Tang, Z. Chi, M. I. Peters, and K. E. Sickafus. Nuclear Instruments and Methods B, 218:103–110, 2004.
[14] A. Benyagoub, F. Couvreur, S.Bouffart, et al. Nuclear Instruments and Methods B, 175-177:417–421, 2001.
[15] G. Baldinozzi, D. Simeone, D. Gosset, I. Monnet, S. Le Ca¨er, and L. Mazerolles. Physical Review B, 74(132107), 2006.
[16] A. Meldrum, L.A. Boatner, and R.C. Ewing. Physical Review Letters, 88(025503), 2002. [17] A. Benyagoub, F. Levesque, F. Couvreur, C. Gibert-Mougel, C. Dufour, and E. Paumier.
Applied Physics Letters, 77(20), 2000.
[18] A. Benyagoub. The European Physical Journal B, 34:395–398, 2003.
[19] C. Gibert-Mougel, F.Couvreur, J.M. Constantini, S. Bouffard, et al. Journal of Nuclear Materials, 295:121–125, 2001.
[20] L. Merrill and W.A. Bassett. Rev. Sci. Instruments, 45:290–294, 1974.
[21] R. Miletich, D.R. Allan, and W.F. Kuhs. In R.M. Hazan and R.T. Downs, editors, High-Temperatur and High-Pressure Crystal Cemistry, volume 41. Mineralogical Society of America, 2000.
[22] H.K. Mao, J. Xu, and P.M. Bell. Journal of Geophysical Research, 91:4673–4676, 1986. [23] B. Jurado, K.-H. Schmidt, and K.-H. Behr. Nuclear Instruments and Methods A,
[24] J. Ackermann, N. Angert, R. Neumann, C. Trautmann, M. Dischner, T. Hagen, and M. Sedlacek. Nuclear Instruments and Methods B, 107:181–184, 1996.
[25] B. Kim, J. Hahn, and K. R. Han. Journal of Materials Science Letters, 16, 1997. [26] J-M. Costantini, A. Kahn-Harari, F. Beuneu, and F. Couvreur. Journal of Applied
Physics, 99(123501), 2006.
[27] A. Benyagoub. Nuclear Instruments and Methods B, 218:451–456, 2004. [28] A. Benyagoub. Nuclear Instruments and Methods B, 206:132–138, 2003. [29] A. Benyagoub. Nuclear Instruments and Methods B, 245:225–230, 2006. [30] W.J. Weber. Nuclear Instruments and Methods B, 166-167:98–106, 2000.
[31] J.F. Ziegler and J.P. Biersack. The stopping and the Range of Ions in Matter SRIM-2006. http://www.srim.org, 2006.
0
0
5
10
15
20
500
1000
2000
2500
1500
cubic
orthoII
orthoI
tetragonal
monocl.
Temperature (°C)
Pressure (GPa)
Figure 1: Phase diagram of ZrO2[7]
Sample Ion Pressure Fluence Ei Ef dE/dx
[GPa] [ions/cm2
] [GeV] [GeV] [keV/nm]
SIS beam ZrO2 01 208Pb 10.9 2.5×10¹¹ 204 35 30 ZrO2R1 208Pb ambient 2.5×10¹¹ 204 35 30 ZrO2 02 238U 4.3 1.5×10¹¹ 228 39 37 ZrO2 03 238U 7.6 1.5×10¹¹ 228 39 37 ZrO2 04 238U 11.0 1.5×10¹¹ 228 39 37 ZrO2 05 238U 13.6 1.5×10¹¹ 228 39 37 ZrO2R2 238U ambient 1.5×10¹¹ 228 39 37 ZrO2 06 238U 11.2 1.5×10¹¹ 228 39 37 UNILAC beam ZrO2 238U ambient 5×10¹⁰- 5×10¹² 2.64 53 ZrO2 208Pb ambient 5×10¹⁰-7.5×10¹² 2.31 42
Table 1: Parameters of irradiation experiments. Ei denotes the initial kinetic ion energy and Ef the ion energy when reaching the sample. dE/dx is the mean electronic energy loss deposited in the sample. The values were calculated with the SRIM 2006 code [31] taking into account the different in-beam components (detector foils, exit window, air gap, and anvil).
Beamline Air gap45 cm Aluminum window DAC Sample Secondary-electron transmission monitor
Figure 2: Schematics of sample irradiation at the heavy-ion synchrotron SIS (not to scale) [3]. Before reaching the sample, the beam exits the beamline through an Al-window and travels through 45 cm air and 2.6 mm diamond. The energy, energy loss, and ion range is estimated by calculation with the SRIM06 code [31].
200
400
600
800
t
t
t
m
m
m
In
te
n
s
it
y
[
a
.
u
.]
Raman Shift
[
cm
-1]
m
t
virgin
3 x 10
117.5 x 10
112 x 10
125 x 10
127.5 x 10
12Figure 3: Raman spectra of ZrO2 irradiated with Pb-ions (2.3 GeV) of various fluences ions/cm2
a)
b)
200 400 600 800In
te
n
s
it
y
[
a
.
u
.]
Raman Shift [cm
-1]
c)
200 400 600 800Raman Shift [cm
-1]
d)
145 260 452 640Figure 4: Raman spectra recorded outside the DAC at different positions of sam-ple ZrO2-01 (see Table 1) irradiated at 10.9 GPa with 2.5×10¹¹ Pb-ions/cm2.
200
400
600
800
In
te
n
s
it
y
[
a
.
u
.]
Raman Shift [cm
-1]
virgin 2.5 x 10¹¹, no pressure no irradiation, P = 11 GPa 2.5 x 10¹¹, P = 11 GPaFigure 5: Raman spectrum of sample ZrO2-01 (dotted line, irradiated un-der pressure) compared to reference samples only exposed to either irradiation (dash-dotted) or pressure (dashed) and virgin ZrO2.
200
400
600
800
In
te
n
s
it
y
[
a
.
u
.]
Raman Shift [cm
-1]
ambient
4.3 GPa
7.6 GPa
11.1 GPa
13.6 GPa
Figure 6: Raman spectra recorded outside the DAC of samples ZrO2 02 - 05 and R2 irradiated with 1.5×10¹¹
U-ions/cm2
![Figure 1: Phase diagram of ZrO 2 [7]](https://thumb-eu.123doks.com/thumbv2/123doknet/12985181.378645/12.892.187.523.198.494/figure-phase-diagram-of-zro.webp)
![Figure 2: Schematics of sample irradiation at the heavy-ion synchrotron SIS (not to scale) [3]](https://thumb-eu.123doks.com/thumbv2/123doknet/12985181.378645/13.892.277.634.394.700/figure-schematics-sample-irradiation-heavy-synchrotron-sis-scale.webp)