HAL Id: tel-00984299
https://tel.archives-ouvertes.fr/tel-00984299
Submitted on 28 Apr 2014
HAL is a multi-disciplinary open access
archive for the deposit and dissemination of sci-entific research documents, whether they are pub-lished or not. The documents may come from teaching and research institutions in France or abroad, or from public or private research centers.
L’archive ouverte pluridisciplinaire HAL, est destinée au dépôt et à la diffusion de documents scientifiques de niveau recherche, publiés ou non, émanant des établissements d’enseignement et de recherche français ou étrangers, des laboratoires publics ou privés.
The role of the banking sector performance in the crisis
of 2007
Varvara Isyuk
To cite this version:
Varvara Isyuk. The role of the banking sector performance in the crisis of 2007. Economics and Fi-nance. Université Panthéon-Sorbonne - Paris I, 2013. English. �NNT : 2013PA010052�. �tel-00984299�
UNIVERSIT´
E PARIS 1 PANTH´
EON-SORBONNE
U.F.R. DE SCIENCES ´
ECONOMIQUES
TH`ESE DE DOCTORAT
Pr´esent´ee par Varvara ISYUK Pour obtenir le grade de
Docteur en sciences Sp´ecialit´e:
´
Economie
THE ROLE OF THE BANKING SECTOR PERFORMANCE IN
THE CRISIS OF 2007
Sous la direction de Jean-Bernard CHATELAIN
Composition du Jury:
Jean-Bernard CHATELAIN Professeur `a l’Universit´e Paris 1 Panth´eon-Sorbonne Directeur Laetitia LEPETIT Maˆıtre de conf´erences habilit´e `a diriger des recherches
`
a l’Universit´e de Limoges
Rapporteur
Christophe GODLEWSKI Professeur `a Universit´e de Strasbourg Rapporteur
J´ezabel
COUPPEY-SOUBEYRAN
Maˆıtre de conf´erences habilit´e `a diriger des recherches `
a l’Universit´e Paris 1 Panth´eon-Sorbonne
Examinateur
Abstract
The bursting of the housing bubble and subsequent collapse of asset prices were at the origin of the large negative shock on the performance of the banking sector during the onset of the 2007 financial crisis. The drying-up of liquidity and freezing of the interbank markets led to the debasement of banks’ balance sheets, causing these institutions to choose between issuing equity or reducing lending in order to restore their capital positions. At the same time, both bank lending and business production suffered from the drop in consumer demand caused by the fall in asset prices, negative or weak economic growth, rising unemployment and the loss of consumer confidence.
The second chapter of this thesis focuses on determining how much of the decline in non-financial firms’ stock prices was due to liquidity shortages and how much to lower-than-expected consumer demand. Stock returns are examined over nine periods between July 31, 2007 and March 31, 2010. The near-collapse of Bear Stearns and failure of Lehman Brothers are both characterised as liquidity shocks that had a greater impact on financially fragile non-financial firms. The presented findings show that the improvement in demand expec-tations positively affected the performances of U.S. non-financial firms in the early months of recovery. In later periods, however, neither the amelioration in demand expectations nor the improvement of financial conditions could explain their performances.
In the second half of 2008, after a series of bankruptcies of large financial institutions, the U.S. Treasury poured capital infusions into domestic financial institutions under the Capital Purchase Program (CPP), thus helping to avert a complete collapse of the U.S. banking sector. In carrying out this effort, government regulators had to distinguish between those banks deserving of being bailed out and those that should be allowed to fail. The determi-nants of the allocation of CPP funds among commercial banks in the U.S. are analysed in Chapter 3. The results of this study show that the CPP favored larger financial institutions whose potential failure represented higher degrees of systemic risk. This allocation of CPP funds was cost-effective from the point of view of taxpayers, as such banks reimbursed the
government for their CPP bailouts sooner than expected. In contrast, smaller banks that were heavily into mortgage-backed securities, mortgages, and non-performing loans were less likely to be bailed out and, if they did receive CPP help, took longer to repurchase their shares from the Treasury.
Finally, the effectiveness of the CPP is analysed in Chapter 4 in terms of restoring banks’ loan provisions. Again, the relative impacts of liquidity shortages (which negatively affected banks’ willingness to lend) and the contraction in aggregate demand for bank loans are examined. The empirical evidence on the effects of capital shortages supports the theory. Banks that have a higher level of capitalisation tend to lend more both during the crisis and in normal times. Moreover, it is found that bailed-out banks displayed higher growth rates of loans during the crisis than in normal times (before 2008) as well as higher rates compared with non-bailed banks during the crisis, with a one percentage point increase in the capital ratio. In addition, bailed-out banks that repurchased their shares from the U.S. Treasury provided more loans during the crisis than those banks that did not.
Acknowledgments and Thanks
First and foremost I want to thank my supervisor Jean-Bernard Chatelain. I am ex-tremely grateful for his support and guidance starting from the project of my thesis in June 2010 until its defence. His thoughtful advices helped me to advance with publishing chapters of this thesis and preparing its final version for the defence. I appreciate all his contributions of time, ideas and enthusiasm throughout the last three years.
I would like to acknowledge J´ezabel Couppey-Soubeyran for insightful questions and comments at the ”S´eminaire 18 mois” in 2012 and for the honour of participating in my thesis jury. I would like to express my gratitude to the referees of my thesis Laetitia Lepetit and Cristophe Godlewski for the time that they spent to review my thesis and for their helpful reports.
I thank the referees of International Economics and Ekonomi-tek as well as participants of the 1st PhD Student Conference in International Macroeconomics, Doctorissimes 4, Inter-national Conference in Economics (ICE-TEA) and Finance Seminar (Columbia University) for their insightful questions and detailed reports that allowed me to improve my thesis. Par-ticularly I would like to acknowledge Sophie B´ereau for her comments during our insightful discussion at the ”S´eminaire 18 mois”.
I would also like to thank the participants and the organisers of the Institutions seminar and Macro PhD Workshop for their useful comments and discussions. Particularly, I would like to thank the members of my laboratory and my ”neighbours” Thibault, Delila, Marie-Agnes, Bruno et Coralie who were always supporting, encouraging and ready to help.
Last but not least, I thank my dear family and friends in Russia, France and Belgium for all their love and encouragement. And most of all my love Alexander for his faithful support and patience that was so appreciated. Thank you.
Contents
1 Introduction and outline of the thesis 1
1.1 Credit channel during the crisis . . . 1
1.1.1 Balance sheet channel . . . 1
1.1.2 Bank lending channel . . . 4
1.2 Chapter 2. Distinguishing between the effects of demand and financial shocks 5 1.3 Capital Purchase Program (CPP) during the crisis . . . 9
1.3.1 Capital Purchase Program and its place among other measures . . . . 9
1.3.2 Endogeneity of the Capital Purchase Program . . . 11
1.3.3 Chapter 3. Determinants of the allocation of funds and their repay-ments under the CPP . . . 14
1.4 Capital Purchase Program and its impact on banks and loan supply . . . 16
1.4.1 CPP funds disbursement and bank’s value . . . 16
1.4.2 Loan supply during the crisis period . . . 18
1.4.3 Chapter 4. Resuming bank lending in the aftermath of the Capital Purchase Program . . . 20
1.5 Conclusion . . . 24
2 Financial versus Demand shocks in stock price returns of U.S. non-financial firms in the crisis of 2007 25 2.1 Introduction . . . 25
2.2 Theoretical background and model specification . . . 30
2.3 Data and summary statistics . . . 32
2.3.1 Data sources . . . 32
2.3.2 Dependent variable: different time windows for stock returns . . . 33
2.3.3 Descriptive statistics . . . 38
2.3.4 Balance sheet characteristics . . . 40
2.3.5 Sensitivity to the shock on demand expectations . . . 45
2.3.6 Control variables . . . 51
2.4 Cross-section estimations of the non-financial stock returns determinants . . 52
2.4.1 Stock returns in the TW window and other large windows (over 15–19 months of the financial crisis) . . . 52
2.4.2 Stock returns over 1 to 1.5 months following the Bear Stearns near-collapse and the failure of Lehman Brothers . . . 56
2.4.3 Stock returns over 1 to 3 months during the recovery period following March, 2009 . . . 58
2.4.4 Robustness checks . . . 60
2.5 Conclusion . . . 61
Appendices for Chapter 2 67 A Sample selection 68 B Construction of the variables 70 B.1 The balance sheet characteristics associated with firm financial constraint . . 70
B.2 Sensitivity indexes to demand shock . . . 71
B.3 Control variables . . . 73
C Log growth rates versus Discrete growth rates 75
3 Determinants of the allocation of funds under the Capital Purchase
Pro-gram 77
3.1 Introduction . . . 77
3.2 Estimation methodology . . . 81
3.2.1 Determinants of CPP funds allocation in 2008–2009: logit and OLS regressions . . . 81
3.2.2 Multinomial (polytomous) logistic regression . . . 82
3.2.3 Duration analysis . . . 84
3.3 Data and summary statistics . . . 87
3.3.1 Data description . . . 87
3.3.2 Dependent variables . . . 87
3.3.3 Bank balance-sheet characteristics . . . 92
3.3.4 Systemic Risk variables . . . 97
3.3.5 Political Involvement and Location indicators . . . 101
3.3.6 Bank’s excessive risk-taking . . . 101
3.3.7 Multicollinearity problem . . . 102
3.4 Results . . . 103
3.4.1 Logit and OLS regressions analysing the bank bailout probability and the relative size of the amount disbursed under the CPP . . . 103
3.4.2 Polytomous logistic model . . . 107
3.4.3 Time-to-repayment analysis . . . 115
3.5 Conclusion . . . 119
Appendix for Chapter 3 121 D Systemic Risk indicators 122 4 Resuming bank lending in the aftermath of the Capital Purchase Program125 4.1 Introduction . . . 125
4.2 Model and estimation methodology . . . 129
4.2.1 Model . . . 129
4.2.2 Endogeneity bias . . . 133
4.2.3 Fixed effects estimator . . . 136
4.2.4 Mundlak-Krishnakumar estimator . . . 139
4.2.5 Hausman-Taylor estimator . . . 141
4.2.6 Instrumental variables estimator . . . 142
4.2.7 Arellano-Bond: difference GMM estimator . . . 144
4.2.8 Two-step system GMM estimator . . . 146
4.2.9 Choice of instruments for system GMM . . . 147
4.3 Construction of the variables . . . 153
4.3.1 Data description . . . 153
4.3.2 Dependent variables . . . 153
4.3.3 Individual bank-specific characteristics . . . 159
4.3.4 Dummies and macroeconomic variables . . . 167
4.4 Results . . . 169
4.4.1 Fixed Effects Model . . . 169
4.4.2 Mundlak-Krishnakumar Estimator . . . 183 4.4.3 Hausman-Taylor Estimator . . . 194 4.4.4 Instrumental variables . . . 200 4.4.5 Difference GMM estimator . . . 204 4.4.6 System GMM estimator . . . 208 4.4.7 Summary results . . . 221 4.5 Conclusion . . . 223 5 Conclusion 228
Appendices for Chapter 4 232
E Correlation tables 233 F Selection of lags of the instrumenting variables used in first-difference and
level equations 255
G Within estimator (FE). The effects of CPP funds disbursement and crisis on bank lending activity. Regression without autoregressive component 257 H Mundlak estimator. The effects of CPP funds disbursement and crisis on
bank lending activity. Regression with autoregressive component 259 I Mundlak estimator. The effects of CPP funds repayment and crisis on
bank lending activity. Regression with autoregressive component 263 J Hausman-Taylor estimator. The effects of CPP funds disbursement and
crisis on bank lending activity. Regression with autoregressive component267 K Hausman-Taylor estimator. The effects of CPP funds repayment and crisis
on bank lending activity. Regression with autoregressive component 270 L IV estimator. The effects of CPP funds repayment and crisis on bank
lending activity. Regression with autoregressive component 273
Bibliography 293
List of Figures
1.2.1 S&P 500 composite index displayed on a logarithmic scale from January 1, 2007 to October 1, 2010 . . . 7 1.3.1 Bailout and repayment decision . . . 15 1.4.1 Median annual total loans growth rates . . . 21 2.3.1 S&P 500 composite index displayed on a logarithmic scale from January 1,
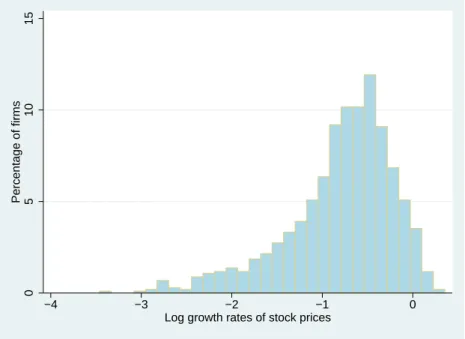
2007 to October 1, 2010 . . . 36 2.3.2 Distribution of log growth rates of stock prices in the LW1 (July 31, 2007 to
Oct 27, 2008) for U.S. non-financial firms . . . 39 2.3.3 Distribution of discrete growth rates of stock prices in the LW1 (July 31, 2007
to Oct 27, 2008) for U.S. non-financial firms . . . 40 2.3.4 Distribution of log growth rates of firm stock prices with removed 5th and 95th
percentiles in the LW1 (July 31, 2007 to Oct 27, 2008) for U.S. non-financial firms . . . 40 2.3.5 The percentage distribution of Altman’s Z-score dummy calculated for 2006
for U.S. non-financial firms . . . 41 2.3.6 Dow Jones U.S. total stock market index displayed on a logarithmic scale in
the period of 9/11 terrorist attack in the United States . . . 50 3.2.1 Bailout and repayment decision . . . 83 3.2.2 Kaplan-Meier survival function . . . 86
3.2.3 Estimates of the hazard function . . . 86
3.3.1 Distribution of actually disbursed bailout amount to bank total assets ratio, winsorized at 1% . . . 91
3.3.2 Distribution of the ordinal variable describing bailout and its repayment by commercial banks by May, 2012 . . . 91
4.3.1 Median annual total loans growth rates . . . 156
4.3.2 Median annual REML growth rates . . . 156
4.3.3 Median annual CIL growth rates . . . 157
List of Tables
1.1 Change in Stock Prices during the Subprime Crisis, U.S. non-financial firms, cross-sectional OLS estimation for small windows following the Bear Stearns near-collapse and the bankruptcy of Lehman Brothers . . . 8 1.2 The influence of the main factors determining the CPP funds disbursement
and repayment, U.S. commercial banks, from polytomous logistic regression and survival analysis. Base outcome for polytomous regression: bailout and total repayment . . . 17 1.3 Summary statistics on growth rates of loans . . . 23 2.1 The summary statistics of changes in stock returns for U.S. non-financial firms 34 2.2 Summary of balance sheet characteristics used to identify the financial
con-straints for U.S. non-financial firms . . . 42 2.3 Correlation among explanatory balance sheet and control variables for U.S.
non-financial firms . . . 46 2.4 Simple correlation with dependent variables over nine periods for U.S.
non-financial firms . . . 47 2.5 Summary of the indexes of sensitivity to demand shock . . . 48 2.6 Correlation between the sensitivity indexes to demand shock and control
vari-ables for U.S. non-financial firms . . . 51 2.7 Change in Stock Prices during the Subprime Crisis, U.S. non-financial firms,
cross-sectional OLS estimation for large windows with control variables . . . 54 xiii
2.8 Change in Stock Prices during the Subprime Crisis, U.S. non-financial firms, cross-sectional OLS estimation for small windows following the Bear Stearns near-collapse and the bankruptcy of Lehman Brothers . . . 57 2.9 Change in Stock Prices during the Subprime Crisis, U.S. non-financial firms,
cross-sectional OLS estimation for small recovery in stock prices windows . . 59 2.10 Change in Stock Prices (logs, removed 5th and 95th percentiles) during the
Subprime Crisis, U.S. non-financial firms, cross-sectional OLS estimation for large windows . . . 62 2.11 Change in Stock Prices (logs, removed 5th and 95th percentiles) during the
Subprime Crisis, U.S. non-financial firms, cross-sectional OLS estimation for small windows . . . 63 2.12 Change in Stock Prices (discrete growth rates) during the Subprime Crisis,
U.S. non-financial firms, cross-sectional OLS estimation for large windows . . 64 2.13 Change in Stock Prices (discrete growth rates) during the Subprime Crisis,
U.S. non-financial firms, cross-sectional OLS estimation for small windows . 65 3.1 Summary of dependent variables and balance sheet characteristics from
Alt-man’s and Moody’s models for U.S. commercial banks . . . 88 3.2 Correlation between dependent variables (dummy and relative size of bailout)
and explanatory balance sheet variables for U.S. banks . . . 90 3.3 Summary of BondScore balance sheet characteristics, systemic risk, political
involvement and individual risk-taking related variables . . . 99 3.4 Correlation between dependent variables (dummy and relative size of bailout)
and explanatory systemic risk, political influence, location and individual risk variables for U.S. banks . . . 100 3.5 Determinants of the bank bailout probability and the relative size of the bank
bailout under the Troubled Asset Relief Program in 2008-2009, U.S. commer-cial banks, stepwise cross-sectional estimation . . . 105
3.6 Determinants of the bank bailout and its repayment under TARP’s Capital Purchase Program between 2008 and 2012, U.S. commercial banks, polyto-mous logistic regressions. Base outcome: bailout and total repayment . . . . 108 3.7 Time-to-repayment analysis, U.S. commercial banks, proportional hazards
(PH) and accelerated failure time (AFT) models . . . 117 4.1 Resulting set of coefficients for the bank-specific characteristic BSC1 and its
interactions with dummies from models 4.2.1 and 4.2.2 . . . 133 4.2 Summary statistics on growth rates of loans . . . 155 4.3 Summary statistics . . . 160 4.4 Correlation coefficients for within-transformed dependent and main
explana-tory variables with no interactions . . . 162 4.5 Correlation coefficients for within-transformed dependent and main
explana-tory variables interacted with crisis dummy . . . 165 4.6 Correlation coefficients for within-transformed dependent and main
explana-tory variables interacted with bailout dummy . . . 166 4.7 Fixed effects robust estimator - Baseline regression results . . . 171 4.8 Fixed effects robust estimator - regression in first differences . . . 174 4.9 Fixed Effects estimator - The effects of CPP funds disbursement and
repay-ment on bank lending activity in normal times and during the crisis . . . 176 4.10 Fixed effects robust estimator - Subsample of non-bailed banks . . . 180 4.11 Fixed effects robust estimator - Subsample of bailed-out banks that repaid
CPP funds . . . 182 4.12 Fixed effects robust estimator - Subsample of bailed-out banks that did not
repay CPP funds . . . 184 4.13 Mundlak-Krishnakumar Estimator - The effects of CPP funds disbursement
and crisis on bank lending activity (without autoregressive component) . . . 185
4.14 Mundlak-Krishnakumar Estimator - The effects of CPP funds repayment and crisis on bank lending activity. Subsample of bailed-out banks. Regressions
without autoregressive variables. . . 191
4.15 Hausman-Taylor Estimator - The effects of CPP funds disbursement and crisis on bank lending activity (without autoregressive component) . . . 194
4.16 Hausman-Taylor Estimator - The effects of CPP funds repayment and crisis on bank lending activity. Subsample of bailed-out banks. Regressions without autoregressive components . . . 197
4.17 IV 2SLS - The effects of CPP funds disbursement and crisis on bank lending activity. Instrumented bailout dummy . . . 201
4.18 First-difference robust GMM estimator - Baseline regression results . . . 205
4.19 Two-step system robust GMM estimator - The effects of CPP funds disburse-ment and crisis on bank lending activity . . . 208
4.20 Summarized results for the effects of one unit increase in bank-specific vari-ables on loan growth rates for bailed-out/non-bailed banks in normal times/during the crisis . . . 211
4.21 Two-step system robust GMM estimator - The effects of CPP funds repay-ments and crisis on bank lending activity . . . 217
4.22 Summary results - ∆T L . . . 224
4.23 Summary results - ∆REM L . . . 225
4.24 Summary results - ∆CIL . . . 226
E.1 Correlation coefficients for within-transformed dependent and main explana-tory variables interacted with both bailout and crisis dummy . . . 234
E.2 Correlation coefficients for within-transformed dependent and main explana-tory variables interacted with repayment dummy . . . 235
E.3 Correlation coefficients for within-transformed dependent and main explana-tory variables interacted with repayment and crisis dummies . . . 236
E.4 Correlation coefficients between the instruments and the variables from first difference (Arellano-Bond) Equation 4.2.13 . . . 237 E.5 Correlation coefficients between the instruments and the variables from first
difference (Arellano-Bond) Equation 4.2.13. Continued (2) . . . 238 E.6 Correlation coefficients between the instruments and the variables from first
difference (Arellano-Bond) Equation 4.2.13. Continued (3) . . . 239 E.7 Correlation coefficients between the instruments and the variables from first
difference (Arellano-Bond) Equation 4.2.13. Continued (4) . . . 240 E.8 Correlation coefficients between the instruments and the variables from first
difference (Arellano-Bond) Equation 4.2.13. Continued (5) . . . 241 E.9 Correlation coefficients between the instruments and the variables from first
difference (Arellano-Bond) Equation 4.2.13. Continued (6) . . . 242 E.10 Correlation coefficients between the instruments and the variables from first
difference (Arellano-Bond) Equation 4.2.13. Continued (7) . . . 243 E.11 Correlation coefficients between the instruments and the variables from first
difference (Arellano-Bond) Equation 4.2.13. Continued (8) . . . 244 E.12 Correlation coefficients between the instruments and the variables from first
difference (Arellano-Bond) Equation 4.2.13. Continued (9) . . . 245 E.13 Correlation coefficients between the instruments and the variables from level
equation (system GMM) . . . 246 E.14 Correlation coefficients between the instruments and the variables from level
equation (system GMM). Continued (1) . . . 247 E.15 Correlation coefficients between the instruments and the variables from level
equation (system GMM). Continued (2) . . . 248 E.16 Correlation coefficients between the instruments and the variables from level
equation (system GMM). Continued (3) . . . 249
E.17 Correlation coefficients between the instruments and the variables from level equation (system GMM). Continued (4) . . . 250 E.18 Correlation coefficients between the instruments and the variables from level
equation (system GMM). Continued (5) . . . 251 E.19 Correlation coefficients between the instruments and the variables from level
equation (system GMM). Continued (6) . . . 252 E.20 Correlation coefficients between the instruments and the variables from level
equation (system GMM). Continued (7) . . . 253 E.21 Correlation coefficients between the instruments and the variables from level
equation (system GMM). Continued (8) . . . 254 F.1 Lags for generated GMM-style instruments in difference and system GMM . 255 G.1 Fixed effects robust estimator - Regressions with autoregressive component . 258 H.1 Mundlak-Krishnakumar Estimator - The effects of CPP funds disbursement
and crisis on bank lending activity (with autoregressive component) . . . 259 I.1 Mundlak-Krishnakumar Estimator - The effects of CPP funds repayment and
crisis on bank lending activity. Subsample of bailed-out banks. Regressions with autoregressive component . . . 263 J.1 Hausman-Taylor Estimator - The effects of CPP funds disbursement and crisis
on bank lending activity (with autoregressive component) . . . 267 K.1 Hausman-Taylor Estimator - The effects of CPP funds repayment and crisis
on bank lending activity. Subsample of bailed-out banks. Regressions with autoregressive components . . . 270
L.1 Instrumental variables 2SLS - The effects of CPP funds disbursement and crisis on bank lending activity. Dynamic model with instrumented bailout dummy . . . 273
1
Chapter 1
Introduction and outline of the thesis
1.1
Credit channel during the crisis
1.1.1
Balance sheet channel
The strength of borrowers’ balance sheets and their access to external financing The 2007 financial crisis was associated, first of all, with a severe financial shock that undermined the performance of the real economy. It started with the bursting of the U.S. housing bubble and deterioration of the financial sector that rather fast spread into the real sectors of economy. The credit channel played an important role in propagation of the financial shock on the sides of both banking and non-financial sectors. It comprises two subchannels that were distinguished by Bernanke and Gertler (1995) and that correspond to the respective transmission channels of the monetary policy: (i) balance sheet channel and (ii) bank lending channel. The former channel and the measures of firms’ vulnerabilities to shock propagation through this channel are analysed in this section.
The financial structure of the firm was considered irrelevant for determining its market value by Modigliani and Miller (1958). It implied that the firm’s value was unaffected by the way the firm financed its investment projects (through external or its own capital). However,
1.1. Credit channel during the crisis 2
Modigliani-Miller theorem assumed an efficient market in the absence of taxes, bankruptcy and agency costs and asymmetric information that proved to be unrealistic in the real market. The impact of frictions in financial markets on the financial constraints of firms, particularly in crisis, was later well investigated in the corporate finance and investment literature (see Chatelain, 2002).
Myers and Majluf (1984) and Calomiris and Hubbard (1990) proposed the following order of preference for the financing sources available to non-financial firms: the firm’s own capital, trade credit, capital market funds and bank credit. It is clear that the access to the latter two sources of financing and the attached conditions depend on the strength of borrowers’ balance sheets. Moreover, if its balance sheet carries large shares of debt or illiquid assets, a firm is expected to have trouble attracting external financing and obtaining bank credit because of the low value of its collateral, which can further lead to endogenous credit cycles (Kiyotaki and Moore, 1997; Braun and Larrain, 2005).
One of the best models existing prior to crisis dealing with imperfect capital markets were ”financial accelerator” dynamic stochastic general equilibrium models (DSGE), as high-lighted in Chatelain and Ralf (2012). These models assumed imperfect capital markets with bankruptcy costs or credit rationing where the debt of the non-financial firm was limited by the future value of its collateral. Hence, in these models firms with weaker balance sheets (i.e. a low level of capitalisation and liquidity) and poor credit performance were less likely to receive a loan.
The balance sheets of non-financial firms were significantly affected during the crisis of 2007. In the period after 2007 the decline in the value of assets eroded borrowers’ net worth faster than their gross worth (due to their leverage), which led to a reduction in the value of the collateral and subsequent fall in the amounts able to be borrowed (Brunnermeier, 2009). As highlighted earlier, monetary policy can also affect the non-financial sectors through the balance sheet channel (Bernanke and Gertler, 1995). In that vein, periods of tighter monetary policy are associated with a decline in the ability of smaller firms to raise funds
1.1. Credit channel during the crisis 3 (see also Kashyap and Stein, 1994; Kishan and Opiela, 1997).
Measures of vulnerability of non-financial firms to financial shocks based on their balance sheet indicators
The existence of balance sheet channel implies that firms that have limited access to financial markets should be more affected by liquidity shocks and changes in monetary con-ditions. Thus, the impact of distortions in financial markets on real activity depends on whether non-financial firms are vulnerable to financial shocks.
As highlighted in the previous section, in the presence of asymmetric information and transaction costs, there is a gap arising between the relative costs of external and internal sources of financing (Stiglitz and Weiss, 1981; Fazzari et al., 1988; Bernanke and Gertler, 1990; Calomiris and Hubbard, 1990 and Bond and Meghir, 1994). A part of the literature suggests to use cash flow sensitivities of firms as measures of their financial constraints. It is argued that firms that incur higher costs of external financing display higher sensitivities of fixed investments to changes in firm earnings (Fazzari et al., 1988; Carpenter et al., 1995; Himmelberg and Petersen, 1993; Calomiris and Hubbard, 1995).
Based on that approach to explaining firms’ financial constraints, Fazzari et al. (1988) propose an index of investment cash flow sensitivities and argue that the sensitivity of in-vestment to internal funds increases with the gap between the costs of internal and external financing. Kaplan and Zingales (1997) later provide evidence that investment cash flow sen-sitivities are unlikely to be useful measures of financial constraints and propose their own KZ index based on the balance sheet characteristics of non-financial firms. However, Hadlock and Pierce (2010) argue that the KZ index is unlikely to be a valid measure of a firm’s finan-cial constraints. Other examples of finanfinan-cial constraint indexes include Rajan and Zingales (1998) index of a firm’s sensitivity to external financing and Whited and Wu (2006) index, both of which are based on the balance sheet characteristics of firms.
1.1. Credit channel during the crisis 4
1.1.2
Bank lending channel
Bank lending channel is another mechanism of financial shock transmission to the real economy that focuses on the balance sheet characteristics of lenders (i.e. banks). Banks themselves borrow from financial markets, thus, tighter monetary policy or other external liquidity shocks (such as freezing up of interbank market during the recent crisis) induce banks to search for alternative sources of financing. The capacity of raising funds differs among banks that in turn leads to their heterogeneous responses in terms of altering supply of capital to the real economy. In the literature this question is often referred to as a trade-off between the marginal cost of issuing equity and the marginal cost of cutting back on lending. The results of the study conducted by Kiley and Sim (2010) suggest that the banks respond to a capital shock through a mix of financial disintermediation and recapitalisation.
The literature provides evidence of the influence of bank lending on macroeconomic fluctuations. Halvorsen and Jacobsen (2009) analyse the impact of bank lending on real activity in Norway and the U.K. over the past 21 years. The authors find that a contractive shock to bank lending induces a negative response for the output gap and places downward pressure on consumer prices.
Under the usual assumptions of bank lending literature small, less liquid or less capi-talised banks have more problems to offset the shocks and, thus, they are expected to grant fewer loans than banks with better respective balance sheet characteristics (Chatelain et al., 2003). In the recent study Tabak et al. (2010) confirm that during periods of easier (tighter) monetary policy, banks increase (decrease) their loan supply and that large, well-capitalised and liquid banks absorb better the effects of monetary policy decisions.
Similarly, Jim´enez et al. (2010) analyse the extension of lending to new clients (extensive margin) and change in the volumes of loans to old clients (intensive margin) using microe-conomic data on loan applications and granted loans in Spain. Such a dataset allows the authors to disentangle loan demand and supply as well as firm and bank balance sheet chan-nels. Their results suggest that during the period analysed both worse economic and tighter
1.2. Chapter 2. Distinguishing between the effects of demand and financial shocks 5
monetary conditions reduce loan granting, especially to firms or from banks with lower capi-tal or liquidity ratios. Moreover, firms cannot offset the resulting credit reduction by turning to other banks.
In case of the global shock the performance of both financial intermediaries and borrowers is affected, thus, two channels cause the shock transmission to the real economy. In the recent DSGE model of Hirakata et al. (2011) the authors try to compare the consequences of the adverse shock on financial sector with the one that hits borrower’s creditworthiness1 for the real economy. They estimate on the U.S. data that the former one leads to larger recessions than the latter one.
The impact of firms’ financial constraints as opposed to demand shock on firms’ perfor-mance during the crisis is first investigated in Chapter 2. The bank lending channel during the crisis and the influence of the Capital Purchase Program on bank lending is later analysed in Chapter 4.
1.2
Chapter 2. Distinguishing between the effects of
demand and financial shocks
The fall in aggregate consumer demand after the crisis in 2007 was no surprise: the higher household leverage before 2007 and the collapsing prices of houses and other assets together with the loss of consumer confidence contributed to the fall in and slow recovery of output, employment and consumption (Mian and Sufi, 2011). Disentangling the relative impacts of financial and demand shocks on real business activity is, however, a more difficult task. Fornari and Stracca (2012) prove that financial shocks have a non-negligible influence on key macroeconomic variables such as output, investment and price level and emphasise that whether the financial shock is mainly an aggregate demand shock or a supply shock remains
1
Deterioration of the borrower’s balance sheets in the article by Hirakata et al. (2011) leads to the revision of credit contracts.
1.2. Chapter 2. Distinguishing between the effects of demand and financial shocks 6 unclear.
In the literature that investigates business or lending activity, the effects of changes in aggregate demand are typically proxied by macroeconomic variables such as GDP growth (see Berrospide and Edge, 2010; Calza and Sousa, 2003; Fr¨ommel and Schmidt, 2006; Sorensen et al., 2009). By contrast, other studies use microeconomic data on applications (Jim´enez et al., 2010; Holton et al., 2009b) or production orders to account for demand factors.
Alternative ways of measuring the heterogeneous reactions of firms to changes in aggre-gate demand are presented in Tong and Wei (2009a,b) and Claessens et al. (2012). These authors suggest several indexes for measuring the demand sensitivity of non-financial firms. One of them is based on the reactions of firms to the 9/11 terrorist attacks (which is pre-sumed to be a demand shock), while another is an estimated index of the elasticity of the net sales of the firm to changes in GDP during the years before the crisis.
Chapter 2 evaluates how the shock on demand expectations and the credit crunch influ-enced the non-financial firms’ performance. The cross-sectional changes in the stock prices of U.S. non-financial firms are investigated over nine large and small periods between July 31, 2007 and March 31, 2010. This chapter uses a methodology similar to that proposed by Tong and Wei (2009a,b), which is based on the CAPM cross-sectional model of stock returns with a standard set of control variables.
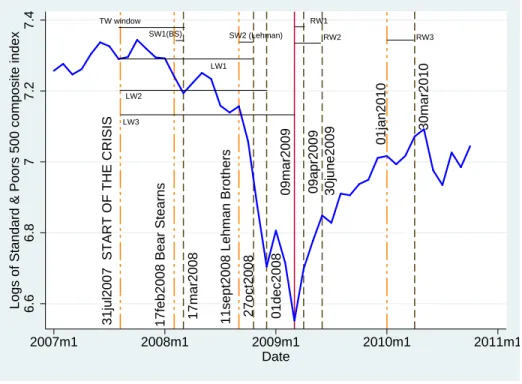
Figure 1.2.1 plots the S&P 500 composite index displayed on a logarithmic scale, the slope of the curve measuring the monthly rate of growth during the period from January 1, 2007 to October 1, 2010. The index points out several periods when stock market lost much of its value: on March 17, 2008, on October 27, 2008, on December 01, 2008, and reached its lowest point on March 09, 2009. Based on that, four large and two short periods of slowdown as well as three short periods of recovery were identified for the analysis (recovery starts from March 09, 2009, after the aggregate index reached its bottom).
One of the contributions of this chapter is the inclusion of extended up to March of 2010 time periods and shorter windows of 1-2 months around the particular negative events (the
1.2. Chapter 2. Distinguishing between the effects of demand and financial shocks 7
Figure 1.2.1: S&P 500 composite index displayed on a logarithmic scale from January 1, 2007 to October 1, 2010
31jul2007 START OF THE CRISIS 17feb2008 Bear Stearns 17mar2008 11sept2008 Lehman Brothers 27oct2008 01dec2008 09mar2009 09apr2009 RW1 SW1(BS) SW2 (Lehman) LW1 LW2 LW3 30june2009 01jan2010 30mar2010 RW2 RW3 6.6 6.8 7 7.2 7.4
Logs of Standard & Poors 500 composite index
2007m1 2008m1 2009m1 2010m1 2011m1 Date
TW window
near-collapse of Bear Stearns and the bankruptcy of Lehman Brothers) as well as the periods of recovery after the deepest trough in stock market returns in March of 2009.
Empirically, the values prior to the crisis of 2007 are used to construct several indexes that captured heterogeneous reactions of non-financial firms to the collapse in product demand and to credit supply shock. Instead of focusing on the Whited and Wu financial constraint indicator, other balance sheet indicators are taken into account to identify the firm’s finan-cial constraint. Besides, as demand sensitivity index proposed by Tong and Wei (2009a and 2009b) has been criticised for its accuracy, alternative ways to compute the demand sensi-tivity are suggested. Robustness checks include clustering the error terms by sectors, outlier selection and comparing continuous versus discrete time stock market returns.
Both the credit supply shock and the contraction of product demand were shown to have negatively influenced the stock returns of U.S. firms between July 31, 2007 and March 09, 2009 (the period in which the stock returns of firms were negative). However, both factors had positive or non-significant effects during the recovery period starting from spring 2009.
1.2. Chapter 2. Distinguishing between the effects of demand and financial shocks 8
Table 1.1: Change in Stock Prices during the Subprime Crisis, U.S. non-financial firms, cross-sectional OLS estimation for small windows following the Bear Stearns near-collapse and the bankruptcy of Lehman Brothers
Type of variable Name SW1 SW1 SW2 SW2
Bear Stearns (Feb 17, 2008 -Mar 17, 2008) Bear Stearns(Feb 17, 2008 - Mar 17, 2008) Lehman Broth-ers (Sept 11, 2008 - Oct 27, 2008) Lehman Broth-ers (Sept 11, 2008 - Oct 27, 2008) Balance sheet char-s Altman’s ZZ 0.015** 0.015** 0.048*** 0.025* Z-zone (3.14) (3.10) (3.37) (2.19) Moody’s Liq 0.058*** RiskCalc (3.80) BondScore V ol -0.016*** -0.015*** -0.065*** -0.026* (-4.19) (-3.12) (-3.23) (-2.21) Demand ∆ ln(qi,′01)s -0.055*** Sensitivity (-4.30) Control ∆ ln(qi,t−1) -0.011* -0.041** variables (-2.06) (-3.24) Beta -0.178*** (-18.04) Constant -0.074*** -0.075*** -0.575*** -0.560*** (-16.84) (-16.78) (-44.81) (-54.19) R2 0.035 0.049 0.108 0.434 Obs 1031 1030 1019 1019
1.3. Capital Purchase Program (CPP) during the crisis 9
I also found that the demand sensitivity index of Tong and Wei has the greatest explicative power compared with alternative indexes. Firms that were more vulnerable to demand contraction and more financially fragile (i.e. those with smaller Z-scores or classified into a more distressed zone according to the score) before 2007 experienced a larger reduction in the values of their stocks during the crisis.
Further, the near-collapse of Bear Stearns and bankruptcy of Lehman Brothers were characterised by liquidity contractions (financially fragile firms were affected the most) as well as the overall negative tendency of the market and its high volatility (table 1.1). These results confirmed those of Calomiris et al. (2010) and Giovane et al. (2010), while they also showed that for both events the major consequence was a contraction in credit supply rather than a collapse in product demand.
1.3
Capital Purchase Program (CPP) during the crisis
1.3.1
Capital Purchase Program and its place among other
mea-sures
The bursting of the credit and asset price bubbles imposed serious costs to the govern-ments that resulted in higher fiscal deficits and public debt. It also triggered discussions regarding the regulatory responses and their efficacy in stabilising a financial system. It became clear in the wake of the financial crisis that conventional policies did not work prop-erly; besides, even the governments and the central banks of the largest countries had often had different approaches to unconventional policies supporting the functioning of financial markets and real economy.
The views on the government interventions also differ in the academic literature. Some researchers advocate interventions by the central bank that occur exclusively through open market operations as that way the market distortions are minimised (Goodfriend and King., 1999; Kaufman, 1991; Schwartz, 1992). Others, contrarily, support the idea of direct lending
1.3. Capital Purchase Program (CPP) during the crisis 10
and liquidity provisions to avoid the failure of the financial system (Goodhart, 1999; Freixas et al., 2000a,b). In this vein, Diamond and Dybvig (1983); Diamond and Rajan (2001) and Rochet and Vives (2004) all provide evidence of the importance of deposit insurance backed by the government or central bank against bank runs and contagion.
As conventional policy methods were not efficient2 and the problems of individual finan-cial institutions suggested a systemic threat for the finanfinan-cial sector, governments and central banks around the world were forced to step in and take unprecedented measures to support the industry (thus, play their role of ”lenders of last resort”, as first described by Thorn-ton (1802) and Bagehot (1873)). The interventions of the U.S. and European governments mostly involved ensuring bank funding through explicit government guarantees and reducing bank leverage through governmental purchases of distressed assets or preferred bank shares (Fender and Gyntelberg, 2008).
However, many critics appeared in the aftermath of these programs that pointed out the limited efficiency of central banks’ actions. In that vein, Adrian and Shin (2010) argue that most of the measures undertaken by the central banks during the financial crisis of 2007 were not available to non-depository institutions, which have become an important element of the financial system over the past 30 years. Besides, Buiter and Sibert (2008) argue that in case of Iceland the vulnerability of its banking system was caused by the limited capacity of the Icelandic authorities to act as a lender of last resort. Similarly, Portes (2008) argues that better crisis management by the Icelandic authorities may have avoided economic collapse.
Bank rescue packages and the conditions of participation in the recapitalisation schemes proposed by governments between 2008 and 2009 significantly differed by country. In the United States, bank recapitalisations were finally conducted between October 2008 and De-cember 2009 through the purchases of preferred equity stakes (while the initial plan was to buy banks’ ”toxic” assets) under the voluntary Capital Purchase Program (CPP hereafter; for more details, see Acharya and Sundaram, 2009; Panetta et al., 2009; King, 2009; Cooley
2
1.3. Capital Purchase Program (CPP) during the crisis 11 and Philippon, 2009; Khatiwada, 2009).
In the U.S., the number of recipients was larger than in any other country3 because of both the size of the financial sector and the relatively smooth conditions4. An argument in favour of the CPP is that it did not end up costing much to taxpayers. Specifically, it spent only 204.9 billion dollars of its 250 billion dollars budget (more than a third of the total Troubled Asset Relief Program). The largest investment was 25 billion dollars and the smallest was 301,000 dollars.
However, the allocation of CPP funds among banks remains at the centre of discussions. Bank fundamentals, their political connectedness and their contributions to systemic risk are often said to be crucial for determining bank bailouts (e.g. Bayazitova and Shivdasani, 2012; Duchin and Sosyura, 2012; Blau et al., 2013).
1.3.2
Endogeneity of the Capital Purchase Program
During the crisis the Federal Reserve and U.S. Treasury had to develop criteria for de-ciding whether to bail out a given bank or allow it to go under. The goal of the Capital Purchase Program was to provide funds to temporarily illiquid but solvent financial institu-tions. However, the discussion on the distinction between temporarily illiquid and insolvent financial institutions still continues (Goodhart, 1999; Giannini, 1999; Goodhart and Schoen-maker, 1995). The need of the financial institution in recapitalisation is, first of all, closely related to its probability of default and thus to bank fundamentals and early warning indi-cators (such as CAMEL5). Whalen (1991); Cole and Gunther (1995); Gonz´alez-Hermosillo (1999); Calomiris and Mason (2003); Coffinet et al. (2010); M¨annasoo and Mayes (2005); Arena (2008); Kato et al. (2010) all use a bank’s balance sheet characteristics and market
3
A total of 707 banks benefited from the CPP in the U.S., while in the U.K. only three financial institutions participated in the recapitalisation program.
4
For instance, the dividend to be paid on the preferred shares to the U.S. Treasury was set at 5% annually for the first five years and 9% later on, while the dividend to be paid to the U.K. Treasury was set at 12% for five years and the three-month sterling London Interbank Offered Rate (LIBOR) plus 700 basis points thereafter.
5
CAMEL stands for Capital Adequacy, Assets, Management Capability, Earnings, Liquidity and Sensi-tivity to market risk.
1.3. Capital Purchase Program (CPP) during the crisis 12
signals to predict the failure of financial institutions and conclude that bank fundamentals can predict bank failures after controlling for macroeconomic factors.
Coffinet et al. (2010) use option market indicators to predict the time-to-failure of dis-tressed financial firms and find that such indicators perform equally well for predicting financial distress compared with the other time-varying covariates typically included in bank failure models. Further, M¨annasoo and Mayes (2005) conduct a survival analysis in order to show that bank-specific indicators (such as low capitalisation and high exposure to market risk) play an important role in distress detection and warning in Eastern European transition economies.
An alternative approach to predict bank performance during the financial crisis was proposed by Fahlenbrach et al. (2011), who investigate whether banks learned from the Long-Term Capital Management (LTCM) crisis of 1998 and adopted different business models. However, they find no evidence of any such learning process; indeed, they show that those banks that performed badly during the crisis of 1998 also performed poorly during the crisis of 2007.
If banks do not learn from their past performance and they receive funds from the gov-ernment during a crisis, they tend to expect the same in the future. Hence, if banks expect to be bailed out in a crisis, they will take more risks, which means that providing liquidity to such banks contributes to the creation of moral hazard (Calomiris et al., 2004; Acharya and Yorulmazer, 2008; Diamond and Rajan, 2009; Farhi and Tirole, 2012; Gale and Vives, 2002; Stiglitz, 2012). In this vein, Dam and Koetter (2011) examine whether expectations of bailouts raise moral hazard in terms of excessive risk-taking by German banks and provide evidence of the relatively large impact of moral hazard on banks’ risk-taking compared with other bank-specific determinants.
Therefore, on the one hand, regulators were leery of entering into ”moral hazard” terri-tory; on the other hand, bank recapitalisations were obviously necessary to support solvent but illiquid banks and thus avert a catastrophic collapse of the entire financial system. The
1.3. Capital Purchase Program (CPP) during the crisis 13
Federal Reserve thus focused on minimising the propagation of the crisis. In the financial system, there was significant counterparty risk, mostly from the side of large complex finan-cial institutions, which proved to be ”too big to fail” in the context of the global finanfinan-cial crisis because of their size, complexity and interconnectedness. In this regard, Bayazitova and Shivdasani (2012) suggest that capital injections under the CPP were provided to banks that displayed higher systemic risk and faced higher financial distress costs, but also had strong asset quality.
Value-at-risk, one of the most popular systemic risk indicators, focuses on the risk of an individual institution in isolation. However, the systemic risk of the institution in isolation is not as important as the contribution of the institution to systemic risk. Although various indicators have been proposed in this regard (Merton and Perold, 1993; Matten, 1996; Urban et al., 1993; Acharya et al., 2010; Adrian and Brunnermeier, 2011), Idier et al. (2012) find no evidence that their ex-ante marginal expected shortfall indicator helps predict equity losses better than do balance sheet fundamentals (such as the capital ratio).
Furthermore, Faccio et al. (2006); Duchin et al. (2010) and Blau et al. (2013) all advocate that politically connected firms are more likely to benefit from government bailouts. Indeed, Blau et al. (2013) suggest that politically connected firms are more likely not only to be bailed out but also to receive a greater amount and at shorter notice than politically inactive banks. While the determinants of bank performance, failures and subsequent bailouts are exam-ined in the literature, the bailout repayments often remain unnoticed. However, the fact of bailout repayment and the time that the bank took to reimburse the amount received earlier contain important information regarding bank’s health, its capacity to restore its activities and the realised losses for taxpayers.
1.3. Capital Purchase Program (CPP) during the crisis 14
1.3.3
Chapter 3. Determinants of the allocation of funds and their
repayments under the CPP
The third chapter of this thesis focuses on the determinants (such as balance sheet char-acteristics, systemic risk indicators and others described above) of the liquidity provisions and their repayments under the CPP. The allocation of CPP funds is investigated and eval-uated by analysing bailout repayments over the four years following the disbursement of CPP funds (2009–2012). In this regard, it is an important source of information on the realised risks of funding allocations. Methodologically, Ordinary Least Squares (OLS), logit, polytomous and duration models are applied to analyse capital injections under the CPP and their reimbursement.
OLS regression is focused on explaining the relative size of the disbursed under the CPP amount; logit regression estimates the probability of the binary outcome (bailout or no bailout); duration analysis examines the time until CPP funds repayment; polytomous regression predicts four possible outcomes: no bailout y = 0, bailout and total repayment y = 1, bailout and partial repayment y = 2, bailout and no repayment y = 3 (figure 1.3.1).
Not all banks were automatically eligible for the CPP. First, a bank had to request participation in the CPP by applying to the appropriate Federal banking agency (FBA). Second, the Treasury had to approve the bank’s application. Then, the bank had 30 days from the date of that notification to accept the Treasury’s terms and conditions and to submit investment agreements and related documentation. This being the case, if a particular bank was not bailed out, two distinct scenarios were possible to explain why (see figure 1.3.1).
First, that bank either did not apply for CPP funds in the first place or did not accept the Treasury’s conditions after receiving preliminary approval, perhaps because of the availability of cheaper alternative financing or the absence of the need to recapitalise. Second, such a bank could have been refused CPP funds by the Treasury for two main reasons: (i) it was considered to be insolvent or (ii) its financial situation was deemed superior to those of other applicants (given that the amount to be disbursed under the CPP was limited). Of these,
1.3. Capital Purchase Program (CPP) during the crisis 15 Figure 1.3.1: Bailout and repayment decision
BANKS RESCUED NON-RESCUED NO REPAYMENT PARTIAL REPAYMENT TOTAL REPAYMENT Bank’s decision: no application or rejection of the Treasury’s conditions
Treasury’s decision:
rejection of the bank’s application
the first reason seems to be more realistic, as not all CPP funds were disbursed and most banks were suffering from liquidity shortages equally.
The summary of results for polytomous and time-to-repayment regressions are presented in table 1.2 (summarised results from sections 3.4.2 and 3.4.3). The plus sign means a positive influence of the underlined variable on the probability of the outcome y = i in polytomous regressions and an increase in logged survival time (or expected duration until the repayment) in time-to-repayment analysis; the minus sign should be interpreted, vice versa, as a negative impact. The empirical evidence from OLS, logit and polytomous logit suggests that the CPP was designed to provide liquidity to systemically critical and ”too big to fail” commercial banks. Higher systemic risk indicators such as Marginal Expected Shortfall (MES), size and beta and smaller Z-score (meaning more financially stable bank) are associated with a greater probability of bailout and subsequent total repayment (i.e. lower probability of other outcomes as reported in table 1.2). At the same time, these
1.4. Capital Purchase Program and its impact on banks and loan supply 16
banks tended to exhibit a higher probability of repurchasing their shares from the Treasury than other banks. Thus, saving these banks helped avoid large external costs for the other sectors of the economy in the event of a total collapse of the banking sector, while taxpayers’ money was returned in relatively short order. Nevertheless, smaller banks that were heavily into mortgage-backed securities, mortgages, and non-performing loans were less likely to be bailed out and, if they did receive CPP help, took longer to repurchase their shares from the Treasury.
There are several interpretations of these results, depending on whether a bank decided not to apply for CPP funds or the Treasury rejected the bank’s application. The bank may have decided not to apply for CPP funds if the mortgages and MBSs on its books were of primary loan type. This means that banks preferred to leave high-quality loans on their balance sheets and to securitise and sell off less safe ones (including subprime loans) to other entities via off-balance-sheet vehicles. However, if the Treasury decided not to bail out a commercial bank, it may have been due to its specialising in mortgage lending and MBSs rather than commercial lending (probably because they were considered insolvent owing to their predatory lending before the crisis). This allocation of CPP funds was cost-effective from the point of view of taxpayers. Larger firms with smaller shares of mortgages and non-performing loans, higher shares of commercial loans and greater contributions to systemic risk were more likely to be bailed out but also to reimburse CPP funds in full at short notice.
1.4
Capital Purchase Program and its impact on banks
and loan supply
1.4.1
CPP funds disbursement and bank’s value
The following question is the one regarding the efficacy of public capital injections for banks’ performance and loan supply during the crisis. While the bank lending channel
sug-1.4. Capital Purchase Program and its impact on banks and loan supply 17
Table 1.2: The influence of the main factors determining the CPP funds disbursement and repayment, U.S. commercial banks, from polytomous logistic regression and survival analysis. Base outcome for polytomous regression: bailout and total repayment
Polytomous regression Survival
analysis
Variable Name No bailout Bailout
and partial repayment Bailout and no repayment Time-to-repayment (AFT) Balance sheet charac-s Altman’s Z-score Z + −
Cash flow per share P2 + +
Mortgage loans normalised by total loans AC1 + + + Commercial and industrial loans normalised by total loans AC2 − − − Treasury securuties normalised by total assets Liq1 + MBS normalised by total assets Liq2 + Non-performing loans normalised by total loans AQ + + + + Systemic risk variables
Beta Betai,2007 − − −
Size Sizei,2007 − − −
MES M ESi,2000−2007 − − −
Pseudo R2
0.156 0.168 0.153
1.4. Capital Purchase Program and its impact on banks and loan supply 18
gests that additional capital leading to the rise in bank’s capital ratio is expected to support bank’s lending during the crisis, it is unclear what effects rescue packages have had on bank’s performance and valuation during the 2007 financial crisis. The effects of announcements regarding comprehensive rescue packages distribution among the U.S. commercial banks on bank risk and valuation were studied by King (2009). The author interprets the reactions of bank stock prices to government interventions as an impact on shareholders, while the movement of credit default swap (CDS) spreads as an impact on creditors. He finds that government support was more beneficial for creditors than it was for shareholders given that the average bank CDS spreads for each country narrowed around the announcement dates in all countries. Further, the stock prices of banks that received a direct liquidity injection underperformed relative to banks that did not receive government capital.
Ng et al. (2010) also examine the impact of CPP funds disbursement on the market value of participating bank holding companies. They find that banks that participated in the CPP experienced significantly lower stock returns during the CPP initiation period relative to non-participating banks, whereas market value adjusted upwards after the program’s initiation. They also report that rescued banks had stronger fundamentals compared with non-rescued banks both before and during the initiation period. Moreover, Veronesi and Zingales (2010) estimate that while the distribution of CPP funds reduced enterprise value by 2.5% (possibly owing to the inefficient restrictions imposed by the government), it also significantly reduced the probability of bank default, which could diminish bank value by 22%.
1.4.2
Loan supply during the crisis period
Another part of the literature focuses on the analysis of the credit supply during the crisis and the efficacy of subsequent regulatory responses for restoring credit offers to enterprises and individuals. Ivashina and Scharfstein (2010) and Puri et al. (2011) show that the U.S. financial crisis induced a contraction in the supply of corporate and retail lending. Popov and Udell (2010) confirm that financial distress in Western European and U.S. parent banks
1.4. Capital Purchase Program and its impact on banks and loan supply 19
significantly affected business lending to Central and Eastern European firms. They associate this reduction in credit offers with low equity ratios, low Tier-1 capital ratios and losses in financial markets.
Ciccarelli et al. (2010) show that during the crisis of 2007 liquidity shocks had a large negative impact on GDP through a reduction in credit supply to firms in the Euro area and tighter lending standards for mortgage loans in the U.S. Ramcharan et al. (2013) report that the collapse of the asset-backed securities market during the crisis caused a large contraction in credit supply by credit unions, especially those with lower capital ratios. Similarly, Kapan and Minoiu (2013) analyse the syndicated loan market and show that banks that were more dependent on market funding and had lower liquidity had fewer credit offers than other banks. Adrian and Ashcraft (2012) also confirm that bank lending tends to decline during a crisis, whereas bond financing increases.
The severe consequences of the financial crisis of 2007 have also raised questions about the necessity of tighter bank capital and liquidity regulations as well as the effect of the bank capital channel on credit supply. When capital requirements increase, banks are forced to delever their balance sheets. For instance, Barrell et al. (2009) and Kato et al. (2010) find that raising capital and liquidity standards would reduce the likelihood of a financial crisis occurring. Francis and Osborne (2009) also use a capital adjustment model to conclude that while tighter financial regulations might contribute to financial stability, these could also have a negative effect on loan supply because of the adjustment to the target capital ratio by banks. Berrospide and Edge (2010), on the contrary, find no significant impact of bank capital on lending for two possible reasons: (i) the reduction in loan demand and increased bank risk played a more important role in slowing the loan growth than bank capital; or (ii) conventional capital ratios cannot properly assess the capital positions of banks.
1.4. Capital Purchase Program and its impact on banks and loan supply 20
1.4.3
Chapter 4. Resuming bank lending in the aftermath of the
Capital Purchase Program
Brei et al. (2011) analyse whether the rescue measures adopted during the crisis helped sustain bank lending. They confirm that banks that have higher levels of capitalisation provide more credit during normal times, while this is only the case during a crisis once the level of capitalisation exceeds a certain threshold. Moreover, Brei and Gadanecz (2012) find no evidence that bailouts contributed to a reduction in risk lending and report that the syndicated loans provided by banks that were later bailed out were riskier than those provided by institutions that were not bailed out.
In its attempt to distinguish between the relative impacts of liquidity shortage and the contraction in aggregate demand on credit growth rates, Chapter 4 of this thesis is close to Chapter 2. This chapter uses the methodology of Brei et al. (2011) in order to estimate the impact of bank capital, other balance sheet characteristics and sensitivity to demand shocks on bank lending. This framework allows us to introduce structural changes in parameter estimates for the period of the crisis as well as for normal times for bailed-out and non-bailed banks.
Chapter 4 contributes to the literature on the efficacy of public capital injections during the crisis. It provides a framework in which the sensitivity of the bank’s credit offer to finan-cial distortions and its sensitivity to decline in aggregate demand are separated from each other6. The relationship between bank balance sheet characteristics, sensitivity to demand shock and bank credit growth is analysed for banks that received CPP funds and those that did not both in normal times and during the crisis. Moreover, the same relationship is then investigated for the subsample of financial firms that received CPP funds in order to distinguish between banks that repurchased their stakes from the U.S. Treasury by July 2012 and those that did not. While Brei et al. (2011) only use system GMM approach,
6
In most of empirical studies, demand factor is proxied by changes in the GDP of the country. It means that they do not take into account heterogeneous reactions of the financial institutions to the changes in aggregate demand (see Berrospide and Edge, 2010 and Brei et al., 2011).
1.4. Capital Purchase Program and its impact on banks and loan supply 21
that chapter examines the impact of CPP funds distribution on loan supply using Mundlak (1978), Hausman and Taylor (1981), Instrumental Variables, Arellano and Bond (1991) and system GMM estimators in order to account for various types of endogeneity bias (presented later in section 4.2.2).
Figure 1.4.1 plots median total loan growth rates over time for the banks (i) that did not receive CPP funds; (ii) that received CPP funds and repaid them totally by July 2012; (iii) that received CPP funds but did not repay anything by July 2012. It shows that bailed-out banks that did not redeem their stocks from the Treasury on average supplied more loans than other banks in the period between 2001 and 2008. Banks that did not receive CPP funds on average exhibited the lowest total loans growth rates in the period before 2008. However, the situation changed after 2008. Banks that did not repurchase their shares from the Treasury exhibited the lowest growth rates of loans, while the latter ones started to rise at the banks that did not receive CPP funds and those that repaid their CPP funds.
Figure 1.4.1: Median annual total loans growth rates
−10
0
10
20
Median of annual total loans growth rate
1995 2000 2005 2007 2009 2010
Year
Banks non−recipients of CPP funds
Banks−recipients of CPP funds that redeemed their stock from the Treasury by July, 2012 Banks−recipients of CPP funds that did not redeem their stock from the Treasury by July, 2012 GDP growth rate
Table 1.3 suggests the same evidence. Mean growth rates are reported in table 1.3 for the banks according to their participation (bailout/no bailout) in and their exit (repayment/no
1.4. Capital Purchase Program and its impact on banks and loan supply 22
repayment) from the CPP. Median and standard deviation are reported in brackets, respec-tively. The table reports similar mean (median) growth rates of total loans for non-bailed banks and banks that repaid CPP funds (2.94% (1.96%) and 3.63% (2.11%), respectively) during the crisis period. However, the growth rate of loans at the banks that did not repay CPP funds is negative: the annual mean growth rate is -0.76%, while the median is -2.43%. The empirical evidence on the effects of capital shortage these observations (for the summary results see Chapter 4, section 4.4.7, tables 4.22, 4.23 and 4.24). First of all, the results from different estimators suggest that bailed-out banks exhibited higher growth rates of all types of loans than non-bailed banks both in normal times and during the crisis. Moreover, with a one percentage point increase in the capital ratio, bailed-out banks displayed higher growth rates of loans during the crisis than in normal times as well as higher growth rates than those of non-bailed banks during the crisis. This result is in line with that of Francis and Osborne (2009), who use data on U.K. banks and report that better capitalised banks are more willing to supply loans. The same finding is confirmed by Foglia et al. (2010), who also find that this effect intensified during the crisis.
Besides, bailed-out banks that repurchased their shares from the U.S. Treasury provided more loans during the crisis than the banks that did not do it. These results provide the evidence, that (i) in general, CPP program was efficient in terms of supporting loan growth during the crisis; (ii) the banks that did not repay CPP funds had experienced severe fi-nancial problems and did not translate additional capital into new loans to enterprises and individuals.
It also seems that banks that specialised in commercial and industrial lending and that displayed a higher probability of receiving CPP funds (see Chapter 3 for details) also con-tributed to a larger extent to the growth rates of loans (mostly commercial and industrial loans, as they specialised in that type of lending).
Hence, banks that had a higher level of capitalisation tended to lend more both during the crisis and in normal times. In tough times, additional capital was not that easily translated
1.4. Capital Purchase Program and its impact on banks and loan supply 23
Table 1.3: Summary statistics on growth rates of loans
Bank 1995-2011 No Crisis Crisis
1995-2007 2008-2011 Growth rates of TL All banks 10.81 (8.46;16.18) 13.75 (10.54;15.96) 2.49 (1.41;13.72) Obs 8061 5958 2103 Bailed-out banks 11.38 (9.14;16.23) 14.81 (11.51;15.73) 2.00 (0.84;13.71) Obs 3726 2727 999 Non-bailed banks 10.33 (7.87;16.12) 12.85 (9.69;16.11) 2.94 (1.96;13.73) Obs 4335 3231 1104
Bailed-out banks that REPAID CPP funds
11.70 (9.14;15.51) 14.63 (11.34;15.13) 3.63 (2.11;13.60)
Obs 2360 1732 628
Bailed-out banks that DID NOT RE-PAY CPP funds
10.81 (9.17;17.40) 15.13 (11.81;16.72) -0.76 (-2.43;13.47)
Obs 1366 995 371
Growth rate of REML
All banks 12.08 (8.49;24.45) 15.08 (10.94;24.75) 3.67 (1.74;21.48)
Obs 7935 5849 2086
Bailed out banks 12.37 (8.77;24.49) 15.76 (11.35;24.50) 3.17 (0.53;21.97)
Obs 3686 2693 993
Non-bailed banks 11.84 (8.26;24.42) 14.51 (10.44;24.94) 4.13 (2.36;21.02)
Obs 4249 3156 1093
Bailed-out banks that REPAID CPP funds
12.47 (8.99;24.06) 15.29 (11.26;24.25) 4.76 (2.46;21.75)
Obs 2343 1717 626
Bailed-out banks that DID NOT RE-PAY CPP funds
12.18 (8.38;25.23) 16.58 (11.58;24.93) 0.47 (-2.35;22.11)
Obs 1343 976 367
Growth rate of CIL
All banks 11.79 (9.35;30.24) 15.59 (12.30;30.10) 1.40 (0.73;28.77)
Obs 7487 5482 2005
Bailed out banks 11.66 (9.81;27.49) 16.45 (13.20;27.56) -0.93 (0.09;24.25)
Obs 3554 2575 979
Non-bailed banks 11.90 (8.93;32.58) 14.82 (11.06;32.22) 3.62 (1.41;32.54)
Obs 3933 2907 1026
Bailed-out banks that REPAID CPP funds
12.15 (9.71;25.24) 16.17 (12.77;25.79) 1.29 (1.18;21.26)
Obs 2287 1669 618
Bailed-out banks that DID NOT RE-PAY CPP funds
10.78 (9.93;31.23) 16.96 (14.29;30.64) -4.71 (-4.07;28.58)
Obs 1267 906 361
Average annual growth rates (means) are presented in table; median and standard deviation are reported in brackets. REML stands for Real Estate Mortgage Loans; CIL stands for Commercial and Industrial Loans.


![[PDF] Langage Python cours de base avec exemples | Formation informatique](data:image/gif;base64,R0lGODlhAQABAIAAAP///wAAACH5BAEAAAAALAAAAAABAAEAAAICRAEAOw==)