A Component-Based Approach for Specifying DSML's Concrete Syntax
Texte intégral
Figure
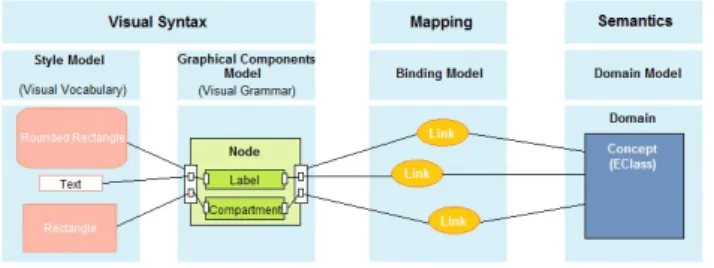
![Figure 1: The nature of a visual notation [15]](https://thumb-eu.123doks.com/thumbv2/123doknet/12861448.368591/3.892.478.834.147.264/figure-nature-visual-notation.webp)
Documents relatifs
The client part is simply a set of web forms, which allows the user to perform the following actions: load models in BPMN 2.0 XML format, visualize BPMN models (by means of
This paper presents a formalization of i* mapping rules for class diagram in the context of Model-Driven Development (MDD), aiming to create more complete class
1.1.1 Example 1: square with a circular hole and strong Dirichlet boundary conditions In this example, we consider a generic component in the form of a square [−1, 1] × [−1, 1] where
Users can explicit their requirements using services provided by the available devices by either selecting a particular service or defining a complex scenario.. To do
The lower levels of SF interleukin (IL)-10 in reactive arthritis (ReA) patients compared with rheumatoid arthritis (RA) patients have also been reported by other
After analyzing the main features of the activity meta-model elements' representation and possibilities in different modeling languages and notation, moving in detailed analysis
Préparer le rapport annuel et le budget de la Di- vision de la lutte contre l'incendie devant être soumis à la Division de l'administration et des
