HAL Id: cea-02509264
https://hal-cea.archives-ouvertes.fr/cea-02509264
Submitted on 16 Mar 2020
HAL is a multi-disciplinary open access archive for the deposit and dissemination of sci-entific research documents, whether they are pub-lished or not. The documents may come from teaching and research institutions in France or abroad, or from public or private research centers.
L’archive ouverte pluridisciplinaire HAL, est destinée au dépôt et à la diffusion de documents scientifiques de niveau recherche, publiés ou non, émanant des établissements d’enseignement et de recherche français ou étrangers, des laboratoires publics ou privés.
On the relationship between the formation factor and
diffusion coefficients of Portland cement mortars
Z. Bajja, W. Dridi, B. Larbi, P. Le Bescop
To cite this version:
Z. Bajja, W. Dridi, B. Larbi, P. Le Bescop. On the relationship between the formation factor and diffusion coefficients of Portland cement mortars. ICCRRR - 4th International Conference on Concrete Repair, Rehabilitation and Retrofitting, Oct 2015, Leipzig, Germany. �cea-02509264�
1 INTRODUCTION
Despite the significant efforts deployed to improve the design, production and placement of concrete mixtures, the premature decay of infrastructures re-mains one of the main challenges facing the construc-tion industry at the beginning of this 21st century [1]. Therefore, the durability of cement-based materials continues to receive significant international attention from both scientists and engineers.
Since these materials are porous, their durability is basically determined by their ability to resist the pen-etration and the transport of aggressive agents. The diffusion coefficients of ions and radionuclides in cementitious materials are the most important param-eters to evaluate the state of degradation of struc-tures.
In the framework of the storage of nuclear waste, (HTO) the liquid form of tritium, is considered as an ideal tracer for the characterization of the effective diffusivity in cementitious materials, because of its negligible interaction with the cement matrix [2] and the facility to apply Fick’s law to a molecule such the HTO. However, the radioactive nature of HTO en-courages looking for nonradioactive elements (gener-ally ions) that can provide its diffusion coefficient without having to carry out tritiated water diffusion tests very expensive and dangerous.
Only diffusion in saturated porous materials is concerned in this study. Electro-diffusion and unsatu-rated conditions are ignored hereafter. Thus, the aim of this study is to prove the validity of the formation factor equation (Eq. 1) relating the effective diffusivi-ty (Deion, Derad) in the cementitious material
respec-tively of an ion and a radionuclide to their diffusion coefficient (D0ion; D0rad) in an infinitely diluted
solu-tion, usually in pure water at 25 ° C.
ion e ion rad e rad
D
D
D
D
F
0
0 (Eq. 1)For that purpose, several formulations of mortars were tested in through-out diffusion with HTO and with lithium ion which has allowed identifying their diffusion coefficients.
2 EXPERIMENTAL PROCEDURES 2.1 Test program
Six different mixtures were prepared, to achieve the goal fixed previously. Mortars were manufac-tured from mixing Portland cement (European grade CEM I 52, 5 N CE PM-ESCP2 NF), with standard-ized siliceous sand CEN IN 196-1 labeled SN, and with water and the super plasticizer Glenium27 for some formulations.
On the relationship between the formation factor and diffusion
coefficients of Portland cement mortars
Z. Bajja
a, W. Dridi
a, B. Larbi
a, P. Le Bescop
aa CEA, DEN, DPC, SECR, Laboratoire d’Etude du Comportement des Bétons et des Argiles, F-91191
Gif-sur-Yvette, France
ABSTRACT: Concrete durability continues to be a subject of considerable interest, especially with the use of cement based materials on structures increasingly demanding on term of sustainability and resistance to ag-gressive ions penetration or radionuclide release. Diffusion is considered one of the main transport phenome-na that cause migration of aggressive solutes and radionuclide in a porous media according to most studies.
In this work, two different tracers (an ion, and a radionuclide) were tested on the same formulations of mor-tars (w / c = 0, 4 and sand volume fractions from 0 to 60%) by the through-out diffusion, in order to determine the effective diffusion coefficients of each tracer and each formulation. The obtained results have proven the validity of the formation factor equation relating the effective diffusivity of a tracer to its diffusion coefficient in pure water.
These formulations were made by fixing water-to-cement ratio (w/c) and by varying the relative aggre-gate volume content (Cag) in the objective to have
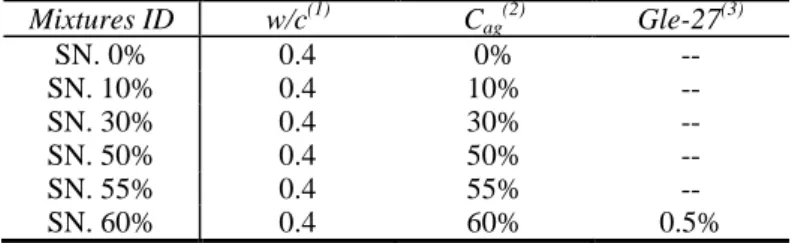
different geometrical formation factors for each spec-imen. . (Table 1) gives the proportions of the tested materials.
Table 1: Proportions of materials tested
Mixtures ID w/c(1) Cag(2) Gle-27(3) SN. 0% 0.4 0% -- SN. 10% 0.4 10% -- SN. 30% 0.4 30% -- SN. 50% 0.4 50% -- SN. 55% 0.4 55% -- SN. 60% 0.4 60% 0.5%
(1) w/c is the water-to-cement ratio. (2)
Cag is the relative aggregate volume content
(3) Gle-27(%) is the weight of Glenium 27 relative to weight of
cement
Mortar specimens were mixed according to the standard mortar fabrication procedure NF EN 196-1 and were cast in PVC cylinders 70 mm in diameter and 110 mm high.
After 24h, specimens were demoulded and con-served in lime water. They were cured in a humid chamber at T = 20 ± 1 ° C for a period exceeding three months, to ensure complete hydration of the material and to have a ‘‘fixed’’ microstructure during all the experiments.
Samples used for diffusion tests are 6mm thick discs, obtained by underwater cutting of the central portion of each specimen. The thickness chosen for discs of 6mm is justified for two reasons: First, a rea-son of representativeness, because to have reliable re-sults, the sample must at least have a thickness three times larger than the maximum grain diameter (1,8mm for SN). Also, a thick sample will take more time to be tested by the through-out diffusion than a fine sample. That’s why, the thickness of 6mm was chosen since it represents a compromise between the rapidity and the representativeness of the test.
2.2 Microstructure analysis:
The microstructure of the studied materials was investigated by free water porosity and Mercury In-trusion Porosimetry (MIP) measurements.
2.2.1 Free water porosity measurements:
Water porosity measurement is considered as a pa-rameter of first order in the evaluation of the durabil-ity of material [3]. The experimental method [4] con-sists in determining water porosity by weighing the three following parameters: The sample water
satu-rated mass Ms, the sample dried mass MD, and Mw
the sample mass when immersed in water.
Dried mass was obtained after an oven drying at the temperature of 60°C until constant weight. From these data, porosity accessible to water can be calcu-lated as follows: w s D s
M
M
M
M
(Eq. 2)2.2.2 Mercury intrusion porosimetry:
Before testing, the samples were first frozen (-195°C) by immersion into liquid nitrogen for 5 min. This quick quenching process at very low tempera-ture allows generation of ice microcrystals that do not alter the microstructure.
After freezing, samples were introduced for 7 days in a freeze-dryer in which vacuum were kept to 10-1 Pa. This operation allows the ice trapped in the mate-rial porosity to sublimate. This freeze-drying tech-nique is commonly used in many industrial areas like soil engineering, food industry, and biology. This technique is considered as a suitable procedure for MIP investigation on cement-based materials [5, 6]. MIP measurements have been carried out using mi-cromeritics porosimeter with a maximum 413MPa injection pressure. The contact angle was 130° for all samples. The minimum pore access diameter reached is about 3nm. For each specimen, two samples were tested and the results averaged.
2.3 Through-out diffusion tests
There are many methods of measurement of the coefficients of diffusion. Most known are natural dif-fusion tests, electrically accelerated tests or test of immersion in a concentrated solution. The choice of the method of measurement depends on the nature of the diffusing element but also on requirements of time. For this study the choice of the diffusing ele-ment will be on one hand a radioactive isotope (HTO) and on the other hand a solution containing lithium ions Li+ ( lithium chloride solution LiCl) .
The through-out diffusion tests consist on putting the mortar sample between two compartments. The samples were sealed into position using an epoxy ad-hesive "Araldite" and by means of O-rings to avoid leakage.
Each compartment of 111 ± 1 ml volume is filled with saturated lime water. Then the cell is left to stand for about fifteen days to check the tightness of the cell and stabilize the sample before the test. After
this period, the upstream compartment of each cell was doped with one of two species (HTO or Li+).
The amount of elements transferred from the up-stream to the downup-stream compartment was then fol-lowed in time by successive samplings which were analyzed by ionic chromatography device (for moni-toring Li+ ions) and by a scintillation tritium monitor for the monitoring of HTO. The lower limit of detec-tion for the ionic chromatography is 0.18µmol/l.
During the test, the concentration at the down-stream compartment was checked not to reach 3% of the upstream concentration; otherwise, the down-stream solution is drained. Therefore the updown-stream concentration C0 and downstream one C1 were
main-tained constant for all time (C0 = 3.2 106 Bq/L; C1≈0)
for HTO and (C0=41 mmol/l; C1≈0) for lithium
solu-tion (LiCl).
3 RESULTS
3.1 Water porosity and mercury intrusion
porosimetry:
By increasing the sand content in mortars, the water porosity decreases (Figure 1a).Water porosities are then compared to (1-Cag) linear plot called the law of
perfect dilution and which reflects the linear decrease of mortars porosity made with non-porous aggre-gates. It can be seen that experimental results are close to (1-Cag) plot and don’t breached the line
ex-cept for the SN.60% mortar where water porosity value is slightly above dilution line.
This was confirmed by measurements of bulk den-sities by water porosimetry (Figure 1b). The evolu-tion according to the sand content curve presents a fall of the density at the SN.60%.
Figure 1a: Results of free water porosity measurements for test-ed mortars
Figure 1b: Results of bulk density measurements for tested mor-tars
The slight increase of porosity and the decrease of bulk density in 60% sand volume fraction are corre-lated with an increase in air voids content within the material. Voids which can be interpreted by the pres-ence of air bubbles. This anomaly of the SN.60% was also observed by mercury porosimetry. Figure 2 pre-sents the pore size distribution of the tested formula-tions.
Figure 2: Pore size distribution of tested mortars
The curve representing the cement paste (SN.0%) shows that the diameter of the largest pores appears around 0,05μm, a threshold diameter from which percolation of capillary pores is observed. In contrast, the curves corresponding to the other formulations show that the pore distribution is characterized in particular by the appearance of larger diameters than those observed for cement paste. The addition of ag-gregates therefore increases the amount of larger pores (≥0,01μm), even for mortars with only 10% of sand. This change in microstructure may be due to the formation of Interface Transition Zone aggregates
/ paste (ITZ) characterized by a higher porosity and its percolation [7, 8 , 9]. However, this explanation is not sufficient to justify the microstructural behavior of (SN.60%) mortar.
3.2 Diffusion tests
3.2.1 Lithium diffusivity in mortars
(Figure 3) shows the profile of effective diffusion coefficients of lithium ion vs. the sand volume frac-tion present in the formulafrac-tions.
It is noticed, that with low content of sand in particular between 0 and 50%, the diffusivity of lithium decreases with sand content in a perfect dilution law :
)
1
(
ag paste e mortar eD
C
D
(Eq. 3)With Demortar is the diffusion coefficient of the
mortar, Depaste the diffusion coefficient of the cement
paste, and Cag, the sand content in the mortar.
Mortar behavior becomes different starting from the formulation SN. 55%, where the diffusion coeffi-cient varies very little compared to the mortar within 50% sand content. However, the formulation which remains the most significant is SN.60%, because its diffusion coefficient rises considerably and largely exceeds the diffusion coefficient of the cement paste. These results observed for different formulations are in perfect agreement with the results of water po-rosity and mercury porosimetry. These phenomena were also noted in previous studies found in the liter-ature such [10] and [11].
Figure 3: Effective diffusion coefficient De vs sand content
of lithium
3.2.2 Tritiated water diffusivity in mortars
Tritium diffusion tests were carried out on the formulations SN. 0%, SN. 10%, SN. 30%, SN. 50% and SN. 60% and were repeated twice for each for-mulation. Both formulations SN. 55% and SN. 65% could not be tested by tritium diffusion.
(Figure 4) shows the effective diffusion coeffi-cient values according to aggregate fraction volume. The general tendency of the curve in figure 4 is in perfect agreement with the diffusion results of lithi-um and with water porosity and mercury porosimetry results.
Figure 4: Effective diffusion coefficient De of HTO vs sand
con-tent in mortars
3.2.3 Interpretation of diffusion results :
For materials with less than 55% sand volume, the effect of dilution is dominating for the two tests of diffusion with HTO and lithium. In these formula-tions, the ITZ layer around the aggregates exists ac-cording to the results of mercury porosimetry, but it remains isolated and does not affect diffusive charac-teristics of the materials.
This tendency has suddenly changed from 55 to 60% sand volume fraction, where a significant in-crease in the diffusion coefficient is observed. More-over, il was noticed an increase in the mercury pene-trated volume (at 0.6 µm diameter in Figure 2) revealing of the interconnection of this class of pores (0.1 to 1µm). This interconnection created can there-fore cause the formation of a percolation path within the sample which may justify this very significant in-crease in diffusivity. In this case, several hypotheses can be suggested to try to explain the cause of this in-terconnection. Among these, the interconnection of ITZ and / or the heterogeneity of the material. This
last proposition means that because of the small pro-portion of cement present in the SN. 60%, it is possi-ble to find some areas poor in cement but rich in wa-ter, others containing sufficient binder, and another part that may contain anhydrous in majority.
These various material microstructures can finally lead us to believe that a competitive aspect exist in mortars: on one side, the presence of nonporous sand grains tend to decrease the diffusivity but on the oth-er the presence and the intoth-erconnectivity of ITZ are respectively at the origin of the appearance of larger pores and probably the cause of the increase of the diffusion coefficient (in the SN. 60%).
4 DISCUSSION ON THE VALIDITY OF THE FORMATION FACTOR CONCEPT
The objective of this paragraph is to compare the formation factors obtained experimentally from the results of lithium and tritium diffusion tests.
(Table 3) shows experimental values of effective diffusion coefficients of each tracer within the tested formulations. Therefore, knowing the diffusion coef-ficients of the element “i”
iD0 , it is possible to calcu-late the formation factor for each formulation using the relation:
(Eq.4)
It is noted that the values of D0HTO et D0Li
meas-ured in an infinitely diluted solutions are respectively 2.27×10⁻⁹ (m2/s) and 1.03×10⁻⁹ (m2/s) [12].
Table 3: Experimental diffusion coefficients and resulting for-mation factors
Mixtures ID DeHTO(m2/s) DeLi(m2/s) FHTO FLi
SN. 0% 2.56.10-12 1.15.10-12 886.72 896.43 SN. 10% 2.40.10-12 1.01.10-12 945.83 1019.80 SN. 30% 1.96.10-12 8.55.10-13 1158.16 1204.67 SN. 50% 1.45.10-12 5.69.10-13 1565.52 1810.19 SN. 55% --- 5.90.10-13 --- 1745.76 SN. 60% 3.39.10-12 1.70.10-12 669 .62 605.88
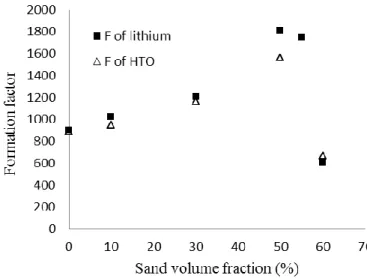
The comparison between experimental formation factors gives rather close results, (Figure 5).
Initially, formation factors (of HTO and lithium) follow the same tendency i.e. they increase with the
sand content for mortars until 55% of sand, and de-crease dramatically around 60% of sand.
Disparities between formation factor values meas-ured with the two tracers do not exceed 15 % for all tested formulations except the SN.60% mortar where a difference of about 25 % is recorded. Regarding an uncertainty of measurements around 20 % in the dif-fusion tests, the obtained results make it possible to validate the (Eq.1). They confirm the geometrical character of the formation factor which reflects the morphology and the connectivity of pore network of a given material. They also reveal the invariability of this parameter regarding the nature and the concen-tration of diffusing tracer.
Figure 5: Comparison between formation factor of lithium, and HTO obtained experimentally
Differences obtained between these factors must normally tend to zero since it is the same formula-tions which were tested by the two tracers. Because of some disturbances that can take place during tests, such an error exists. Among these disturbing factors, may be mentioned two possible reasons. From one perspective, it was noticed during the tests, a slight drop of temperature in the room where were placed the cells, this fall of temperature can cause a decrease in effective diffusion coefficients and thus increase the formation factor F. From another perspective, the increase in the formation factor may be due to the presence of chlorides ions in the upstream solution (solution of LiCl). These ions diffusing into mortars can involve some possible modifications in the mi-crostructure of materials, in particular in the porosity of the hydrates. Otherwise, since hydrates porosity in CEM I based materials represents a smaller fraction of total porosity (compared to a CEM V material for example), the effect produced by chloride ions on the
i e i i
D
D
F
0geometry of pores cannot be more important. In addi-tion the concentraaddi-tion of chlorides ions used is quite weak, and the duration of which analyses were stopped (113 days) remain insufficient to cause mod-ifications in the microstructure of the samples. This effect was noticed by [13] mainly for concretes con-taining CEMV, where the variation of formation fac-tors is more considerable.
Finally, the omission of electrical interaction be-tween diffusing species (ions) can also explain the disparities between formation factors obtained from HTO and ionic species diffusion tests.
5 CONCLUSION
With the assessment of this paper, several conclu-sions could be found. First, it was shown that the Eq. 1 - giving the expression of diffusion coefficients of any ionic or radioactive specie from the geometrical formation factor of a material - can be validated for at least the two species tested which are lithium ion and tritiated water. This validity is conditioned by the re-spect of tests conditions i.e. a rather low upstream concentration of 41mmol/l of LiCl, a fixed tempera-ture during diffusion tests, materials formulated only with CEM I and without additions… This result is regarded as perfectly interesting, since it will allow determining orders of magnitude of the effective dif-fusion coefficients of any other diffusing specie by knowing the geometrical formation factor of a mate-rial. However, to determine the formation factor, it is preferable to use tritium as a tracer, because its low reactivity with the cementing matrix, but also be-cause it diffuses more quickly than ions (steady state starts at 10 days for HTO against 30 days for lithium ion) and thereafter, makes it possible to have the ex-act value of De for shorter tests durations compared to ions.
6 REFERENCES
[1] J.F. Young, Bridging concrete into the 21st century Proceed-ings of the ECI Conference on Advances in Cement and Concrete, August 21–24, Copper Mountain, CO (2003), pp. 1–8.
[2] C. Richet, Etude de la migration des radioéléments dans les liants hydrauliques – Influence du vieillissement des liants sur les mécanismes et la cinétiques des transferts, Ph.D. Thesis; Université Paris XI Orsay (1992) (in French).
[3] V. Baroghel-Bouny & Ammouche A. (2007). Sous groupe « microstructure ». In Arliguie & Hornain (Dir), Grandubé book (pp. 63-106) (in French).
[4] Grandubé book - Grandeurs associés à la durabilité des bé-tons – French association of civil engineering (2007)
[5] C. Gallé, Effect of drying on cement-based materials pore structure as identified by mercury intrusion porosimetry, a comparative study between oven-, vacuum-, and freeze-drying, Cem. Concr. Res. 31 (2001) 1467-1477
[6] A. Kumar, D.M. Roy, The effect of desiccation on the poros-ity and pore structure of freeze-dried hardened Portland cement and slag blended pastes, Cem. Concr. Res. 16 (1) (1986) 74– 78.
[7] B. Bourdette, E. Ringot, J.P. Ollivier, Modelling of the tran-sition zone porosity, Cem. Concr. Res. 25 (1995) 741-751. [8] D.N. Winslow, M.D. Cohen, D.B. Bentz, K.A. Snyder, E.J.
Garboczi, Percolation and pore structure in mortars and concrete, Cem. Concr. Res. 24 (1994) 25-37.
[9] S. Caré, Influence of aggregates on chloride diffusion coef-ficient into mortar, Cem. Concr. Res. 33 (2003) 1021-1028.
[10] B. Bourdette, Prise en compte des aureoles de transition dans la characterisation et la modélisation des processus physique et chimiques d’altération, Ph.D. Thesis, Institut National des Sciences Appliqués de Toulouse (1994) (in French).
[11] E.J. Garboczi, D.P. Bentz, Modelling of the microstructure and transport properties of concrete, Cem. Concr. Res. 10 (1996), 293 – 300.
[12] P. Vanysek ; Ionic Conductivity and Diffusion at Infinite Dilution – CRC Hansbook of Chemestry and Physics, 2000- 203.158.253.140.
[13] H.R. Mercado Mendoza, Transferts aqueux à travers les matériaux cimentaires partiellement saturés. Ph.D. Thesis ; University of Toulouse (2012) in French.