HAL Id: tel-00858603
https://tel.archives-ouvertes.fr/tel-00858603
Submitted on 5 Sep 2013HAL is a multi-disciplinary open access
archive for the deposit and dissemination of sci-entific research documents, whether they are pub-lished or not. The documents may come from teaching and research institutions in France or abroad, or from public or private research centers.
L’archive ouverte pluridisciplinaire HAL, est destinée au dépôt et à la diffusion de documents scientifiques de niveau recherche, publiés ou non, émanant des établissements d’enseignement et de recherche français ou étrangers, des laboratoires publics ou privés.
récepteurs de chimiokines
Lina Siauciunaite-Gaubard
To cite this version:
Lina Siauciunaite-Gaubard. Exploration de nouvelles approches pour les études de RCPG au niveau moléculaire : application aux récepteurs de chimiokines. Sciences agricoles. Université de Grenoble, 2012. Français. �NNT : 2012GRENV039�. �tel-00858603�
THÈSE
Pour obtenir le grade de
DOCTEUR DE L’UNIVERSITÉ DE GRENOBLE
Spécialité : Biologie structurale et nanobiologie
Arrêté ministériel : 7 août 2006
Présentée par
Lina Šiaučiūnaitė - Gaubard
Thèse dirigée par Franck Fieschi et codirigée par Corinne Vivès
Préparée àl’Institut de Biologie Structurale Jean-Pierre Ebel
dans l'École Doctorale Chimie et Sciences du Vivant
Exploration de nouvelles
approches pour les études de
RCPG au niveau moléculaire:
application aux récepteurs de
chimiokines
Thèse soutenue publiquement le 15 Mai 2012, devant le jury composé de :
Prof. Eva PEBAY-PEYROULA
PrésidentDr. Renaud WAGNER
RapporteurDr. Jean-Louis BANÈRES
RapporteurDr. Jean-Luc POPOT
ExaminateurProf. Franck FIESCHI
Directeur de thèseAcknowledgments
I give my sincere thanks to my supervisors Dr. Corinne Vivès and Prof. Franck Fieschi who accepted me to work on this project and who gave me the possibility to acquire the PhD degree. I would like to express my gratitude to my supervisor, Dr. Corinne Vivès, who was very sup-portive through all the joys and miseries and whose expertise, understanding, and patience, contributed considerably to my experience. I appreciate her assistance in writing reports and this thesis, which significantly improved my writing skills. I am also grateful for her generous help to translate the thesis summaries to French language. Without her help probably no french would have understood what I wrote.
I would like to thank my thesis director Prof. Franck Fieschi who accepted me as a PhD student to work as a part of his team and for the assistance he provided at all levels of the research. I am grateful to the jury members Prof. Eva Pebay-Peyroula, Dr. Renaud Wagner, Dr. Jean-Louis Banères and Dr. Jean-Luc Popot who kindly agreed to evaluate my work and who gave me very helpful comments on this work.
I would like to thank to my tutor from the SBMP network, Dr. Jean-Luc Popot, for his valuable and helpful comments and discussions. I am also grateful for the possibility to visit his laboratory where I learned to work with amphipols and the cell free expression. I would like to thank Emmanuelle Billon-Denis and Francesca Zito for the supervising during my stay at IBPC in Paris.
A very special thanks goes to Dr. Antoine Picciocchi who joined the group as a post-doc and was involved in the project and whose motivation and encouragement was leading me every day. I would like to thank to Ieva Sutkeviči¯ut˙e for her valuable help with the analysis of the Biacore results. Taip pat ači¯u už palaikymą, visada buvo be galo malonu bendrauti.
Dr. Richard Kahn was the scientist who truly made a difference in my life. He provided me with direction, support and became more of a mentor and friend. I owe him my eternal gratitude. A big thanks goes to all the former and current members of the MIT: Corinne, Franck, Isabelle, Céline, Antoine, Ieva, Michel, Eric, Julien, Jérôme, Christine. I would like to thank to people from the channels group for the electrophysiology experiments: Dr. Christophe Moreau, Dr. Michel Vivaudou, Dr. Argel Estrada-Mondragón, Dr. Lydia Caro, Jean Revilloud.
Thielens for the SPR (Biacore technology) platform. For the N-terminal sequencing I would like to thank Jean-Pierre Andrieu.
I am grateful to our collaborators Dr. Bernard Mouillac, Dr. Jean-Louis Banères for the work with the GPCRs and Dr. Jean-Luc Popot who kindly provided amphipols to us. Thank you all! Without your collaborations this work would be hard to imagine.
Thanks to Dr. Federico Martin-Ruiz for the kind gift of the protease clone.
I would also like to thank to my previous colleagues from CNIO. Ya hace un tiempo, pero fue un placer a trabajar con vosotros. No toda nuestra experiencia fue divertida pero yo aprendí muchísimo. Gracias a tod@s! Fede, Miguel, Jose, Carmen, Nayra, Mer, Sandrea, Jero. . . Muchísimas gracias por vuestro apoyo! Gracias que no olvidáis y que vengáis a visitarme en Grenoble.
Taip pat ači¯u svarbiausiems - šeimai ir draugams kurie yra visada šalia. Ači¯u t˙evams už paramą, kurią jie suteik˙e man per visą mano gyvenimą. Ir visu˛ svarbiausia, nor˙ečiau pad˙ekoti savo vyrui bei geriausiam draugui, Yohann, be kurio meil˙es, padrąsinimo ir redagavimo pagalbos, aš neb¯učiau baigus šios tez˙es.
Last but not least, I recognize that this research would not have been possible without the financial assistance. The research leading to these results have received funding from the [Euro-pean Community’s] Seventh Framework Programme [FP7/2007-2013] under grant agreement n° [211800].
Contents
I. Introduction 1 1. G Protein-Coupled Receptors 3 1.1. GPCR background . . . 3 1.1.1. Topology . . . 4 1.1.2. Ligands of GPCRs . . . 41.1.3. Classification of G Protein-Coupled Receptors . . . 6
1.1.3.1. Glutamate group . . . 6 1.1.3.2. Rhodopsin group . . . 7 1.1.3.3. Adhesion group . . . 8 1.1.3.4. Frizzled/Taste2 group . . . 8 1.1.3.5. Secretin group . . . 9 1.2. GPCR activation . . . 10
1.2.1. Simple linear Two-State Model . . . 10
1.2.2. Ternary Complex Model . . . 11
1.2.3. Extended Ternary Complex Model . . . 11
1.2.4. Cubic Ternary Complex Model . . . 12
1.2.5. Constitutive activity . . . 12
1.3. G protein signaling pathway . . . 13
1.3.1. G-protein subunits . . . 14
1.3.1.1. The Gα subunit . . . 14
1.3.1.2. The Gβγ dimer . . . 17
1.3.2. G protein independent signaling . . . 20
1.3.3. Desensitization . . . 22 1.3.3.1. Homologous desensitization . . . 22 1.3.3.2. Heterologous desensitization . . . 22 1.3.4. Internalization . . . 23 1.4. Dimerization of GPCRs . . . 23 1.5. GPCRs as pharmaceutical targets . . . 25 1.6. Solved GPCR structures . . . 27
2. The model proteins 33
2.1. Chemokine receptors . . . 33
2.1.1. Chemotaxis . . . 33
2.1.2. Leukocyte extravasation . . . 34
2.1.3. Classification of chemokine receptors . . . 35
2.1.4. Characterization of chemokine receptors . . . 35
2.1.5. Receptor dimerization . . . 36
2.1.6. Chemokine receptors of interest . . . 37
2.1.6.1. CCR5 . . . 37
2.1.6.2. CXCR4 . . . 39
2.1.6.3. Chemokine receptors and human health . . . 44
2.2. Chemokines . . . 47 2.2.1. Chemokine classification . . . 48 2.2.1.1. CC chemokines . . . 48 2.2.1.2. CXC chemokines . . . 50 2.2.1.3. CX3C chemokines . . . 50 2.2.1.4. C chemokines . . . 51
2.2.2. Functional chemokine classification . . . 51
2.2.3. Chemokine 3D structure . . . 52
2.2.4. Oligomerization . . . 52
2.2.5. Biological activity of chemokines . . . 54
2.2.6. Chemokines of interest . . . 56
2.2.6.1. RANTES . . . 56
2.2.6.2. SDF1α . . . 62
3. Biochemistry of membrane proteins 65 3.1. Solubilizing membrane proteins . . . 65
3.2. Detergents . . . 66
3.2.1. General introduction . . . 66
3.2.2. Detergent classification . . . 66
3.2.3. Physical properties of detergents . . . 67
3.2.4. Extraction/solubilization from membranes . . . 67
3.2.5. Protein denaturation and aggregation . . . 69
3.2.6. Commonly used detergents . . . 69
3.3. Nanodiscs . . . 70
3.4. Fluorinated Surfactants . . . 71
3.5. Amphipols . . . 72
3.5.1. Amphipol A8-35 . . . 73
3.5.2. Non-ionic Amphipol (NAPol) . . . 74
3.5.3. Sulfonated Amphipol . . . 75
Contents
3.5.5. Labeled Amphipols . . . 77
3.5.6. Biotinylated Amphipols . . . 77
3.5.7. Fluorescent Amphipols . . . 78
3.6. Applications for amphipols . . . 78
4. Objectives 83 5. Résumé de l’introduction et des objectifs en français 85 II. Materials and methods 87 6. Materials 89 6.1. Product lists . . . 89
7. Methods 93 7.1. Chemokine production . . . 93
7.1.1. Molecular biology . . . 93
7.1.1.1. MBP chemokine construct preparation . . . 93
7.1.1.2. Constructs for the chemokine expression in E. coli inclusion bodies 94 7.1.2. MBP-chemokine expression . . . 94
7.1.3. MBP-chemokine purification . . . 94
7.1.4. Chemokines purification from E. coli inclusion bodies . . . 95
7.1.4.1. Preparation of inclusion bodies . . . 95
7.1.4.2. SDF1α-His, SDF1α-Strep purification and refolding . . . 95
7.1.4.3. Rantes-Strep and RANTES purification and refolding . . . 96
7.1.4.4. SDF1α-LT-His, SDF1α-LT-Strep and RANTES-LT-Strep purifi-cation and refolding . . . 96
7.2. Receptor production . . . 96
7.2.1. Expression . . . 96
7.2.2. Extraction and purification . . . 97
7.2.3. Receptor folding in amphipols . . . 98
7.3. Protein characterization methods . . . 98
7.3.1. Transwell (Boyden Chamber) Cell Migration Assay . . . 98
7.3.2. Surface Plasmon Resonance (SPR) analysis . . . 99
7.3.2.1. Materials . . . 99
7.3.2.2. Immobilization of CCR5-His on NTA Sensor Chip . . . 100
7.3.2.3. Chemokine interaction with the receptor on CCR5-His function-alized NTA Sensor Chip . . . 100
7.3.2.4. Immobilization of CCR5-His-C9 on CM4 Sensor Chip . . . 100
7.3.2.4.1. 1D4 antibody pre-concentration test . . . 100
7.3.2.4.2. 1D4 antibody immobilization on CM4 Sensor Chip . . . 101
7.3.2.4.4. CCR5-His-C9 surface regeneration . . . 101
7.3.2.5. Chemokine interaction with the receptor on CCR5-His-C9/1D4 functionalized CM4 Sensor Chip . . . 101
7.3.2.6. Immobilization of CCR5-His on SA Sensor Chip . . . 101
7.3.2.7. Immobilization of RANTES-Strep on CM4 Sensor Chip . . . 101
7.3.2.7.1. RANTES-Strep pre-concentration test . . . 101
7.3.2.7.2. RANTES-Strep immobilization on CM4 Sensor Chip . . 102
7.3.2.7.3. Chemokine interaction with amphipols . . . 102
7.3.3. Electrospray mass spectrometry . . . 102
7.4. Introduction to Lanthanoids . . . 102
7.4.1. Lanthanoid binding tag . . . 105
7.4.1.1. Terbium titration . . . 106
8. Résumé de matériel et méthodes en français 107 III. Results 111 9. Chemokine production 113 9.1. Chemokines . . . 114 9.2. MBP constructs . . . 114 9.2.1. Molecular biology . . . 114 9.2.1.1. Features . . . 114 9.2.1.2. Cloning . . . 115 9.2.2. Expression . . . 116 9.2.3. Purification . . . 117 9.2.3.1. MBP-Xa-RANTES-LT-Strep . . . 117 9.2.3.2. MBP-PrePro-RANTES-LT-Strep Purification . . . 119 9.2.3.3. MBP-PrePro-RANTES-Strep Purification . . . 122 9.2.3.4. MBP-PrePro-SDF1α-Strep Purification . . . 122 9.2.3.5. MBP-PrePro-SDF1α-LT-Strep Purification . . . 123 9.2.4. Functional assays . . . 124 9.2.4.1. Chemotaxis . . . 124
9.3. Expression in E. coli inclusion bodies . . . 125
9.3.1. Molecular biology . . . 125
9.3.2. Chemokine expression . . . 126
9.3.3. SDF1α-His and SDF1α-LT-His purification . . . 127
9.3.4. SDF1α-Strep and SDF1α-LT-Strep purification . . . 129
9.3.5. RANTES-Strep purification . . . 129
9.3.6. RANTES purification . . . 131
9.3.7. RANTES-LT-Strep purification . . . 131
Contents
9.5. Luminescence titration . . . 134
9.6. Development of an electrophysiology test of chemokine triggered signal transduc-tion . . . 136
10.Receptor production 137 10.1. Molecular biology . . . 137
10.2. Expression and purification of α5I-CCR5-His . . . 137
10.3. Expression and purification of α5I-V2-CXCR4-His . . . 139
10.4. CCR5 folding - previous works . . . 141
10.5. Amphipol-assisted CCR5 folding . . . 142
10.6. Improvements . . . 144
10.7. Expression and purification of α5I-CCR5-His-C9 . . . 145
11.Analysis of CCR5 - RANTES interaction using SPR 149 11.1. Introduction on Surface Plasmon Resonance . . . 149
11.1.1. Sensor surface properties . . . 151
11.1.2. Ligand immobilization methods . . . 152
11.1.3. Covalent immobilization methods . . . 152
11.1.3.1. Amine coupling . . . 152
11.1.3.2. Conditions for ligand immobilization . . . 153
11.1.3.3. Results of immobilization . . . 155
11.1.4. Capturing techniques . . . 155
11.1.4.1. Streptavidin-biotin capture . . . 155
11.1.4.2. Antibody-based capture . . . 156
11.1.4.3. Capture of histidine-tagged molecules . . . 157
11.2. Results . . . 158
11.2.1. CCR5 capture on NTA sensor chip . . . 158
11.2.1.1. Development of the SPR assay to study CCR5 - chemokine in-teraction . . . 158
11.2.1.2. Chemokine tag influence for the interaction with the receptor . . 163
11.2.2. CCR5 immobilization on CM4 sensor chip . . . 164
11.2.2.1. Optimization of the antibody immobilization conditions . . . 164
11.2.2.2. 1D4 antibody immobilization by amine coupling . . . 165
11.2.2.3. Receptor capture on 1D4 antibody surface . . . 166
11.2.2.4. The CCR5 surface activity test . . . 167
11.2.3. Chemokine interaction with amphipols . . . 169
11.2.4. CCR5 immobilization on a SA sensor chip . . . 171
11.2.5. CCR5 surface stability . . . 173
12.Résumé des résultats en français 175 12.1. Production de chimiokines . . . 175
12.3. Analyse de l’interaction CCR5 – RANTES par SPR . . . 179
IV. Discussions, conclusions and future perspectives 181 13.Discussions, conclusions and future perspectives 183 13.1. State of the art at the beginning of my Ph.D. . . 183
13.2. Chemokine production and functional validation . . . 185
13.2.1. Achievements . . . 185
13.2.2. Perspectives . . . 186
13.3. Receptor production . . . 188
13.3.1. Achievements . . . 188
13.3.2. Perspectives . . . 189
13.4. Surface Plasmon Resonance . . . 190
13.4.1. Achievements . . . 190
13.4.2. Perspectives . . . 191
14.Discussions, conclusions et perspectives en français 193 14.1. Etat de l’art au début de ma thèse de doctorat . . . 193
14.2. La production de chimiokines et de validation de leur fonctionalité . . . 195
14.2.1. Travaux accomplis . . . 195
14.2.2. Perspectives . . . 196
14.3. La production des récepteurs . . . 197
14.3.1. Travaux accomplis . . . 197
14.3.2. Perspectives . . . 198
14.4. Resonance des plasmon de surface . . . 198
14.4.1. Travaux accomplis . . . 198 14.4.2. Perspectives . . . 200 V. References 201 VI. Appendix 237 15.Experiments 239 15.1. Chemokine purification . . . 239 15.1.1. SDF1α-Strep purification . . . 239 15.1.2. SDF1α-LT-Strep purification . . . 240 15.2. In vitro synthesis . . . 241 16.Molecular biology 243 17.Used primers 245
Contents
List of Figures
1.1. GPCR signaling. . . 3
1.2. GPCR common topology. . . 4
1.3. Schematic representation of dose response curves by different types of GPCR ligands. 5 1.4. Schematic representation of Glutamate family receptor. . . 6
1.5. Schematic representation of Rhodopsin family receptor. . . 7
1.6. Schematic representation of Secretin family receptor. . . 9
1.7. Simple linear two-state model. . . 10
1.8. Ternary complex model. . . 11
1.9. Extended ternary complex model. . . 11
1.10. Cubic ternary complex model. . . 12
1.11. GPCR activation cycle. . . 13
1.12. Structure of Bos taurus Gα subunit. . . 14
1.13. Typical patterns of Receptor-Gα protein signaling in the cells. . . 16
1.14. Structure of Bos taurus Gβγ dimer. . . 18
1.15. G protein independent signaling. . . 20
1.16. The signaling mediated by GRKs and Arrestins. . . 21
1.17. GPCR heteromerization role signaling. . . 25
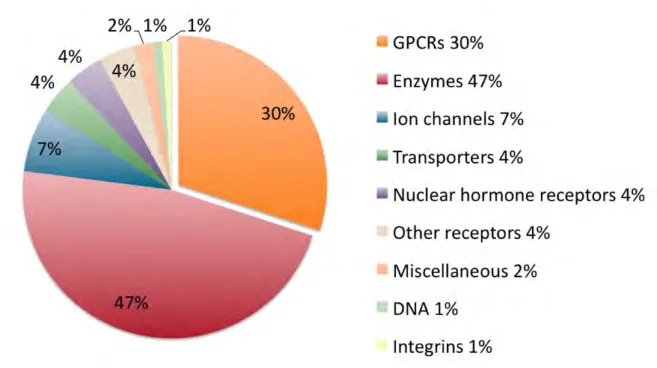
1.18. Schematic representation of actual drug targets in the pharmaceutical market. . 26
1.19. Structure of human β2AR. . . 28
1.20. Structure of GPCR in complex with G proteins. . . 30
1.21. The β2AR activation mechanism. . . 31
2.1. Gradient sensing and chemotaxis. . . 33
2.2. Leukocyte entry into site of inflammation. . . 34
2.3. Snake-like plot of human CCR5 sequence. . . 38
2.4. Solved CXCR4 structure. . . 40
2.5. CXCR4 transmembrane helices comparison with other GPCR structures. . . 41
2.6. Diversity of ligand binding pocket shapes in GPCR crystal structures. . . 42
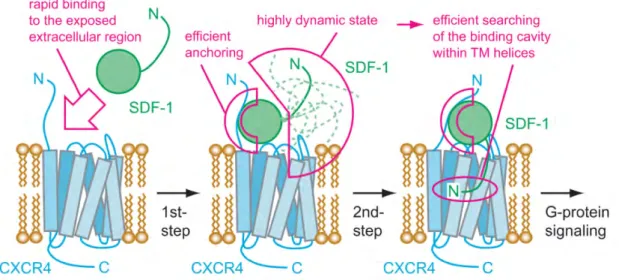
2.7. Schematic diagram of the two-step mechanism for the CXCR4/SDF1α interaction. 43 2.8. Stoichiometry of possible CXCR4-SDF-1α complexes. . . 44
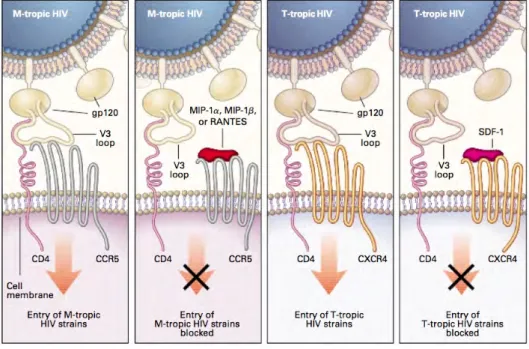
2.9. Chemokine inhibition of HIV entry. . . 45
2.10. Schematic representation of chemokine three dimensional structure. . . 47
2.12. 3D structures of SDF1α and RANTES monomers. . . 52
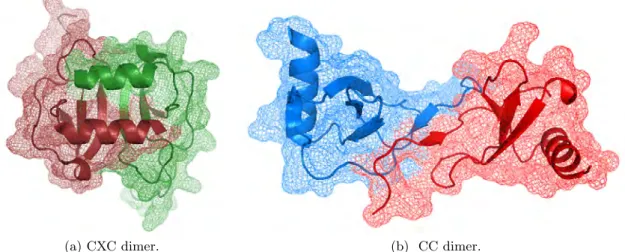
2.13. 3D structures of chemokine dimers. . . 53
2.14. Schematic model representing chemokine receptor activated signaling pathways. . 55
2.15. Substitution of the first three residues of RANTES dramatically changes the pro-tein’s ability to prevent entry of HIV into cells. . . 58
2.16. Octameric structure of RANTES. . . 59
2.17. Comparison of MIP1α tetramer with RANTES tetramer . . . 60
2.18. The model of tetrameric RANTES binding GAG. . . 60
2.19. Trafficking routes of CCR5 upon different RANTES treatment. . . 61
2.20. SDF1α dimer. . . 63
2.21. Model of SDF1α and heparin complex. . . 63
3.1. Solubilization of membranes by detergents. . . 68
3.2. Schematic representation of the solubilization process. . . 68
3.3. Schematic representation of β2AR assembled in Nanodisc. . . 71
3.4. Chemical structure of Fluorinated Surfactant. . . 72
3.5. Membrane protein trapped in APols. . . 73
3.6. A8-35 . . . 74 3.7. NAPol. . . 75 3.8. SAPol. . . 76 3.9. PC-APol. . . 76 3.10. BAPol. . . 77 3.11. FAPol. . . 78
3.12. Schematic representation of GPCR folding and functional assay. . . 79
3.13. Amphipol assessed GPCRs folding. . . 80
3.14. Stability of BLT1 trapped in A8-35. . . 80
3.15. Immobilization of BAPol trapped membrane protein. . . 81
7.1. Schematic representation of Boyden/transwell chamber. . . 99
7.2. Lanthanoid metals. . . 103
7.3. Emission spectrum of T b3+ . . . 103
7.4. Excitation of T b3+ luminescence. . . . 104
7.5. Antenna effect. . . 104
7.6. LT tag bound terbium ions. . . 105
7.7. The security measures on euro banknotes. . . 105
7.8. Double lanthanoid binding tag. . . 106
9.1. Schematic representation of MBP-chemokine constructs. . . 115
9.2. SDS-polyacrylamide gels showing expression of MBP-chemokine constructs. . . . 116
9.3. SDS-polyacrylamide gels representing solubility test of RANTES with and without LT tag. . . 117
List of Figures 9.4. SDS-polyacrylamide gel showing MBP-Xa-RANTES-LT-Strep purification on
Strep-Trap column. . . 117
9.5. SDS-polyacrylamide gel and Western blot showing MBP-Xa-RANTES-LT-Strep Factor Xa digestion. . . 118
9.6. SDS-polyacrylamide gel showing MBP-Xa-RANTES-LT-Strep digestion test with PreScission protease. . . 118
9.7. SDS-polyacrylamide gel representing MBP-PrePro-RANTES-LT-Strep solubility test. . . 119
9.8. SDS-polyacrylamide gel representing MBP-PrePro-RANTES-LT-Strep purification.119 9.9. SDS-polyacrylamide gel representing the RANTES-LT-Strep purification after di-gestion with PreScission protease. . . 120
9.10. RANTES-LT-Strep elution profile on Superdex 200 column. . . 120
9.11. MALDI Spectrum of RANTES-LT-Strep. . . 121
9.12. RANTES-LT-Strep oligomerization states monitored in gel filtration column. . . 122
9.13. MBP-PrePro-SDF1α-LT-Strep digestion with PreScission protease. . . 123
9.14. Purification of SDF1α-LT-Strep on Superdex 200 column. . . 123
9.15. Chemokine induced cell migration. . . 124
9.16. Chemotaxis assay of MBP-SDF1α-LT and SDF1α-LT. . . 125
9.17. Schematic representation of chemokine constructs for the expression in E. coli inclusion bodies. . . 126
9.18. SDS-polyacrylamide gel showing SDF1α-His and SDF1α-LT-His expression in E. coli inclusion bodies. . . 127
9.19. SDS-polyacrylamide gel showing solubilized inclusion bodies. . . 127
9.20. Cation (a) and Anion (b) - exchange chromatography. . . 128
9.21. Gel Filtration elution profiles of SDF1α-His and SDF1α-LT-His. . . 128
9.22. SDS-polyacrylamide gel showing purified SDF1α-Strep and SDF1α-LT-Strep. . . . 129
9.23. RANTES-Strep purification on Capto S column. . . 130
9.24. RANTES-Strep elution profile from the Superdex 200 column. . . 130
9.25. SDS-polyacrylamide gel of purified RANTES-Strep. . . 131
9.26. SDS-polyacrylamide gel of purified RANTES. . . 131
9.27. RANTES-LT-Strep purification on Q Sepharose (a) and Superdex 200 (b) columns.132 9.28. SDS-polyacrylamide gel representing all purified chemokine constructs. . . 132
9.29. Chemotaxis assay of chemokines. . . 133
9.30. Tryptophane-sensitized Tb3+ luminescence emission spectra of buffer and SDF1α-LT-His during 2 μM terbium. . . 135
9.31. Tryptophane-sensitized Tb3+ luminescence emission spectra of SDF1α-LT-His in the presence of terbium titration. . . 135
9.32. Luminescence at 490 nm and 542 nm as a function of terbium concentration. . . 136
10.1. SDS-polyacrylamide gel representing α5I-CCR5-His purification over a Ni-NTA resin. . . 138
10.2. SDS-polyacrylamide gel representing α5I-CCR5-His thrombin digestion. . . 138
10.3. SDS-polyacrylamide gel showing CCR5-His purification on Ni-NTA resin. . . 139
10.4. SDS-polyacrylamide gel of purified CCR5-His. . . 139
10.5. SDS-polyacrylamide gel representing α5I-V2-CXCR4 first step of purification. . . 140
10.6. SDS-polyacrylamide gel representing α5I-V2-CXCR4 thrombin digestion. . . 140
10.7. Folded receptor interaction with MIP1β. . . 141
10.8. Histograms representing fluorescence polarization signal between MIP1β-Texas Red and the CCR5 receptor. . . 142
10.9. SDS-polyacrylamide gel representing CCR5-His folding in A8-35. . . 143
10.10.Histograms representing CCR5 folding in different conditions. . . 143
10.11.Time-dependent CCR5/NAPol solubility. . . 144
10.12.SDS-polyacrylamide gel representing α5I-CCR5-His-C9 purification over a Ni-NTA resin. . . 145
10.13.Western blotting representing α5I-CCR5-His-C9 purification over a Ni-NTA resin. 146 10.14.SDS-polyacrylamide gel representing α5I-CCR5-His-C9 digestion with thrombin. . 146
10.15.SDS-polyacrylamide gel representing CCR5-His-C9 purification on Ni-NTA resin. 147 10.16.SDS-polyacrylamide gel representing the sulubilized CCR5-His-C9 in NAPol. . . 147
11.1. Ligand, analyte and capturing molecule in relation to the sensor surface. . . 149
11.2. Overview of Biacore SPR technology. . . 150
11.3. Schematic illustration of a sensorgram. . . 150
11.4. Equation to calculate maximal binding capacity. . . 151
11.5. Schematic illustration of the structure of the sensor chip surface. . . 151
11.6. Schematic view of amine coupling of ligands to the sensor surface. . . 153
11.7. Electrostatic attraction of the ligand to the CM-dextran. . . 154
11.8. Sensorgram from a typical amine coupling. . . 155
11.9. Schematic view of biotinylated ligand capture by high affinity binding to strepta-vidin on Sensor Chip SA. . . 156
11.10.Schematic view of antibody-based capture. . . 156
11.11.Schematic view of the chip surface of NTA Sensor Chip. . . 157
11.12.Schematic representation of CCR5/NAPol immobilization on NTA sensor chip. . 158
11.13.Normalized sensorgrams representing NTA chip functionalization and chemokine binding test. . . 159
11.14.Normalized sensorgrams showing RANTES-Strep interaction with CCR5-His/NAPol/L surface. . . 160
11.15.Concentration dependency of RANTES-Strep binding responses. . . 161
11.16.Calculation of CCR5/NAPol/L maximal binding capacity. . . 162
11.17.Normalized reference surface corrected sensorgram showing a comparison of dif-ferent chemokine interaction with the CCR5/NAPol/L surface. . . 163
11.18.Schematic representation of 1D4 capture on CM4 sensor chip and CCR5/NAPol binding. . . 164
List of Figures
11.19.Test of 1D4 antibody pre-concentration on CM4 sensor chip. . . 165
11.20.The sensorgram representing 1D4 immobilization by amine coupling. . . 166
11.21.Normalized sensorgram showing CCR5/NAPol/L binding on 1D4 surface. . . 166
11.22.Sensorgram representing RANTES-Strep injection over 1D4 surface. . . 167
11.23.Reference surface corrected sensorgram showing injections of chemokines onto CCR5/NAPol/L surface. . . 167
11.24.Normalized and double referenced sensorgrams showing the specificity of CCR5 surface. . . 168
11.25.Calculation of CCR5/NAPol/L maximal binding capacity. . . 168
11.26.Histograms representing RANTES-Strep pre-concentration. . . 169
11.27.Reference surface corrected sensorgrams showing injections of NAPol and A8-35 onto RANTES-Strep surface. . . 170
11.28.Histograms representing NAPol and A8-35 interaction with RANTES-Strep surface.171 11.29.Schematic representation of CCR5/BAPol immobilization on SA sensor chip. . . 172
11.30.Normalized sensorgram showing CCR5/BAPol/L functionalization on SA sensor chip. . . 172
11.31.Schematic representation of the different surfaces prepared for SPR experiments. 173 13.1. Schematic representation of channel gating through G proteins. . . 186
13.2. Schematic representation of ion-channel-coupled receptors (ICCR) principle. . . . 187
13.3. Schematic representation of chemokine affinity column. . . 189
15.1. SDF1α-Strep elution from Capto S column. . . 239
15.2. SDF1α-Strep elution from Superdex 200 column. . . 239
15.3. SDF1α-LT-Strep elution profile from Q sepharose column. . . 240
15.4. SDF1α-LT-Strep running profile in Superdex 200 column. . . 240
15.5. SDS-polyacrylamide gel analysis of chemokine receptors in cell-free synthesis. . . 241
15.6. Western Blot of chemokine receptors expression in cell-free synthesis. . . 242
18.1. SDF1α DNA sequence in pUC57 vector and protein sequence. . . 247
18.2. RANTES DNA sequence in pUC57 vector and protein sequence. . . 247
18.3. RANTES-LT DNA sequence in pUC57 vector and protein sequence. . . 248
18.4. DNA and protein MBP-PrePro-SDF1α-Strep sequence. . . 249
18.5. DNA and protein MBP-PrePro-SDF1α-LT-Strep sequence. . . 250
18.6. DNA and protein MBP-PrePro-RANTES-Strep sequence. . . 251
18.7. DNA and protein MBP-PrePro-RANTES-LT-Strep sequence. . . 252
18.8. DNA and protein SDF1α-His sequence. . . 253
18.9. DNA and protein SDF1α-LT-His sequence. . . 253
18.10.DNA and protein SDF1α-Strep sequence. . . 253
18.11.DNA and protein SDF1α-LT-Strep sequence. . . 254
18.12.DNA and protein RANTES sequence. . . 254
18.14.DNA and protein RANTES-LT-Strep sequence. . . 255
18.15.DNA and protein α5I-CCR5-His sequence. . . 256
18.16.DNA and protein α5I-CCR5-His-C9 sequence. . . 257
18.17.Part I. DNA and protein α5I-V2-CXCR4-His sequence. . . 258
18.18.Part II. DNA and protein α5I-V2-CXCR4-His sequence. . . 259
18.19.DNA and protein pIVEX 2.3d CCR5 WT sequence. . . 260
18.20.DNA and protein pIVEX 2.3d CCR5 optimized sequence. . . 261
18.21.DNA and protein pIVEX 2.4d CCR5 optimized sequence. . . 262
18.22.DNA and protein pIVEX 2.3d CXCR4 optimized sequence. . . 263
18.23.DNA and protein pIVEX 2.4d CXCR4 optimized sequence. . . 264
18.24.DNA and protein pIVEX 2.4d CCR5 WT sequence. . . 265
List of Tables
0.1. Amino acids and their abbreviations. . . xxiv
0.2. Nucleotides and their abbreviations. . . xxiv
1.1. Gα subunit classes and their effectors. . . 15
1.2. Gβγ subunit classes and their effectors. . . 19
1.3. Disease associated GPCRs. . . 26
1.4. The list of top 10 blockbuster drugs. . . 27
1.5. Solved GPCRs structures by the end of 2011. . . 29
2.1. Human chemokine receptors . . . 36
2.2. CC chemokines and their main receptors. . . 49
2.3. CXC chemokines and their receptors . . . 50
2.4. CX3C chemokine and its receptor. . . 51
2.5. C chemokines and their receptors. . . 51
2.6. N-terminal RANTES modifications. . . 57
3.1. Structures and properties of detergents commonly used to solubilize membrane proteins. . . 70
6.1. Bacterial strains. . . 89
6.2. Products for Molecular Biology. . . 89
6.3. Columns and resins. . . 89
6.4. Antibodies. . . 90
6.5. Concentrators and membranes. . . 90
6.6. Materials for gels. . . 90
6.7. SPR products. . . 90
6.8. Biochemistry Products. . . 91
11.1. Biacore sensor chips used in this study. . . 152
11.2. Apparent RANTES-Strep - CCR5 interaction parameters. . . 162
11.3. Three different surface stability comparison. . . 173
15.1. Clones for cell-free synthesis. . . 241
17.1. Primers used for PCR. . . 245
Abbreviations
A2AAR A2A Adenosine Receptor
A8-35 A particular type of anionic amphipol AA Amino Acid
AC Adenylyl Cyclase
ADP Adenosine Diphosphate APol Amphipols
ATP Adenosine-5’-Triphosphate AUC Analytical Ultracentrifugation β2AR β2-Adrenergic Receptor BAPol Biotinylated Amphipol
BRET Bioluminescence Resonance Energy Transfer C8E4 Octyltetraoxyethylene
cAMP cyclic Adenosine Mono-Phosphate CCR5 CC Chemokine Receptor 5
CMC Critical Micelle Concentration CRD Cysteine-Rich Domain
CSC Critical Solubilization Concentration CTC Cubic Ternary Complex model CXCR4 CXC Chemokine Receptor 4
D3R Dopamine D3 receptor DAG Diacylglycerol
DARC Duffy Antigen Receptor for Chemokine DDM n-Dodecyl-β-D-maltoside
DG n-decyl-beta-D-glucopyranoside DM n-decyl-β-D-maltopyranoside DOR δ-opioid Receptor
DPC Dodecyl Phosphocholine DTT Dithiothreitol
EDC N’-(3-dimethylaminopropyl) carbodiimide hydrochloride EDTA Ethylenediaminetetraacetic acid
ECL Extracellular Loop ER Endoplasmic Reticulum
ETC Extended Ternary Complex model
F-TAC C6F13C2H4- S-poly-Tris-(hydroxymethyl) aminomethane FAPol Fluorescently labeled Amphipols
FBS Fetal Bovine Serum
FRET Fluorescence (or Förster) Resonance Energy Transfer FZD Frizzled receptors
GABA γ-aminobutyric acid
GABAbR γ-aminobutyric acid b receptor GAG Glycosaminoglycan
GDP Guanosine Diphosphate GuHCl Guanidine hydrochloride,
Abbreviations GEF Guanine nucleotide Exchange Factor
GIRK G protein regulated Inward Rectifier potassium channel GPCR G Protein-Coupled Receptor
GPS GPCR Proteolytic Site
GRAFS Glutamate, Rhodopsin, Adhesion, Frizzled/Taste2 and Secretin GRK G Protein–coupled Receptor Kinases
GST Glutathione S-Transferase GuHCl Guanidine hydrochloride H1R Histamine H1 Receptor
HEPES 2-[4-(2-hydroxyethyl) piperazin-1-yl] ethanesulfonic acid HFS Hemifluorinated Surfactant
HIV Human Immunodeficiency Virus HS Heparin Sulphate
HSC Hematopoietic Stem Cells IB Inclusion Bodies
ICL Intracellular Loop IL-2 Interleukin-2
INS Inelastic Neutron Scattering IP3 Inositol trisphosphate JAK Janus Kinase
kDa kilo Dalton
LDAO N,N-dimethyldodecylamine-N-oxide LPA Lysophosphatidic acid
MALS Multi Angle Light Scattering MAP Mitogen-Activated Protein
MAPK Mitogen-Activated Protein Kinase MBP Maltose Binding Protein
MD Molecular Dynamics
MIP Macrophage Inflammatory Protein MSP Membrane Scaffold Protein MW Molecular Weight
nAChR nicotinic Acetylcholine Receptor NAPol Non-ionic Amphipol
NBD 7-nitrobenz-2-oxa-1, 3- diazol-4-yl NBD Nucleotide Binding Domain NDPK Nucleoside Diphosphate Kinase NG n-nonyl-beta-D-glucopyranoside NHS N-hydroxysuccinimide
NK Natural-Killer
NMR Nuclear Magnetic Resonance OG n-octyl-β-D-glucopyranoside OG Octylglucoside
OM n-octy-beta-D-maltopyranoside PBS Phosphate-Buffered Saline PC Phosphorylcholine
PC-APol Phosphorylcholine-based Amphipol PCR Polymerase Chain Reaction
Abbreviations PDE Phosphodiesterase
PI3K Phosphatidyl inositol 3-kinase
PIP2 Phosphatidylinositol 4, 5-biphosphate PKC Protein Kinase C
PKD Protein Kinase D PLA Phospholipase A PLC Phospholipase C PLC-β Phospholipase C-β PrePro PreScission protease
PurF Glutamine Phosphoribosyl Pyrophosphatase Amidotransferase R Receptor
R* Activated Receptor
RANTES Regulated on Activation, Normal T cell Expressed and Secreted RGS Regulators of G protein Signaling
RU Response (or Resonance) Units SA Streptavidin
SANS Small Angle Neutron Scattering SAPol Sulfonated Amphipol
SAXS Small Angle X-ray Scattering SDS Sodium Dodecyl Sulfate
SDS-PAGE Sodium Dodecyl Sulfate Polyacrylamide Gel Electrophoresis Smo Smoothened Receptor
SPR Surface Plasmon Resonance T4L T4 lysozyme
TC Ternary Complex Model
TEVC Two-Electrode Voltage Clamp method TM Transmembrane
Tris 2-Amino-2-hydroxymethyl-propane-1, 3-diol VDCC Voltage-Dependent Ca2+ Channels
Standard one- and three-letter codes used for the amino acids.
Amino acid Three-letter code One-letter code
Alanine Ala A
Arginine Arg R
Asparagine Asn N
Aspartic acid (Aspartate) Asp D
Cysteine Cys C
Glutamine Gln Q
Glutamic acid (Glutamate) Glu E
Glycine Gly G Histidine His H Isoleucine Ile I Leucine Leu L Lysine Lys K Methionine Met M Phenylalanine Phe F Proline Pro P Serine Ser S Threonine Thr T Tryptophan Trp W Tyrosine Tyr Y Valine Val V Unspecific aa Xaa X
Table 0.1.: Amino acids and their abbreviations. Standard one-letter codes used for the nucleotides.
Nucleotide One-letter code
Adenosine A
Cytidine C
Guanosine G
Thymidine T
Part I.
1. G Protein-Coupled Receptors
1.1. GPCR background
G Protein-Coupled Receptors (GPCRs) form one of the largest and most studied gene families of mammalian genomes. GPCRs are found only in eukaryotes, including yeast, plants, choanoflag-ellates, and animals. From the sequenced human genome over 800 GPCR genes were identified [1].
Figure 1.1.: GPCR signaling.
GPCRs bind to a very broad range of ligands such as hormones, neurotransmitters, cytokines, lipids, various small molecules such as odors and are reactive to light (Figure 1.1) [2, 3]. GPCRs modulate variety of cell functions through coupling to heterotrimeric G proteins and regulating downstream effectors such as adenylyl cyclases, phospholipases, protein kinases, ion channels and other intracellular messengers [4].
1.1.1. Topology
Members of the GPCR superfamily share a common membrane topology: an extracellular N-terminal domain, an intracellular C-N-terminal domain and seven hydrophobic transmembrane (TM) helices, which are connected by three intracellular loops (ICL) and three extracellular loops (ECL) (Figure 1.2). Each transmembrane helical domain is composed of about 24 amino acids, while the C- and N- terminal regions as well as the loops can widely vary in length with up to hundreds of amino acids. Each of these variable regions provides specific properties to GPCRs.
Figure 1.2.: GPCR common topology.
Most of the GPCRs have two well-conserved cysteine residues, one in extracellular loop 1 (ECL1) and one in extracellular loop 2 (ECL2). They form a disulphide bridge important for packing and stabilization of the helical bundle. The extracellular parts of the receptor can be glycosylated.
1.1.2. Ligands of GPCRs
Ligands that bind and activate the GPCRs can be classified by type as follows [5]: • biogenic amines such as noradrenaline, dopamine, histamine;
• amino acids and ions such as glutamate, GABA, calcium; • lipids such as LPA, prostaglandins;
• peptides and proteins such as chemokines, angiotensin, thrombin; • others such as light, odorants, and nucleotides.
1.1. GPCR BACKGROUND GPCRs naturally exist in multiple conformations ranging from the fully inactive ground state (R) to the fully active state (R*), which couples to G proteins and leads to signal transduction. For any given receptor, equilibrium exists between these two states that determine the basal level of its activity in cells.
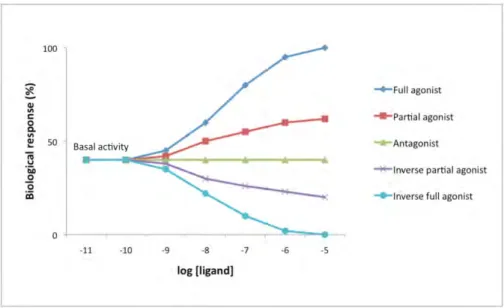
Depending on the GPCR activation state the ligands can be divided into five classes: full agonist, partial agonist, antagonist, inverse partial agonist and inverse full agonist. Figure 1.3 represents the receptor activation effects produced by different types of ligands.
Figure 1.3.: Schematic representation of dose response curves by different types of GPCR ligands.
Full agonist binds and activates the receptor displaying its full efficacy. Efficacy in this case refers to the maximum response achievable from a ligand. Partial agonist binds and activates the receptor but has only partial efficacy compared to full agonist. Both agonists increase the percentage of receptors in the active state above basal activity level. Inverse agonist inhibits the basal activity of the receptor. Antagonist does not provoke a biological response itself upon binding to the receptor but inhibits the action of other ligands and the receptor basal activity state is restored.
GPCR ligands can also be classified according to the receptor-binding site. The majority of known GPCR ligands bind to the same site as the endogenous agonists, the orthosteric site. However, recent studies have described the identification of allosteric ligands for GPCRs, which interact at a distinct site from the orthosteric one [6, 7]. The allosteric sites are of particular pharmacological interest for selective drug design as these sites have not been under specific selective pressure during evolution. Besides, the allosteric sites are quite distinct between highly homologous receptors. Accordingly, they provide excellent targets for highly selective drugs.
1.1.3. Classification of G Protein-Coupled Receptors
Several classification systems have been used to organize the GPCR superfamily. Some are based on the ligand binding modalities others on physiological and structural features.
One of the most frequently used systems uses A, B, C, D, E, and F, classes, which is based on sequence homology and functional similarity [4, 8, 9]. This A–F classification system covers all GPCRs, from vertebrates and invertebrates. Therefore, some families in the A–F classification system do not exist in humans.
More recently, GPCRs have been classified into five distinct groups based on phylogenetic analyses of sequences, from the human genome. This classification system has been named GRAFS, which is an acronym for the five different groups: Glutamate, Rhodopsin, Adhesion, Frizzled/Taste2 and Secretin [1]. The different groups of GRAFS classification system are de-scribed below.
1.1.3.1. Glutamate group
Glutamate family contains 22 members; more than half of these family members remain orphan receptors1.
Figure 1.4.: Schematic representation of Glutamate family receptor. The ICL3 is short and contains highly conserved amino acids [10].
The Glutamate family (also referred to as Class C or Family 3) (Figure 1.4) comprises in metabotropic glutamate receptors, GABA receptors, calcium sensing receptor, taste receptors
1.1. GPCR BACKGROUND (for sweet and umami2) and several orphan receptors. Ligands of Glutamate receptors family
are cations, amino acids, carbohydrates, and other small organic compounds.
These receptors are characterized by a long N- and C- termini and a short and highly con-served third intracellular loop. The N-terminus forms two distinct lobes separated by a cavity in which ligand binds, forming a so-called Venus fly trap domain. The extracellular region also has a cysteine-rich domain (CRD), which contains nine conserved cysteine residues forming three disul-phide bridges, which connect the ligand-binding domain and the intracellular signaling domain located within TM regions [11].
GPCRs that belong to the Glutamate family, form constitutive dimers and are used as model proteins to study functional relevance of GPCR dimerization [12].
1.1.3.2. Rhodopsin group
The Rhodopsin family contains 672 members in the human genome including 388 odorant recep-tors. Despite the fact that this is the largest family there are only 63 orphan receptors[13].
Figure 1.5.: Schematic representation of Rhodopsin family receptor.
Conserved amino acids among the members of the family are represented as well as the palmitoylated cysteine residue in the C-terminal part [10].
Rhodopsin family (Figure 1.5) (also referred to as Class A or Family 1) is by far the largest subgroup and contains receptors for odorants, important neurotransmitters, such as dopamine and serotonin, as well as neuropeptides and glycoprotein hormones. These family members are characterized by several highly conserved amino acids such as NSxxNPxxY motif in the trans-membrane helix 7 (TMVII) and the DRY motif or D(E)-R-Y(E) at the border between TMIII and ICL2 [1]. These conserved sequences have been proposed to be important for the receptor
2
Umamiis one of the five basic tastes together with sweet, sour, bitter, and salty. Umami is a loanword from the Japanese umami meaning "pleasant savory taste". This particular writing was chosen by Professor Kikunae Ikeda from umai "delicious" and mi "taste".
activation or for maintaining the receptor in the inactive state [14]. A conserved disulphide bridge connects the first and second extracellular loops. Most of these receptors also have a palmitoylated cysteine residue in the intracellular C-terminal tail, which serves as an anchor to the membrane.
For small molecules, the ligand binding site is located within the transmembrane part, whereas in the case of peptides and glycoproteins, it is located at the N-terminal part and extracellular loops.
The determination of the crystal structure of rhodopsin [15] has indicated that the transmem-brane domains of rhodopsin family receptors are ’tilted’ and ’kinked’, due to the presence of amino acids such as proline that distort the helical transmembrane domain.
Chemokine receptors belong to this GPCR family.
1.1.3.3. Adhesion group
In the A-F classification system the adhesion receptors belong to class B but in the new GRAFS classification system they are considered as a separate group. Among 33 members of the group there are only 3 receptors, which are no longer orphans. The ligands of these receptors are extracellular matrix molecules such as peptides and glycosaminoglycans.
The family name “adhesion” relates to the long N-terminal part, which contains motifs that participate to cell adhesion. The N-terminal domain is variable in length, from about 200 to 2800 amino acid long and is often rich in glycosylation sites and proline residues that might be important for cell-cell contact [1].
Adhesion GPCRs display the GPCR proteolytic site (GPS). The GPS domain acts as an intra-cellular autocatalytic processing site that produces two non-covalently attached subunits. The proteolytic cleavage of the receptor protein occurs in the endoplasmic reticulum or in the early compartment of the Golgi apparatus and is necessary to transport the receptor to the membrane [16].
1.1.3.4. Frizzled/Taste2 group
This group includes two distinct clusters without any obvious similarities, the Frizzled receptors and the Taste2 receptors (also referred to as Class F or family 6). However, Taste2 and Frizzled receptors, share several consensus sequences: IFL in the second TM, SFLL in the fifth TM, and SxKTL in the seventh TM. Frizzled/Taste2 family includes 36 members. There are no orphans among the 11 Frizzled family members, but most of the Taste2 GPCRs remain orphans.
1.1. GPCR BACKGROUND Frizzled/Smoothened This family includes ten Frizzled receptors (FZD1-10) and the Smoothened receptor (Smo). The Frizzled receptors mediate signals from secreted glycoproteins and in this way they control cell fate, proliferation, and are involved in embryonic development, particu-larly, in cell polarity and segmentation. The Frizzled family receptors have a 200-amino acid long N-terminus which contains several conserved cysteines. Their ligands are proteins.
Taste2 receptors The human genome contains 25 functional Taste2 receptors. They are ex-pressed in the tongue and palate epithelium and function as bitter taste receptors. Their ligands are small organic compounds. Several of the Taste2 receptors are still orphans. Taste2 receptors consist of 290 - 340 amino acids and display short N- and C- termini domains. Taste2 receptors lack the well-conserved cysteine bridge between extracellular loops 1 and 2. Despite few con-served residues that are common for the ligand binding site, these receptors are highly variable between the species.
1.1.3.5. Secretin group
Secretin family comprises 50 members with none of them being orphan receptors (also referred to as Class B or Family 2). Secretin family GPCRs (Figure 1.6) are characterized by a relatively long N-terminus, which contains several cysteines that form a network of disulphide bridges. This extended N-terminal domain together with extracellular loops is implicated in ligand binding. Ligands of secretin family GPCRs include high molecular weight hormones such as glucagon, secretine, calcitonin and Black widow spider toxin.
Figure 1.6.: Schematic representation of Secretin family receptor. Relatively long N-terminus contains several conserved cysteins [10].
The topology of secretin family receptors is similar to some of the rhodopsin family receptors, however the palmitoylation site is missing and the conserved residues and motifs are different from those in the rhodopsin family receptors.
Little is known about the orientation of the TM domains, but given the divergence in amino-acid sequence, they are likely to be different from rhodopsin family receptors. As in rhodopsin family, the secretin family receptors contain several conserved proline residues within the TM segments, which are essential for the conformational dynamics of the receptors.
1.2. GPCR activation
Receptor activation studies started early before the term of receptor was applied. The studies started by observing how different tissues reacted to the drugs. J. N. Langley in 1878 postulated that a drug has to bind to a specific part of the tissue in order to produce an action on that tissue. After a while, he described “side chain molecules” present on different muscles that reacted differently to the drug (nicotine). He named them “receptive substances” that are diverse in different muscles [17]. Lately this term was widely adapted as “receptor”.
For a long time receptor activation was represented by a simple model with a bimodal switch between inactive and active forms. However, increasing experimental evidence provided infor-mation that GPCRs are dynamic and exist in different conforinfor-mational states [18].
1.2.1. Simple linear Two-State Model
The first models used to describe the activation mechanism of GPCRs were based on the law of mass action. The interaction between the receptor (R) and the agonist (A) depends on the equilibrium association constant (Ka) resulting in receptor activation (Figure 1.7).
Figure 1.7.: Simple linear two-state model. A - Agonist, R - Receptor, R* - Activated Receptor.
An agonist (A) binds to the receptor (R) to form an agonist-receptor complex (AR). The level of the AR complex present at thermodynamic equilibrium can be defined by the value of the Ka.
A physiological response can be expected only when the AR complex is formed, and a maximal response will occur when the agonist occupies all receptor sites.
In 1980, this idea was modified taking into account receptor properties such as intrinsic activity, efficiency, conformational changes and G protein binding.
1.2. GPCR ACTIVATION
1.2.2. Ternary Complex Model
Studying the β2 Adrenergic Receptor (β2AR), A. De Lean and co-workers established the Ternary Complex (TC) Model [19] (Figure 1.8). This model originated form the simple linear two-state model.
Figure 1.8.: Ternary complex model. A - Agonist, R - Receptor, G - G Protein.
The initial ternary complex model describes the interactions between ligand, receptor, and G protein. This model implies that the receptor recognizes the agonist and the G protein in a random order.
1.2.3. Extended Ternary Complex Model
Continuous research and discoveries led to the further model development. In 1993, the studies of the β2AR activation indicated that a GPCR could activate G proteins without being stimulated by a ligand [20, 21]. At this stage the Extended Ternary Complex (ETC) model was introduced to include the spontaneous activation of a receptor that can interact with a G protein even in the absence of agonist binding (Figure 1.9).
Figure 1.9.: Extended ternary complex model.
A - Agonist, R - Receptor, R* - Activated Receptor, G - G Protein.
This model allows both the spontaneous and ligand induced active-state receptor (R*). R* can then interact with the ligand or activated G protein. In this model, the agonists have
stronger affinity to R* than for R, shifting the equilibrium toward the active form of the receptor. Antagonists have similar affinity for both forms and do not affect the balance. Inverse agonists have a tendency to bind to R and therefore move the equilibrium towards the inactive-state R form.
1.2.4. Cubic Ternary Complex Model
In 1996, to introduce receptor activation and G protein coupling the Cubic Ternary Complex (CTC) was established [22]. The CTC model adds a possibility of an active receptor and G protein association that does not cause signaling. This non-signaling complex is required ther-modynamically.
The CTC model takes into account that receptor can be in active (R*) or inactive (R) conforma-tion and bound to the G protein (R*G and RG) or not (Figure 1.10). In this model, the receptor can interact with a G protein and/or a ligand at the same time. In addition, different receptors both active and inactive receptors may compete for the same ligand or G protein.
Figure 1.10.: Cubic ternary complex model.
A - Agonist, R - Receptor, R* - Activated Receptor, G - G Protein.
However, the model does not include receptor homo- or hetero-oligomerization [23, 10, 24, 25, 26, 27], or the possibility that GPCRs can form stable complexes with downstream proteins [28].
1.2.5. Constitutive activity
The constitutive activity of GPCRs can be defined as the ability of a receptor to present an intrinsic activity in the absence of agonist. The evidence of constitutive activity of GPCRs has been described in the studies of the δ-opioid receptor [29], and purified β2AR [30]. Inverse agonist binding can block the constitutive activity of receptors.
1.3. G PROTEIN SIGNALING PATHWAY Most if not all GPCRs can exist in at least two states: an active state favored by agonist and an inactive state favored by inverse agonist [31, 32, 33].
Mutants with increased constitutive activity of GPCRs were later discovered. GPCR mutations in the region near the interface at the end of the third intracellular loop and at the beginning of transmembrane helix VI result in the elevated levels of constitutive activity [34, 35].
1.3. G protein signaling pathway
Heterotrimeric G proteins composed of Gα, Gβ and Gγ subunits constitute one of the most im-portant components of the cell signaling cascade [36]. They transmit signals from transmembrane receptors, ion channels and further to intracellular effector enzymes.
Figure 1.11.: GPCR activation cycle.
In the receptor inactive state (A), the Gα subunit in a GDP bound form is associated to the Gβγ complex. Upon agonist binding (B), the receptor undergoes a conformational change that
activates its Guanine nucleotide Exchange Factor (GEF) , which catalyzes the exchange of GDP to GTP in the Gα subunit. GTP-bound Gα and the Gβγ complex dissociates and that activates downstream signaling (C). Hydrolysis of GTP to GDP, which may be stimulated by
Regulators of G protein Signaling (RGS) proteins, leads to re-association of Gα and Gβγ subunits and termination of G protein signaling (D).
In the absence of a stimulus, the GDP-bound Gα subunit (Gα·GDP) and the Gβγ complex are associated (Figure 1.11). Ligand binding to the GPCR causes a conformational change in the
GPCR, which allows it to act as a Guanine nucleotide Exchange Factor (GEF). The GPCR can then activate an associated heterotrimeric G protein by exchanging its bound GDP to GTP [37]. The binding of GTP to the Gα subunit results in conformational changes within the three flex-ible switch regions of Gα (see Section 1.3.1.1), and leads to the dissociation of Gβγ from the heterotrimeric complex. Activated Gα and Gβγ proteins bind to various effectors that trans-mit signals to different second messengers such as adenylyl cyclases, phospholipases, and ion channels.
Gα signaling is terminated upon GTP hydrolysis. Although Gα has a slow capability to hy-drolyze GTP, the rate of this reaction is often accelerated by allosteric modulating proteins called Regulators of G protein Signaling (RGS) (Figure 1.11 D). Re-association of Gβγ with Gα·GDP terminates all interactions with effectors and form the initial inactive heterotrimeric complex [38, 39].
1.3.1. G-protein subunits
At present, there have been 16 Gα, 5 Gβ and 12 Gγ subunit genes identified [40]. Various combinations of heterotrimeric G proteins are possible. Each of the subunits possesses specific properties, which enable the transmission of specific signals.
1.3.1.1. The Gα subunit
There are at least 16 Gα genes in the human genome. When alternative splicing and post-translation modifications are taken into account - there are at least 23 known Gα proteins [41]. The molecular mass of Gα subunit varies from 39 to 45 kDa. Crystallographic studies revealed that the Gα subunit is composed of two major domains: a GTPase binding domain and an α-helical domain (Figure 1.12).
Figure 1.12.: Structure of Bos taurus Gα subunit. PBD code: 1GOT [42].
1.3. G PROTEIN SIGNALING PATHWAY GTPase domain is conserved among all members of the G protein superfamily. This domain hydrolyses GTP and provides the binding surfaces for the Gβγ dimer, GPCRs and effector proteins. GTPase domain contains three flexible loops, named switches I, II and III, where significant structural differences between GDP-bound and GTP-bound conformations of Gα were identified [43, 44, 45, 46]. The N- and C- terminal parts of the Gα subunit are important for the interaction with GPCRs [47].
The helical domain is unique for each Gα protein and is composed of a bundle of six α-helices that form a cover over the nucleotide-binding pocket, hiding them in the core of the protein (Figure 1.12).
On the basis of the sequence homology Gα proteins are divided into four major classes. Each class can be subdivided into several families (Table 1.1) [48, 41].
Class Family Effector
GαS αSL1, αSL2, αSS1, αSS2, αOlf Adenylyl cyclase (+)
Gαi/o
αi1, αi2, αi3 Adenylyl cyclase (-), Cl- and K- channels
(+), Phospholipase C and A2 (+) αt1, αt2, αGus cGMP phosphodiesterase (+)
αo1, αo2 Voltage dependent Ca2+ channels (-), K+
channels (+)
αz Adenylyl cyclase (-)
Gαq,11 αq, α11, α14, α15, α16 Phospholipase C (+)
Gα12,13 α12, α13 Phospholipase A2 (+), c-Jun
NH(2)-terminal kinase (+) Table 1.1.: Gα subunit classes and their effectors.
(+) Activation, (-) Inhibition.
All Gα subunits, except Gαt, are post-translationally modified with the fatty acid palmitate at
the N-terminus. Members of the Gαi family are also myristoylated at the N terminus. All these
modifications regulate membrane localization and protein – protein interactions [49].
Each Gα class is involved in specific signaling mechanisms (Figure 1.13). Although there are many exceptions and the signaling pathways are not that distinct between different classes of Gα proteins, however, three basic signaling patterns could be identified.
Figure 1.13.: Typical patterns of Receptor-Gα protein signaling in the cells.
AC- Adenylyl Cyclase, PKA - Protein Kinase A, EPAC - Exchange Proteins directly activated by cAMP, PDE - Phosphodiesterase, PLC - Phospholipase C, PIP2 - phosphatidylinositol
4,5-biphosphate, DAG - diacylglycerol, IP3 inositol triphosphate.
The GαS class
The GαSclass contains several families of GαSand a GαOlf family, which couples to the olfactory
receptors. They activate the Adenylyl Cyclase (AC), which stimulates the production of cAMP from ATP.
The downstream signaling of cAMP is mediated by its interactions with effector molecules, Protein Kinase A (PKA) or EPAC (Exchange Proteins directly activated by cAMP), which have been shown to modulate phagocyte functions.
The production of cAMP could be regulated by microbial pathogens [50]. Pertussis toxin and cholera toxin cause elevated cAMP levels through ADP-ribosylation of either the Gαi subunit
to prevent its inhibition of Adenylyl Cyclase or of the GαS subunit to constitutively activate
Adenylyl Cyclase, respectively. Phosphodiesterase (PDE), which degrades cAMP to AMP, is an-other regulator of intracellular cAMP levels. PDE inhibitors prevent such degradation, resulting in accumulation of intracellular cAMP [51].
1.3. G PROTEIN SIGNALING PATHWAY The Gαi/o class
The Gαi/o class contains several families of Gαi , Gαt, Gαo, one Gαz, and one GαGus protein
family. Gαi can inhibit Adenylyl Cyclase, which results in inhibition of the production of cAMP
from ATP [52]. The Gαt and GαGus activate the Phosphodiesterase, which degrades cAMP to
AMP, when coupled to Rhodopsin and Taste receptors respectively. Gαi can inhibit the
voltage-dependent Ca2+channels and activate Cl- and K+ channels.
Upon the dissociation of Gαi/o from Gβγ subunits, Phospholipase C (PLC) could be
acti-vated. Phospholipase C hydrolyzes phosphatidylinositol 4,5-biphosphate (PIP2) to diacylglycerol (DAG) and inositol triphosphate (IP3). Diacylglycerol acts as a second messenger and activates the Protein Kinase C (PKC). IP3 binds to its receptors on the endoplasmic reticulum causing the increase of intracellular [Ca2+] levels that triggers currently unknown signaling pathways,
which could cause cell chemotaxis [53].
The Gαq class
There are five families of Gαqproteins and all of them activate the Phospholipase C. The signaling
of GPCRs that couple to Gαq results in the increase of intracellular [Ca2+] that has an effect on
DAG-PKC interaction, which is crucial for activating downstream effectors [54].
Gα12,13 class
The Gα12,13class proteins activate the GTPases of the Rho family. They are related to
cytoskele-ton functions, smooth muscle contractions and neuronal morphogenesis [55]. The activation of Rho-GEF requires not only Gα12,13 but also PKC-mediated phosphorylation of Rho-GEF [56].
1.3.1.2. The Gβγ dimer
Five different genes encode the Gβ subunits, whereas Gγ subunits are encoded by 11 different genes [57]. Due to alternative splicing there are 6 Gβ members, while Gγ type has 12 members. Their molecular mass range from 35 to 37 kDa for Gβ, and 6 to 8 kDa for Gγ. The Gβ and Gγ subunits form a functional heterodimer, which is a stable structural unit. Most of the Gβ subunits can interact with different Gγ subunits, though not all of the possible dimer combinations occur. The existing Gβγ dimer combinations are specific for the tissue or cell type.
Figure 1.14.: Structure of Bos taurus Gβγ dimer. PBD code: 1GOT [42].
All Gβ subunits contain seven WD-40 repeats, a Tryptophan-Aspartic acid (WD) sequence that repeats about every 40 amino acids and forms small antiparallel β strands that mediates protein-protein interaction (Figure 1.14) [47]. Crystal structures of the Gβγ dimer and Gαβγ trimer demonstrated that these seven WD-40 repeats of the Gβ subunit folds into a seven-bladed β-propeller structure. The N-terminal part of the Gβ subunit forms an α-helix structure [58]. The Gγ subunit folds into two α-helices; the terminal helix forms a coiled-coil with the N-terminal α-helix of Gβ subunit, while the C-N-terminal helix makes extensive contacts with the base of the Gβ subunit seven-bladed β-propeller structure.
Several posttranslational modifications of Gβ have been characterized. The N-terminus of Gβ subunit undergoes the removal of the methionine at position 1, followed by N-acetylation of serine at position 2 [59]. Phosphorylation of Gβ1 histidine 266 by nucleoside diphosphate kinase
(NDPK) was predicted as a mechanism of G protein activation [60].
G protein localization at the cytoplasmic face of the plasma membrane of the cells is critical for the signaling [61]. This sub-cellular localization is facilitated due to Gγ subunit lipidation [62, 63]. The Gγ subunit post-translational modifications at the N- and terminus, such as C-terminal processing, the absence of prenylation, the N-C-terminal processing and phosphorylation, are critical for the G protein function[64]. All these post-translational modifications bring more diversity into the G protein heterotrimers and specificity for the signal transduction.
1.3. G PROTEIN SIGNALING PATHWAY Unlike the conformationally flexible Gα subunit, the Gβγ heterodimer does not undergo confor-mational change when it dissociates from the G-protein heterotrimer. The Gβγ heterodimer is able to interact with many effectors and also contribute to signal transduction. However, Gβγ association with Gα prevents Gβγ from activating its effectors. Table 1.2 identifies the main effectors of these proteins.
Class Family Effector
Gβ β1 to β6 Phospholipase C and A2 (+) Gγ γ1 to γ12
Adenylyl cyclase I (-), II and IV (+), GIRK (+), Ca2+ channels (-), MAPK
(+), Na+ channels (+), c-Jun
NH(2)-terminal kinase (+), PI3 kinase (+), PKC and PKD (+)
Table 1.2.: Gβγ subunit classes and their effectors. (+) Activation, (-) Inhibition.
Activated Gα and Gβγ proteins bind to various effectors that transmit the signal to different second messengers. Many effectors are regulated by both Gα and Gβγ subunits. Initially the Gβγ complex was considered as a passive partner of the Gα subunit. However, now it is clear that Gβγ subunit can regulate various effectors. The Gβγ complex mediated signaling includes regulation of ion channels such as G protein regulated inward rectifier potassium channel (GIRK) and Voltage-Dependent Ca2+ Channels (VDCC).
In addition to the ion channels, the Gβγ complex was shown to be a positive regulator of a large number of effectors including Adenylyl Cyclase, phospholipase C-β (PLC-β), phospholipase A (PLA), phosphoinositide-3-kinase (PI3K), Protein Kinase C (PKC), Protein Kinase D (PKD) and β-Adrenergic Receptor kinase [38].
1.3.2. G protein independent signaling
For many years it was considered that G protein activation is a necessary step in all signal trans-duction pathways induced by GPCRs. Growing number of receptor binding protein discoveries suggested that there are alternative signaling mechanisms (Figure 1.15). Some of these GPCR binding proteins have properties of signaling molecules with enzymatic activity; others appear to act as adaptor proteins that can promote kinase binding to the receptor. Such mechanisms allow direct cross-talk with other transduction pathways without GPCR interaction with G proteins.
Figure 1.15.: G protein independent signaling.
Following agonist binding, GPCRs can associate with members of diverse families of intracellular proteins, including polyproline-binding proteins such as those containing SH3 domains (SH3), β-arrestins, G Protein–coupled Receptor Kinases (GRK), small GTP-binding
proteins (g), SH2 domain–containing proteins (SH2) and PDZ domain–containing proteins (PDZ). All these interactions allow GPCRs to initiate multiple intracellular signaling pathways.
GRKs and Arrestins
Ligand activated GPCR, in addition to heterotrimeric G protein activation, is phosphorylated by a family of specific G protein coupled receptor kinases (GRKs) (Figure 1.16) [65]. This phosphorylation allows the cytosolic proteins known as β-arrestin to interact with the GPCR. Usually arrestins bind to the third intracellular loop and the C-terminal part of the GPCRs, the same region as G proteins. The association of arrestins with GPCRs does not simply uncouple receptors from G protein pathways (signaling to effector proteins), but rather induces a switch in receptor signaling from classical G protein mediated pathways to a process termed desensitization described thereafter.
1.3. G PROTEIN SIGNALING PATHWAY
Figure 1.16.: The signaling mediated by GRKs and Arrestins. Adapted from[66].
GRK and β-arrestins play additional roles in GPCR regulation and signaling. The agonist-induced interaction of β-arrestin with the phosphorylated GPCR allows the β-arrestin mediated recruitment of clatrin, thus triggering receptor internalization, dephosphorylation and recycling (Figure 1.16) [67]. In addition β-arrestin can interact with the cytosolic tyrosine kinase c-Src and promote its recruitment to the receptor signaling complex, suggesting a key role for GRK and β-arrestin function in modulation of mitogen-activated protein kinase (MAPK) cascades by GPCRs.
The β-arrestin activates the GPCR-stimulated Mitogen-Activated Protein (MAP) kinase. This pathway was analyzed in a study of the β2AR [68].
SH2 domain-containing signaling proteins
GPCRs and SH2 domain based signaling complexes act similarly as receptor tyrosin kinases and GRKs [69]. Following stimulation with Angiotensin II the heptahelical Angiotensin AT1 receptor activates JAK2 tyrosine kinase. This mechanism involves Src mediated tyrosine phosphorylation of the AT1 receptor[70].
Small GTP binding proteins
GPCR mediates regulation of small GTP binding proteins such as Ras, Rab, Rho and ARF, which can activate the phospholipase D. It was demonstrated that GPCR activated phospholipase D is not blocked by the inhibitors of the heterotrimeric G protein pathways, which confirms that this activation is independent of G proteins [71].
PDZ domain containing proteins
GPCRs can also interact with the PDZ domain containing proteins. These PDZ domains gener-ally bind to the C-terminal motif (S/T-x-L) of target proteins [72, 73].
Polyproline binding proteins
Some GPCRs exhibit polyproline regions on their third intracellular loop or C-terminal tails. These polyproline regions are known to mediate binding of conserved protein domains such as SH3 domains, WW domains (two highly conserved tryptophans) and EVH (Enabled/VASP homology) domains [74, 75, 76, 77].
1.3.3. Desensitization
Desensitization reduces receptor activity and plays a role in signal duration, intensity and quality. Desensitization is initiated by phosphorylation of Serine and/or Threonine residues in the third intracellular loop and C-terminus of the receptor. Two types of desensitization are known: heterologous and homologous [78]. Both types are the result of receptor phosphorylation. 1.3.3.1. Homologous desensitization
Homologous desensitization is specific for agonist-occupied GPCR. The conformational change in GPCR caused by the agonist binding further allows GRK to interact with the receptor. Serine and Threonine in the intracellular loop and the C-terminal part of the GPCR are phosphorylated by GRK. This mechanism was demonstrated for the Rhodopsin and β2AR [79, 80]. Agonist activated and GRK phosphorylated GPCR binds to β-arrestin, which serves to inhibit G protein coupling. This way the active state of GPCR is terminated, and may also direct the receptor to clathrin-coated pits for internalization.
1.3.3.2. Heterologous desensitization
Heterologous desensitization is much less selective than the homologous desensitization. This mechanism uses kinases (PKA, PKC) that are activated by second messengers that phosphorylate all receptors present in the membrane without discriminating the active and inactive states. Consequently, a receptor can be activated by its ligand and cause a desensitization of another GPCR present in the same cell [81].
Just as GRK, the PKA and the PKC catalyse the phosphorylation of Ser/Thr residues that are located at the intracellular loops and the C-terminus of GPCR. The following process is similar to